Project
GSE49485: Hypoxia transcriptome sequencing of rat brain.
Navigation
Downloads
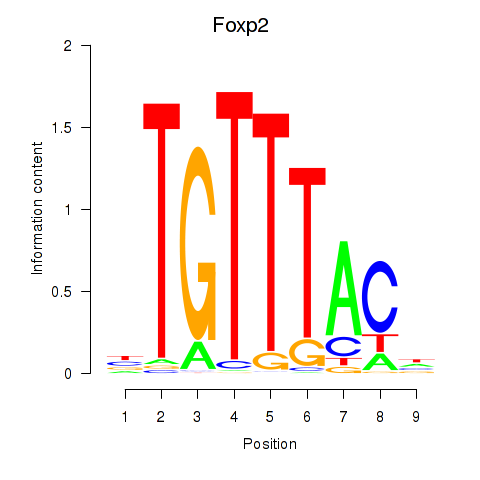
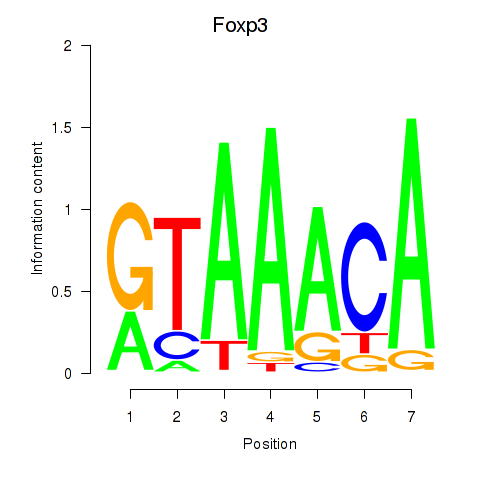
Results for Foxp2_Foxp3
Z-value: 0.63
Motif logo
Transcription factors associated with Foxp2_Foxp3
| Gene Symbol | Gene ID | Gene Info |
|---|---|---|
|
Foxp2
|
ENSRNOG00000054508 | forkhead box P2 |
|
Foxp3
|
ENSRNOG00000011702 | forkhead box P3 |
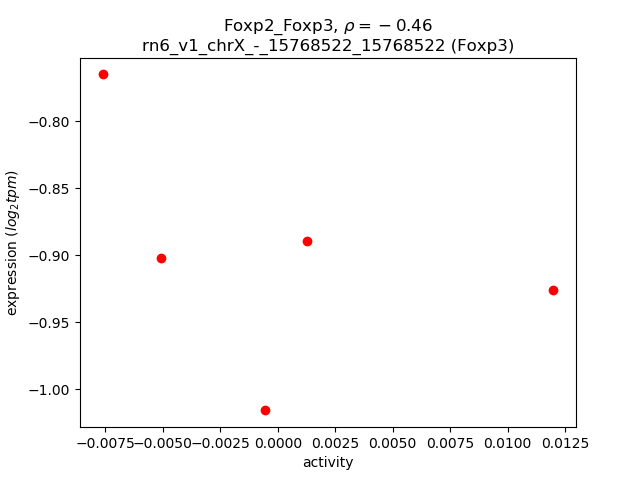
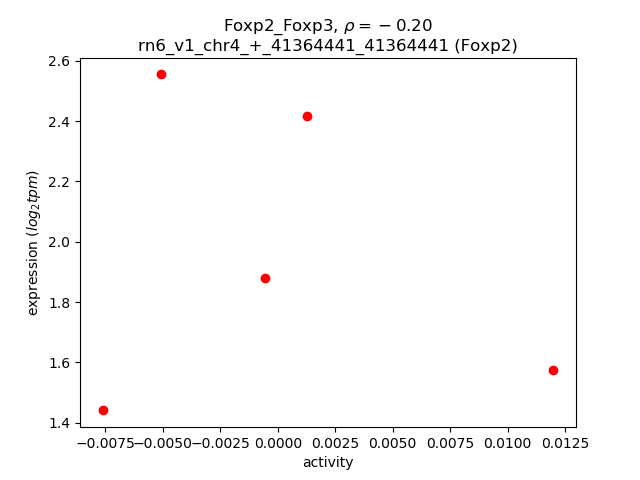
Activity-expression correlation:
| Gene | Promoter | Pearson corr. coef. | P-value | Plot |
|---|---|---|---|---|
| Foxp3 | rn6_v1_chrX_-_15768522_15768522 | -0.46 | 4.4e-01 | Click! |
| Foxp2 | rn6_v1_chr4_+_41364441_41364441 | -0.20 | 7.4e-01 | Click! |
Activity profile of Foxp2_Foxp3 motif
Sorted Z-values of Foxp2_Foxp3 motif
| Promoter | Log-likelihood | Transcript | Gene | Gene Info |
|---|---|---|---|---|
| chr16_-_20807070 | 0.50 |
ENSRNOT00000072536
|
Comp
|
cartilage oligomeric matrix protein |
| chr10_+_103395511 | 0.42 |
ENSRNOT00000004256
|
Gprc5c
|
G protein-coupled receptor, class C, group 5, member C |
| chr1_-_215536980 | 0.38 |
ENSRNOT00000027344
|
Ifitm10
|
interferon induced transmembrane protein 10 |
| chr18_-_5314511 | 0.32 |
ENSRNOT00000022637
ENSRNOT00000079682 |
Zfp521
|
zinc finger protein 521 |
| chr4_+_94696965 | 0.29 |
ENSRNOT00000064696
|
Grid2
|
glutamate ionotropic receptor delta type subunit 2 |
| chr4_-_30556814 | 0.26 |
ENSRNOT00000012760
|
Pdk4
|
pyruvate dehydrogenase kinase 4 |
| chr4_+_154309426 | 0.25 |
ENSRNOT00000019346
|
A2m
|
alpha-2-macroglobulin |
| chr17_-_1999596 | 0.24 |
ENSRNOT00000072220
|
1190003K10Rik
|
RIKEN cDNA 1190003K10 gene |
| chr13_+_97838361 | 0.21 |
ENSRNOT00000003641
|
Cnst
|
consortin, connexin sorting protein |
| chr4_+_169161585 | 0.20 |
ENSRNOT00000079785
|
Emp1
|
epithelial membrane protein 1 |
| chr15_+_34584320 | 0.19 |
ENSRNOT00000048255
|
AABR07017917.1
|
|
| chr17_-_61332391 | 0.19 |
ENSRNOT00000034599
|
LOC100362965
|
SNRPN upstream reading frame protein-like |
| chr16_-_19583386 | 0.19 |
ENSRNOT00000090131
|
Zfp617
|
zinc finger protein 617 |
| chr1_+_154606490 | 0.18 |
ENSRNOT00000024095
|
Ccdc89
|
coiled-coil domain containing 89 |
| chr1_+_261337594 | 0.18 |
ENSRNOT00000019874
|
Pi4k2a
|
phosphatidylinositol 4-kinase type 2 alpha |
| chr5_+_152533349 | 0.18 |
ENSRNOT00000067524
|
Trim63
|
tripartite motif containing 63 |
| chr8_-_80631873 | 0.18 |
ENSRNOT00000091661
ENSRNOT00000080662 |
Unc13c
|
unc-13 homolog C |
| chr8_+_57886168 | 0.18 |
ENSRNOT00000039336
|
Exph5
|
exophilin 5 |
| chr15_-_37983882 | 0.18 |
ENSRNOT00000087978
|
Lats2
|
large tumor suppressor kinase 2 |
| chr8_+_11931767 | 0.18 |
ENSRNOT00000087963
|
Maml2
|
mastermind-like transcriptional coactivator 2 |
| chr10_+_56662242 | 0.18 |
ENSRNOT00000086919
|
Asgr1
|
asialoglycoprotein receptor 1 |
| chr15_+_34552410 | 0.17 |
ENSRNOT00000027802
|
Khnyn
|
KH and NYN domain containing |
| chr2_-_3124543 | 0.17 |
ENSRNOT00000036547
|
Fam81b
|
family with sequence similarity 81, member B |
| chr14_-_3351553 | 0.17 |
ENSRNOT00000061556
|
Btbd8
|
BTB (POZ) domain containing 8 |
| chr4_+_168599331 | 0.17 |
ENSRNOT00000086719
|
Crebl2
|
cAMP responsive element binding protein-like 2 |
| chr13_+_90533365 | 0.17 |
ENSRNOT00000082469
|
Dcaf8
|
DDB1 and CUL4 associated factor 8 |
| chr1_-_156327352 | 0.16 |
ENSRNOT00000074282
|
LOC100911776
|
coiled-coil domain-containing protein 89-like |
| chr10_-_59888198 | 0.15 |
ENSRNOT00000093482
ENSRNOT00000049311 ENSRNOT00000093230 |
Aspa
|
aspartoacylase |
| chr10_-_74298599 | 0.15 |
ENSRNOT00000007379
|
Ypel2
|
yippee-like 2 |
| chr20_+_29655226 | 0.15 |
ENSRNOT00000089059
|
Spock2
|
SPARC/osteonectin, cwcv and kazal like domains proteoglycan 2 |
| chr20_+_46429222 | 0.15 |
ENSRNOT00000076818
|
Foxo3
|
forkhead box O3 |
| chr3_-_7498555 | 0.14 |
ENSRNOT00000017725
|
Barhl1
|
BarH-like homeobox 1 |
| chr8_+_65733400 | 0.14 |
ENSRNOT00000089126
|
Uaca
|
uveal autoantigen with coiled-coil domains and ankyrin repeats |
| chr3_-_44086006 | 0.14 |
ENSRNOT00000034449
ENSRNOT00000082604 |
Ermn
|
ermin |
| chr8_-_50245838 | 0.13 |
ENSRNOT00000035310
|
Sidt2
|
SID1 transmembrane family, member 2 |
| chr4_+_68656928 | 0.13 |
ENSRNOT00000016232
|
Tas2r108
|
taste receptor, type 2, member 108 |
| chr1_+_220114228 | 0.13 |
ENSRNOT00000026718
|
Ctsf
|
cathepsin F |
| chr10_-_59883839 | 0.13 |
ENSRNOT00000093579
|
Aspa
|
aspartoacylase |
| chr10_+_11393103 | 0.13 |
ENSRNOT00000076022
|
Adcy9
|
adenylate cyclase 9 |
| chr12_+_17253791 | 0.13 |
ENSRNOT00000083814
|
Zfand2a
|
zinc finger AN1-type containing 2A |
| chr4_+_157438605 | 0.12 |
ENSRNOT00000079988
|
AC115420.4
|
|
| chr1_-_43831932 | 0.12 |
ENSRNOT00000082931
|
Cnksr3
|
Cnksr family member 3 |
| chr14_+_81819799 | 0.12 |
ENSRNOT00000076840
|
Mxd4
|
Max dimerization protein 4 |
| chr4_+_153921115 | 0.11 |
ENSRNOT00000018821
|
Slc6a12
|
solute carrier family 6 member 12 |
| chr18_+_27558089 | 0.11 |
ENSRNOT00000027499
|
Fam53c
|
family with sequence similarity 53, member C |
| chr14_+_83560541 | 0.11 |
ENSRNOT00000057738
ENSRNOT00000085228 |
Pik3ip1
|
phosphoinositide-3-kinase interacting protein 1 |
| chr8_+_94686938 | 0.11 |
ENSRNOT00000013285
|
Ripply2
|
ripply transcriptional repressor 2 |
| chr5_-_60559533 | 0.11 |
ENSRNOT00000092899
|
Zbtb5
|
zinc finger and BTB domain containing 5 |
| chr10_+_11206226 | 0.10 |
ENSRNOT00000006979
|
Tfap4
|
transcription factor AP-4 |
| chr14_+_79205466 | 0.10 |
ENSRNOT00000085534
|
Tbc1d14
|
TBC1 domain family, member 14 |
| chrX_+_111122552 | 0.10 |
ENSRNOT00000083566
ENSRNOT00000085078 ENSRNOT00000090928 |
Cldn2
|
claudin 2 |
| chr5_-_12526962 | 0.10 |
ENSRNOT00000092104
|
St18
|
suppression of tumorigenicity 18 |
| chr3_+_103773459 | 0.10 |
ENSRNOT00000079727
|
Slc12a6
|
solute carrier family 12, member 6 |
| chr16_+_27399467 | 0.10 |
ENSRNOT00000065642
|
Tll1
|
tolloid-like 1 |
| chr17_+_81922329 | 0.10 |
ENSRNOT00000031542
|
Cacnb2
|
calcium voltage-gated channel auxiliary subunit beta 2 |
| chr10_-_85825735 | 0.10 |
ENSRNOT00000055379
|
Fbxo47
|
F-box protein 47 |
| chr4_+_57855416 | 0.10 |
ENSRNOT00000029608
|
Cpa2
|
carboxypeptidase A2 |
| chr7_+_79638046 | 0.10 |
ENSRNOT00000029419
|
Zfpm2
|
zinc finger protein, multitype 2 |
| chr10_+_56662561 | 0.09 |
ENSRNOT00000025254
|
Asgr1
|
asialoglycoprotein receptor 1 |
| chr9_-_38196273 | 0.09 |
ENSRNOT00000044452
|
Dst
|
dystonin |
| chr13_-_98480419 | 0.09 |
ENSRNOT00000086306
|
Coq8a
|
coenzyme Q8A |
| chr4_-_17594598 | 0.09 |
ENSRNOT00000008936
|
Sema3e
|
semaphorin 3E |
| chr5_+_24434872 | 0.09 |
ENSRNOT00000010696
|
Ccne2
|
cyclin E2 |
| chr20_+_6356423 | 0.09 |
ENSRNOT00000000628
|
Cdkn1a
|
cyclin-dependent kinase inhibitor 1A |
| chr3_+_95715193 | 0.09 |
ENSRNOT00000089525
|
Pax6
|
paired box 6 |
| chr7_-_107775712 | 0.09 |
ENSRNOT00000010811
ENSRNOT00000093459 |
Ndrg1
|
N-myc downstream regulated 1 |
| chr17_-_1093873 | 0.09 |
ENSRNOT00000086130
|
Ptch1
|
patched 1 |
| chr4_+_154423209 | 0.09 |
ENSRNOT00000075799
|
LOC100911545
|
alpha-2-macroglobulin-like |
| chr5_-_157165767 | 0.08 |
ENSRNOT00000000167
|
Ubxn10
|
UBX domain protein 10 |
| chr3_-_101465995 | 0.08 |
ENSRNOT00000080175
|
Bbox1
|
gamma-butyrobetaine hydroxylase 1 |
| chr3_-_162579201 | 0.08 |
ENSRNOT00000068328
|
Zmynd8
|
zinc finger, MYND-type containing 8 |
| chr4_-_115239723 | 0.08 |
ENSRNOT00000042699
|
Actg2
|
actin, gamma 2, smooth muscle, enteric |
| chr10_-_88307412 | 0.08 |
ENSRNOT00000089933
|
Jup
|
junction plakoglobin |
| chr2_-_233743866 | 0.08 |
ENSRNOT00000087062
|
Enpep
|
glutamyl aminopeptidase |
| chr3_+_33641616 | 0.08 |
ENSRNOT00000051953
|
Epc2
|
enhancer of polycomb homolog 2 |
| chr12_-_1816414 | 0.07 |
ENSRNOT00000041155
ENSRNOT00000067448 |
Insr
|
insulin receptor |
| chrX_-_111887906 | 0.07 |
ENSRNOT00000085118
|
Tsc22d3
|
TSC22 domain family, member 3 |
| chr3_-_40477754 | 0.07 |
ENSRNOT00000091168
|
AABR07052166.1
|
|
| chr10_+_89645973 | 0.07 |
ENSRNOT00000086892
|
Dhx8
|
DEAH-box helicase 8 |
| chr16_-_25192675 | 0.07 |
ENSRNOT00000032289
|
March1
|
membrane associated ring-CH-type finger 1 |
| chr3_-_119330345 | 0.07 |
ENSRNOT00000077398
ENSRNOT00000079191 |
Trpm7
|
transient receptor potential cation channel, subfamily M, member 7 |
| chr13_-_35668968 | 0.07 |
ENSRNOT00000042862
ENSRNOT00000003428 |
Epb41l5
|
erythrocyte membrane protein band 4.1 like 5 |
| chr8_-_94920441 | 0.07 |
ENSRNOT00000014165
|
Cep162
|
centrosomal protein 162 |
| chr8_-_104593625 | 0.07 |
ENSRNOT00000016625
|
Zbtb38
|
zinc finger and BTB domain containing 38 |
| chr2_-_198016898 | 0.07 |
ENSRNOT00000025523
|
Car14
|
carbonic anhydrase 14 |
| chr1_+_190666149 | 0.07 |
ENSRNOT00000089361
|
LOC102547219
|
uncharacterized LOC102547219 |
| chr10_+_89646195 | 0.07 |
ENSRNOT00000048140
|
Dhx8
|
DEAH-box helicase 8 |
| chr4_-_115516296 | 0.07 |
ENSRNOT00000019399
|
Paip2b
|
poly(A) binding protein interacting protein 2B |
| chr2_+_53109684 | 0.07 |
ENSRNOT00000086590
|
Selenop
|
selenoprotein P |
| chr3_+_40038336 | 0.07 |
ENSRNOT00000048804
|
Galnt13
|
polypeptide N-acetylgalactosaminyltransferase 13 |
| chr6_-_4520604 | 0.07 |
ENSRNOT00000042230
ENSRNOT00000043870 ENSRNOT00000070918 ENSRNOT00000046246 ENSRNOT00000052367 ENSRNOT00000042251 |
Slc8a1
|
solute carrier family 8 member A1 |
| chr2_+_185590986 | 0.07 |
ENSRNOT00000088807
ENSRNOT00000088188 |
Lrba
|
LPS responsive beige-like anchor protein |
| chr6_-_80102635 | 0.07 |
ENSRNOT00000084611
|
Sec23a
|
Sec23 homolog A, coat complex II component |
| chr3_+_171832500 | 0.07 |
ENSRNOT00000007554
|
Vapb
|
VAMP associated protein B and C |
| chr2_+_155718359 | 0.07 |
ENSRNOT00000077973
|
Kcnab1
|
potassium voltage-gated channel subfamily A member regulatory beta subunit 1 |
| chr13_-_80775230 | 0.07 |
ENSRNOT00000091389
ENSRNOT00000004762 |
Fmo2
|
flavin containing monooxygenase 2 |
| chr3_-_156777999 | 0.07 |
ENSRNOT00000032588
ENSRNOT00000091208 |
Zhx3
|
zinc fingers and homeoboxes 3 |
| chr20_+_26893016 | 0.07 |
ENSRNOT00000082430
|
Dnajc12
|
DnaJ heat shock protein family (Hsp40) member C12 |
| chr6_+_108167716 | 0.07 |
ENSRNOT00000064426
|
Lin52
|
lin-52 DREAM MuvB core complex component |
| chr1_-_90149991 | 0.06 |
ENSRNOT00000076987
|
RGD1308428
|
similar to RIKEN cDNA 4931406P16 |
| chr10_-_88307132 | 0.06 |
ENSRNOT00000040845
|
Jup
|
junction plakoglobin |
| chr6_+_12362813 | 0.06 |
ENSRNOT00000022370
|
Ston1
|
stonin 1 |
| chr3_-_148932878 | 0.06 |
ENSRNOT00000013881
|
Nol4l
|
nucleolar protein 4-like |
| chr1_-_265542276 | 0.06 |
ENSRNOT00000065172
|
Mgea5
|
meningioma expressed antigen 5 (hyaluronidase) |
| chr11_-_17119582 | 0.06 |
ENSRNOT00000087665
|
RGD1563888
|
similar to DNA segment, Chr 16, ERATO Doi 472, expressed |
| chr17_-_9721542 | 0.06 |
ENSRNOT00000047958
ENSRNOT00000079063 |
Grk6
|
G protein-coupled receptor kinase 6 |
| chr5_-_76756140 | 0.06 |
ENSRNOT00000022107
ENSRNOT00000089251 |
Ptbp3
|
polypyrimidine tract binding protein 3 |
| chr4_-_176528110 | 0.06 |
ENSRNOT00000049569
|
Slco1a2
|
solute carrier organic anion transporter family, member 1A2 |
| chr11_+_65743892 | 0.06 |
ENSRNOT00000085226
|
AC106292.2
|
|
| chr2_-_123972356 | 0.06 |
ENSRNOT00000023348
|
Il21
|
interleukin 21 |
| chr8_-_111721303 | 0.06 |
ENSRNOT00000045628
ENSRNOT00000012725 |
Tf
|
transferrin |
| chr1_-_59347472 | 0.06 |
ENSRNOT00000017718
|
Lnpep
|
leucyl and cystinyl aminopeptidase |
| chr10_+_105393072 | 0.06 |
ENSRNOT00000013359
|
Ubald2
|
UBA-like domain containing 2 |
| chr8_-_49109981 | 0.06 |
ENSRNOT00000019933
|
Ttc36
|
tetratricopeptide repeat domain 36 |
| chr2_+_95008477 | 0.06 |
ENSRNOT00000015327
|
Tpd52
|
tumor protein D52 |
| chr4_-_170860225 | 0.06 |
ENSRNOT00000007577
|
Mgp
|
matrix Gla protein |
| chr2_-_116413043 | 0.06 |
ENSRNOT00000078148
|
Mynn
|
myoneurin |
| chr1_-_124803363 | 0.06 |
ENSRNOT00000066380
|
Klf13
|
Kruppel-like factor 13 |
| chr12_-_40822159 | 0.06 |
ENSRNOT00000001826
|
Hectd4
|
HECT domain E3 ubiquitin protein ligase 4 |
| chr4_+_62380914 | 0.06 |
ENSRNOT00000029845
|
Tmem140
|
transmembrane protein 140 |
| chrX_+_15669191 | 0.06 |
ENSRNOT00000013553
|
Magix
|
MAGI family member, X-linked |
| chr20_-_54517709 | 0.06 |
ENSRNOT00000076234
|
Grik2
|
glutamate ionotropic receptor kainate type subunit 2 |
| chr15_+_108956448 | 0.06 |
ENSRNOT00000046324
|
AC123185.1
|
|
| chr15_+_41937880 | 0.06 |
ENSRNOT00000032514
|
Kcnrg
|
potassium channel regulator |
| chr2_+_43271092 | 0.05 |
ENSRNOT00000017571
|
Mier3
|
mesoderm induction early response 1, family member 3 |
| chr1_+_221236773 | 0.05 |
ENSRNOT00000051979
|
Slc25a45
|
solute carrier family 25, member 45 |
| chr6_+_27887797 | 0.05 |
ENSRNOT00000015827
|
Asxl2
|
additional sex combs like 2, transcriptional regulator |
| chr18_+_16146447 | 0.05 |
ENSRNOT00000022117
|
Galnt1
|
polypeptide N-acetylgalactosaminyltransferase 1 |
| chr2_+_200603426 | 0.05 |
ENSRNOT00000072189
|
LOC102550892
|
zinc finger protein 697-like |
| chr15_-_80713153 | 0.05 |
ENSRNOT00000063800
|
Klhl1
|
kelch-like family member 1 |
| chr9_+_118849302 | 0.05 |
ENSRNOT00000087592
|
Dlgap1
|
DLG associated protein 1 |
| chr1_-_143256817 | 0.05 |
ENSRNOT00000078789
|
Cpeb1
|
cytoplasmic polyadenylation element binding protein 1 |
| chr3_+_60024013 | 0.05 |
ENSRNOT00000025255
|
Scrn3
|
secernin 3 |
| chr15_-_52399074 | 0.05 |
ENSRNOT00000018440
|
Xpo7
|
exportin 7 |
| chr18_+_29972808 | 0.05 |
ENSRNOT00000074051
|
Pcdha4
|
protocadherin alpha 4 |
| chr5_-_7874909 | 0.05 |
ENSRNOT00000064774
|
Prex2
|
phosphatidylinositol-3,4,5-trisphosphate-dependent Rac exchange factor 2 |
| chr8_+_13305152 | 0.05 |
ENSRNOT00000012940
|
Mre11a
|
MRE11 homolog A, double strand break repair nuclease |
| chr8_+_116094851 | 0.05 |
ENSRNOT00000084120
|
RGD1307461
|
similar to RIKEN cDNA 6430571L13 gene; similar to g20 protein |
| chr20_+_3558827 | 0.05 |
ENSRNOT00000088130
|
Ddr1
|
discoidin domain receptor tyrosine kinase 1 |
| chr10_-_40296470 | 0.05 |
ENSRNOT00000086456
|
Tnip1
|
TNFAIP3 interacting protein 1 |
| chr9_+_88133884 | 0.05 |
ENSRNOT00000077265
|
Rhbdd1
|
rhomboid domain containing 1 |
| chr1_-_216744066 | 0.05 |
ENSRNOT00000087961
|
Nap1l4
|
nucleosome assembly protein 1-like 4 |
| chr1_+_68436917 | 0.05 |
ENSRNOT00000088586
|
LOC108348118
|
leucyl-cystinyl aminopeptidase |
| chr6_-_76535517 | 0.05 |
ENSRNOT00000083857
|
Ralgapa1
|
Ral GTPase activating protein catalytic alpha subunit 1 |
| chr6_+_43234526 | 0.05 |
ENSRNOT00000086808
|
Asap2
|
ArfGAP with SH3 domain, ankyrin repeat and PH domain 2 |
| chr13_-_97838228 | 0.05 |
ENSRNOT00000003618
|
Tfb2m
|
transcription factor B2, mitochondrial |
| chr12_+_21767606 | 0.05 |
ENSRNOT00000059602
|
LOC103691013
|
neuronal tyrosine-phosphorylated phosphoinositide-3-kinase adapter 1-like |
| chr4_+_14001761 | 0.05 |
ENSRNOT00000076519
|
Cd36
|
CD36 molecule |
| chr6_-_44363915 | 0.05 |
ENSRNOT00000085925
|
Id2
|
inhibitor of DNA binding 2, HLH protein |
| chr19_-_52206310 | 0.05 |
ENSRNOT00000087886
|
Mbtps1
|
membrane-bound transcription factor peptidase, site 1 |
| chr14_-_86900042 | 0.05 |
ENSRNOT00000091193
|
Wap
|
whey acidic protein |
| chr18_+_30890869 | 0.05 |
ENSRNOT00000060466
|
Pcdhgb6
|
protocadherin gamma subfamily B, 6 |
| chr1_+_15642153 | 0.05 |
ENSRNOT00000079845
|
Map7
|
microtubule-associated protein 7 |
| chr1_-_189182306 | 0.05 |
ENSRNOT00000021249
|
Gp2
|
glycoprotein 2 |
| chr4_+_70572942 | 0.05 |
ENSRNOT00000051964
|
AC142181.1
|
|
| chr5_-_16799776 | 0.05 |
ENSRNOT00000011721
|
Plag1
|
PLAG1 zinc finger |
| chr2_-_247988462 | 0.05 |
ENSRNOT00000022387
|
Pdlim5
|
PDZ and LIM domain 5 |
| chr10_-_94988461 | 0.04 |
ENSRNOT00000048490
|
Ddx5
|
DEAD-box helicase 5 |
| chr9_+_67234303 | 0.04 |
ENSRNOT00000050179
|
Abi2
|
abl-interactor 2 |
| chr10_+_14240219 | 0.04 |
ENSRNOT00000020233
|
Igfals
|
insulin-like growth factor binding protein, acid labile subunit |
| chr13_-_89654244 | 0.04 |
ENSRNOT00000004896
|
Ppox
|
protoporphyrinogen oxidase |
| chrX_+_15113878 | 0.04 |
ENSRNOT00000007464
|
Wdr13
|
WD repeat domain 13 |
| chr20_+_5262946 | 0.04 |
ENSRNOT00000082900
|
Brd2
|
bromodomain containing 2 |
| chr7_-_144269486 | 0.04 |
ENSRNOT00000090051
|
Atp5g2
|
ATP synthase, H+ transporting, mitochondrial Fo complex, subunit C2 (subunit 9) |
| chr10_+_14248399 | 0.04 |
ENSRNOT00000077689
|
Spsb3
|
splA/ryanodine receptor domain and SOCS box containing 3 |
| chr8_-_13906355 | 0.04 |
ENSRNOT00000029634
|
Cep295
|
centrosomal protein 295 |
| chr8_+_50559126 | 0.04 |
ENSRNOT00000024918
|
Apoa5
|
apolipoprotein A5 |
| chr6_-_3355339 | 0.04 |
ENSRNOT00000084602
|
Map4k3
|
mitogen-activated protein kinase kinase kinase kinase 3 |
| chr1_-_252550394 | 0.04 |
ENSRNOT00000083468
|
Acta2
|
actin, alpha 2, smooth muscle, aorta |
| chr2_-_205212681 | 0.04 |
ENSRNOT00000022575
|
Tshb
|
thyroid stimulating hormone, beta |
| chr10_-_104637823 | 0.04 |
ENSRNOT00000010826
|
Wbp2
|
WW domain binding protein 2 |
| chr1_+_68436593 | 0.04 |
ENSRNOT00000080325
|
LOC108348118
|
leucyl-cystinyl aminopeptidase |
| chrX_+_157759624 | 0.04 |
ENSRNOT00000003192
|
LOC686087
|
similar to motile sperm domain containing 1 |
| chr1_+_247228061 | 0.04 |
ENSRNOT00000020809
|
Rcl1
|
RNA terminal phosphate cyclase-like 1 |
| chr3_+_116899878 | 0.04 |
ENSRNOT00000090802
ENSRNOT00000066101 |
Sema6d
|
semaphorin 6D |
| chr4_+_62221011 | 0.04 |
ENSRNOT00000041264
|
Cald1
|
caldesmon 1 |
| chr3_-_168018410 | 0.04 |
ENSRNOT00000087579
|
Bcas1
|
breast carcinoma amplified sequence 1 |
| chr9_-_16581078 | 0.04 |
ENSRNOT00000022582
|
Pex6
|
peroxisomal biogenesis factor 6 |
| chr2_-_200003443 | 0.04 |
ENSRNOT00000024900
ENSRNOT00000088041 |
Pde4dip
|
phosphodiesterase 4D interacting protein |
| chr10_+_56824505 | 0.04 |
ENSRNOT00000067128
|
Slc16a11
|
solute carrier family 16, member 11 |
| chr6_+_54488038 | 0.04 |
ENSRNOT00000084661
ENSRNOT00000005637 |
Snx13
|
sorting nexin 13 |
| chr15_-_77736892 | 0.04 |
ENSRNOT00000057924
|
Pcdh9
|
protocadherin 9 |
| chr7_-_137856485 | 0.04 |
ENSRNOT00000007003
|
LOC688906
|
similar to splicing factor, arginine/serine-rich 2, interacting protein |
| chr3_-_38090526 | 0.04 |
ENSRNOT00000059430
|
Cacnb4
|
calcium voltage-gated channel auxiliary subunit beta 4 |
| chr10_-_87459652 | 0.04 |
ENSRNOT00000018804
|
Krt40
|
keratin 40 |
| chr13_-_49487892 | 0.04 |
ENSRNOT00000044972
|
Nfasc
|
neurofascin |
| chr3_+_93648343 | 0.04 |
ENSRNOT00000091164
|
AABR07053136.1
|
|
| chr13_-_103264906 | 0.04 |
ENSRNOT00000090786
ENSRNOT00000085211 ENSRNOT00000057395 |
Iars2
|
isoleucyl-tRNA synthetase 2, mitochondrial |
| chr2_+_104744461 | 0.04 |
ENSRNOT00000016083
ENSRNOT00000082627 |
Cp
|
ceruloplasmin |
| chr7_-_125497691 | 0.04 |
ENSRNOT00000049445
|
AABR07058578.1
|
|
| chr18_-_26658892 | 0.04 |
ENSRNOT00000038247
|
Epb41l4a
|
erythrocyte membrane protein band 4.1 like 4A |
| chr10_-_93675991 | 0.04 |
ENSRNOT00000090662
|
March10
|
membrane associated ring-CH-type finger 10 |
| chr2_-_172361779 | 0.04 |
ENSRNOT00000085876
|
Schip1
|
schwannomin interacting protein 1 |
| chr6_-_67084234 | 0.04 |
ENSRNOT00000050372
|
Nova1
|
NOVA alternative splicing regulator 1 |
| chr10_-_87136026 | 0.04 |
ENSRNOT00000014230
ENSRNOT00000083233 |
Smarce1
|
SWI/SNF related, matrix associated, actin dependent regulator of chromatin, subfamily e, member 1 |
| chr4_+_139670092 | 0.04 |
ENSRNOT00000008879
|
Lrrn1
|
leucine rich repeat neuronal 1 |
| chr13_+_48287873 | 0.03 |
ENSRNOT00000068223
|
Fam72a
|
family with sequence similarity 72, member A |
| chr18_+_51492196 | 0.03 |
ENSRNOT00000020570
|
Gramd3
|
GRAM domain containing 3 |
| chr1_-_13395370 | 0.03 |
ENSRNOT00000085519
|
Ccdc28a
|
coiled-coil domain containing 28A |
| chr9_-_45206427 | 0.03 |
ENSRNOT00000042227
|
Aff3
|
AF4/FMR2 family, member 3 |
Network of associatons between targets according to the STRING database.

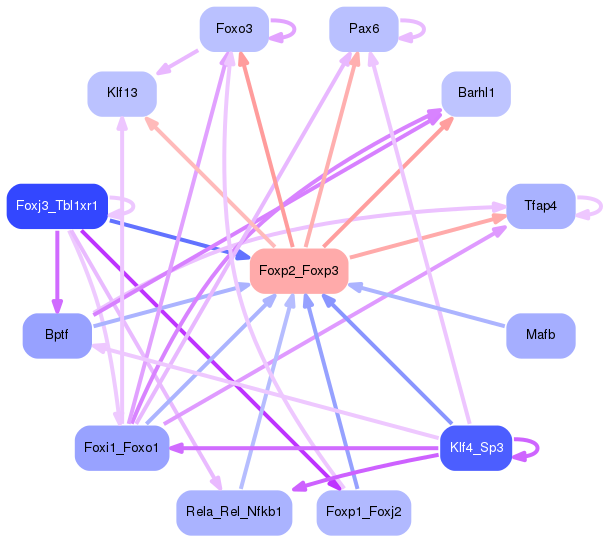
First level regulatory network of Foxp2_Foxp3
Gene Ontology Analysis
Gene overrepresentation in biological process category:
| Log-likelihood per target | Total log-likelihood | Term | Description |
|---|---|---|---|
| 0.1 | 0.3 | GO:0010510 | regulation of acetyl-CoA biosynthetic process from pyruvate(GO:0010510) |
| 0.1 | 0.3 | GO:1990402 | embryonic liver development(GO:1990402) |
| 0.1 | 0.2 | GO:0045575 | basophil activation(GO:0045575) |
| 0.1 | 0.2 | GO:0001828 | inner cell mass cellular morphogenesis(GO:0001828) |
| 0.1 | 0.2 | GO:0042998 | positive regulation of Golgi to plasma membrane protein transport(GO:0042998) |
| 0.0 | 0.2 | GO:0014878 | response to electrical stimulus involved in regulation of muscle adaptation(GO:0014878) |
| 0.0 | 0.1 | GO:0009957 | epidermal cell fate specification(GO:0009957) |
| 0.0 | 0.1 | GO:0042539 | hypotonic salinity response(GO:0042539) cellular hypotonic salinity response(GO:0071477) |
| 0.0 | 0.1 | GO:1904879 | positive regulation of calcium ion transmembrane transport via high voltage-gated calcium channel(GO:1904879) |
| 0.0 | 0.2 | GO:0007221 | positive regulation of transcription of Notch receptor target(GO:0007221) |
| 0.0 | 0.1 | GO:0021918 | pancreatic A cell development(GO:0003322) forebrain-midbrain boundary formation(GO:0021905) somatic motor neuron fate commitment(GO:0021917) regulation of transcription from RNA polymerase II promoter involved in somatic motor neuron fate commitment(GO:0021918) sensory neuron migration(GO:1904937) |
| 0.0 | 0.1 | GO:0002159 | desmosome assembly(GO:0002159) |
| 0.0 | 0.1 | GO:0009992 | cellular water homeostasis(GO:0009992) |
| 0.0 | 0.1 | GO:0071386 | cellular response to corticosterone stimulus(GO:0071386) |
| 0.0 | 0.1 | GO:0090131 | mesenchyme migration(GO:0090131) |
| 0.0 | 0.1 | GO:2000195 | negative regulation of female gonad development(GO:2000195) |
| 0.0 | 0.1 | GO:0048319 | axial mesoderm morphogenesis(GO:0048319) |
| 0.0 | 0.5 | GO:0003417 | growth plate cartilage development(GO:0003417) |
| 0.0 | 0.1 | GO:0033227 | dsRNA transport(GO:0033227) |
| 0.0 | 0.3 | GO:0021707 | cerebellar granular layer formation(GO:0021684) cerebellar granule cell differentiation(GO:0021707) |
| 0.0 | 0.1 | GO:0071955 | recycling endosome to Golgi transport(GO:0071955) |
| 0.0 | 0.1 | GO:1903758 | regulation of transcription from RNA polymerase II promoter by histone modification(GO:1903756) negative regulation of transcription from RNA polymerase II promoter by histone modification(GO:1903758) |
| 0.0 | 0.1 | GO:0010813 | neuropeptide catabolic process(GO:0010813) |
| 0.0 | 0.1 | GO:0019800 | peptide cross-linking via chondroitin 4-sulfate glycosaminoglycan(GO:0019800) |
| 0.0 | 0.2 | GO:0071985 | multivesicular body sorting pathway(GO:0071985) |
| 0.0 | 0.1 | GO:0043553 | negative regulation of phosphatidylinositol 3-kinase activity(GO:0043553) |
| 0.0 | 0.1 | GO:0072592 | oxygen metabolic process(GO:0072592) |
| 0.0 | 0.0 | GO:1904211 | membrane protein proteolysis involved in retrograde protein transport, ER to cytosol(GO:1904211) |
| 0.0 | 0.2 | GO:0031914 | negative regulation of synaptic plasticity(GO:0031914) |
| 0.0 | 0.1 | GO:0002003 | angiotensin maturation(GO:0002003) |
| 0.0 | 0.0 | GO:0001966 | thigmotaxis(GO:0001966) |
| 0.0 | 0.1 | GO:0060051 | negative regulation of protein glycosylation(GO:0060051) |
| 0.0 | 0.0 | GO:0002386 | immune response in mucosal-associated lymphoid tissue(GO:0002386) |
| 0.0 | 0.1 | GO:0097460 | positive regulation of oligodendrocyte progenitor proliferation(GO:0070447) ferrous iron import into cell(GO:0097460) ferrous iron import across plasma membrane(GO:0098707) |
| 0.0 | 0.1 | GO:0098735 | positive regulation of the force of heart contraction(GO:0098735) |
| 0.0 | 0.1 | GO:0045329 | carnitine biosynthetic process(GO:0045329) |
| 0.0 | 0.1 | GO:0010901 | regulation of very-low-density lipoprotein particle remodeling(GO:0010901) |
| 0.0 | 0.3 | GO:0022010 | central nervous system myelination(GO:0022010) axon ensheathment in central nervous system(GO:0032291) |
| 0.0 | 0.1 | GO:0060574 | intestinal epithelial cell maturation(GO:0060574) |
| 0.0 | 0.1 | GO:0060267 | positive regulation of respiratory burst(GO:0060267) |
| 0.0 | 0.1 | GO:0010360 | negative regulation of anion channel activity(GO:0010360) |
| 0.0 | 0.1 | GO:0010961 | cellular magnesium ion homeostasis(GO:0010961) |
| 0.0 | 0.1 | GO:2001269 | positive regulation of cysteine-type endopeptidase activity involved in apoptotic signaling pathway(GO:2001269) |
| 0.0 | 0.1 | GO:0006987 | activation of signaling protein activity involved in unfolded protein response(GO:0006987) |
| 0.0 | 0.0 | GO:0032915 | positive regulation of transforming growth factor beta2 production(GO:0032915) |
| 0.0 | 0.1 | GO:0000066 | mitochondrial ornithine transport(GO:0000066) |
| 0.0 | 0.1 | GO:1900157 | regulation of bone mineralization involved in bone maturation(GO:1900157) |
| 0.0 | 0.1 | GO:0018243 | protein O-linked glycosylation via serine(GO:0018242) protein O-linked glycosylation via threonine(GO:0018243) |
| 0.0 | 0.1 | GO:0070236 | negative regulation of activation-induced cell death of T cells(GO:0070236) |
| 0.0 | 0.1 | GO:0001580 | detection of chemical stimulus involved in sensory perception of bitter taste(GO:0001580) |
| 0.0 | 0.1 | GO:0031860 | telomeric 3' overhang formation(GO:0031860) |
| 0.0 | 0.1 | GO:1902260 | negative regulation of delayed rectifier potassium channel activity(GO:1902260) negative regulation of voltage-gated potassium channel activity(GO:1903817) |
| 0.0 | 0.0 | GO:0071442 | positive regulation of histone H3-K14 acetylation(GO:0071442) |
| 0.0 | 0.1 | GO:0032287 | peripheral nervous system myelin maintenance(GO:0032287) |
| 0.0 | 0.1 | GO:0002729 | positive regulation of natural killer cell cytokine production(GO:0002729) |
| 0.0 | 0.0 | GO:0016561 | protein import into peroxisome matrix, translocation(GO:0016561) |
Gene overrepresentation in cellular component category:
| Log-likelihood per target | Total log-likelihood | Term | Description |
|---|---|---|---|
| 0.1 | 0.2 | GO:0035838 | growing cell tip(GO:0035838) |
| 0.0 | 0.1 | GO:0071664 | catenin-TCF7L2 complex(GO:0071664) |
| 0.0 | 0.1 | GO:0070557 | PCNA-p21 complex(GO:0070557) |
| 0.0 | 0.1 | GO:0043293 | apoptosome(GO:0043293) |
| 0.0 | 0.1 | GO:0005899 | insulin receptor complex(GO:0005899) |
| 0.0 | 0.1 | GO:0033269 | internode region of axon(GO:0033269) |
| 0.0 | 0.1 | GO:0032777 | Piccolo NuA4 histone acetyltransferase complex(GO:0032777) |
| 0.0 | 0.1 | GO:0060053 | neurofilament cytoskeleton(GO:0060053) |
| 0.0 | 0.1 | GO:0044305 | calyx of Held(GO:0044305) |
| 0.0 | 0.1 | GO:0005879 | axonemal microtubule(GO:0005879) |
| 0.0 | 0.1 | GO:0030478 | actin cap(GO:0030478) |
Gene overrepresentation in molecular function category:
| Log-likelihood per target | Total log-likelihood | Term | Description |
|---|---|---|---|
| 0.1 | 0.5 | GO:0005499 | vitamin D binding(GO:0005499) |
| 0.1 | 0.3 | GO:0019807 | aspartoacylase activity(GO:0019807) |
| 0.1 | 0.3 | GO:0004740 | pyruvate dehydrogenase (acetyl-transferring) kinase activity(GO:0004740) |
| 0.1 | 0.2 | GO:0019959 | interleukin-8 binding(GO:0019959) |
| 0.1 | 0.2 | GO:0035651 | AP-3 adaptor complex binding(GO:0035651) |
| 0.0 | 0.1 | GO:0019912 | cyclin-dependent protein kinase activating kinase activity(GO:0019912) |
| 0.0 | 0.1 | GO:0005119 | smoothened binding(GO:0005119) |
| 0.0 | 0.1 | GO:0051032 | nucleic acid transmembrane transporter activity(GO:0051032) RNA transmembrane transporter activity(GO:0051033) |
| 0.0 | 0.2 | GO:0071253 | connexin binding(GO:0071253) |
| 0.0 | 0.1 | GO:0035827 | rubidium ion transmembrane transporter activity(GO:0035827) |
| 0.0 | 0.2 | GO:0019992 | diacylglycerol binding(GO:0019992) |
| 0.0 | 0.1 | GO:0005332 | gamma-aminobutyric acid:sodium symporter activity(GO:0005332) |
| 0.0 | 0.1 | GO:0051425 | PTB domain binding(GO:0051425) |
| 0.0 | 0.2 | GO:0008527 | taste receptor activity(GO:0008527) |
| 0.0 | 0.1 | GO:0033149 | FFAT motif binding(GO:0033149) |
| 0.0 | 0.1 | GO:0086056 | voltage-gated calcium channel activity involved in AV node cell action potential(GO:0086056) |
| 0.0 | 0.0 | GO:0000179 | rRNA (adenine-N6,N6-)-dimethyltransferase activity(GO:0000179) |
| 0.0 | 0.3 | GO:0005234 | extracellular-glutamate-gated ion channel activity(GO:0005234) |
| 0.0 | 0.2 | GO:0031432 | titin binding(GO:0031432) |
| 0.0 | 0.1 | GO:0004563 | beta-N-acetylhexosaminidase activity(GO:0004563) |
| 0.0 | 0.1 | GO:0043426 | MRF binding(GO:0043426) |
| 0.0 | 0.1 | GO:0005134 | interleukin-2 receptor binding(GO:0005134) |
| 0.0 | 0.1 | GO:0004653 | polypeptide N-acetylgalactosaminyltransferase activity(GO:0004653) |
| 0.0 | 0.1 | GO:0045294 | alpha-catenin binding(GO:0045294) |
| 0.0 | 0.1 | GO:0001595 | angiotensin receptor activity(GO:0001595) |
| 0.0 | 0.1 | GO:0047696 | beta-adrenergic receptor kinase activity(GO:0047696) |
| 0.0 | 0.1 | GO:0015349 | thyroid hormone transmembrane transporter activity(GO:0015349) |
Gene overrepresentation in curated gene sets: REACTOME pathways category:
| Log-likelihood per target | Total log-likelihood | Term | Description |
|---|---|---|---|
| 0.0 | 0.1 | REACTOME ENDOSOMAL VACUOLAR PATHWAY | Genes involved in Endosomal/Vacuolar pathway |
| 0.0 | 0.3 | REACTOME REGULATION OF PYRUVATE DEHYDROGENASE PDH COMPLEX | Genes involved in Regulation of pyruvate dehydrogenase (PDH) complex |
| 0.0 | 0.2 | REACTOME NOTCH HLH TRANSCRIPTION PATHWAY | Genes involved in Notch-HLH transcription pathway |
| 0.0 | 0.3 | REACTOME HDL MEDIATED LIPID TRANSPORT | Genes involved in HDL-mediated lipid transport |
| 0.0 | 0.2 | REACTOME SYNTHESIS OF PIPS AT THE EARLY ENDOSOME MEMBRANE | Genes involved in Synthesis of PIPs at the early endosome membrane |