Project
GSE49485: Hypoxia transcriptome sequencing of rat brain.
Navigation
Downloads
Results for Foxi1_Foxo1
Z-value: 0.95
Motif logo
Transcription factors associated with Foxi1_Foxo1
| Gene Symbol | Gene ID | Gene Info |
|---|---|---|
|
Foxi1
|
ENSRNOG00000006293 | forkhead box I1 |
|
Foxo1
|
ENSRNOG00000013397 | forkhead box O1 |
Activity-expression correlation:
| Gene | Promoter | Pearson corr. coef. | P-value | Plot |
|---|---|---|---|---|
| Foxi1 | rn6_v1_chr10_-_19164505_19164505 | 0.29 | 6.4e-01 | Click! |
| Foxo1 | rn6_v1_chr2_+_141451234_141451234 | 0.01 | 9.9e-01 | Click! |
Activity profile of Foxi1_Foxo1 motif
Sorted Z-values of Foxi1_Foxo1 motif
| Promoter | Log-likelihood | Transcript | Gene | Gene Info |
|---|---|---|---|---|
| chr18_-_15540177 | 1.67 |
ENSRNOT00000022113
|
Ttr
|
transthyretin |
| chr4_+_148782479 | 1.02 |
ENSRNOT00000018133
|
LOC500300
|
similar to hypothetical protein MGC6835 |
| chr7_+_28654733 | 0.79 |
ENSRNOT00000006174
|
Pmch
|
pro-melanin-concentrating hormone |
| chr17_+_78793336 | 0.79 |
ENSRNOT00000057898
|
Mt1
|
metallothionein 1 |
| chr16_-_20807070 | 0.78 |
ENSRNOT00000072536
|
Comp
|
cartilage oligomeric matrix protein |
| chr1_-_215536980 | 0.49 |
ENSRNOT00000027344
|
Ifitm10
|
interferon induced transmembrane protein 10 |
| chr18_-_5314511 | 0.48 |
ENSRNOT00000022637
ENSRNOT00000079682 |
Zfp521
|
zinc finger protein 521 |
| chr12_-_17186679 | 0.46 |
ENSRNOT00000001730
|
Uncx
|
UNC homeobox |
| chr8_+_48438259 | 0.46 |
ENSRNOT00000059813
|
Mfrp
|
membrane frizzled-related protein |
| chr10_-_90307658 | 0.44 |
ENSRNOT00000092102
|
Slc4a1
|
solute carrier family 4 member 1 |
| chr2_-_256154584 | 0.42 |
ENSRNOT00000072487
|
AABR07013776.1
|
|
| chr8_+_48437918 | 0.42 |
ENSRNOT00000085578
|
Mfrp
|
membrane frizzled-related protein |
| chr10_+_103395511 | 0.37 |
ENSRNOT00000004256
|
Gprc5c
|
G protein-coupled receptor, class C, group 5, member C |
| chr10_-_59883839 | 0.36 |
ENSRNOT00000093579
|
Aspa
|
aspartoacylase |
| chr20_-_4863011 | 0.35 |
ENSRNOT00000079503
|
Ltb
|
lymphotoxin beta |
| chrX_-_32153794 | 0.33 |
ENSRNOT00000005348
|
Tmem27
|
transmembrane protein 27 |
| chr1_+_168945449 | 0.33 |
ENSRNOT00000087661
ENSRNOT00000019913 |
LOC103694855
|
hemoglobin subunit beta-2-like |
| chr3_-_101465995 | 0.32 |
ENSRNOT00000080175
|
Bbox1
|
gamma-butyrobetaine hydroxylase 1 |
| chr20_-_9855443 | 0.32 |
ENSRNOT00000090275
ENSRNOT00000066266 |
Tff3
|
trefoil factor 3 |
| chr2_-_210116038 | 0.32 |
ENSRNOT00000074950
|
LOC684509
|
similar to NADH-ubiquinone oxidoreductase B9 subunit (Complex I-B9) (CI-B9) |
| chr8_-_23390773 | 0.31 |
ENSRNOT00000019601
ENSRNOT00000071846 |
Anln
|
anillin, actin binding protein |
| chrX_+_111122552 | 0.31 |
ENSRNOT00000083566
ENSRNOT00000085078 ENSRNOT00000090928 |
Cldn2
|
claudin 2 |
| chr7_-_125497691 | 0.30 |
ENSRNOT00000049445
|
AABR07058578.1
|
|
| chr2_+_58724855 | 0.30 |
ENSRNOT00000089609
|
Capsl
|
calcyphosine-like |
| chr4_+_154309426 | 0.30 |
ENSRNOT00000019346
|
A2m
|
alpha-2-macroglobulin |
| chr17_-_61332391 | 0.30 |
ENSRNOT00000034599
|
LOC100362965
|
SNRPN upstream reading frame protein-like |
| chr5_-_21345805 | 0.29 |
ENSRNOT00000081296
ENSRNOT00000007802 |
Car8
|
carbonic anhydrase 8 |
| chr4_-_176528110 | 0.29 |
ENSRNOT00000049569
|
Slco1a2
|
solute carrier organic anion transporter family, member 1A2 |
| chr17_-_1999596 | 0.29 |
ENSRNOT00000072220
|
1190003K10Rik
|
RIKEN cDNA 1190003K10 gene |
| chr4_-_160662974 | 0.29 |
ENSRNOT00000089199
|
Tspan9
|
tetraspanin 9 |
| chr2_+_195617021 | 0.28 |
ENSRNOT00000067042
ENSRNOT00000036656 |
Rorc
Lingo4
|
RAR-related orphan receptor C leucine rich repeat and Ig domain containing 4 |
| chr2_-_113616766 | 0.28 |
ENSRNOT00000016858
ENSRNOT00000074723 |
Tmem212
|
transmembrane protein 212 |
| chr5_-_152987211 | 0.28 |
ENSRNOT00000000163
|
Ldlrap1
|
low density lipoprotein receptor adaptor protein 1 |
| chr8_-_80631873 | 0.27 |
ENSRNOT00000091661
ENSRNOT00000080662 |
Unc13c
|
unc-13 homolog C |
| chr4_-_50312608 | 0.27 |
ENSRNOT00000010019
|
Fezf1
|
Fez family zinc finger 1 |
| chr20_+_5184515 | 0.27 |
ENSRNOT00000089411
|
LOC103694381
|
lymphotoxin-beta |
| chr10_+_103396155 | 0.25 |
ENSRNOT00000086924
|
Gprc5c
|
G protein-coupled receptor, class C, group 5, member C |
| chr4_+_152630469 | 0.25 |
ENSRNOT00000013721
|
Ninj2
|
ninjurin 2 |
| chr2_-_3124543 | 0.25 |
ENSRNOT00000036547
|
Fam81b
|
family with sequence similarity 81, member B |
| chr5_-_76756140 | 0.25 |
ENSRNOT00000022107
ENSRNOT00000089251 |
Ptbp3
|
polypyrimidine tract binding protein 3 |
| chr5_+_152533349 | 0.25 |
ENSRNOT00000067524
|
Trim63
|
tripartite motif containing 63 |
| chr7_+_141370491 | 0.25 |
ENSRNOT00000087662
|
Gpd1
|
glycerol-3-phosphate dehydrogenase 1 |
| chr4_-_30556814 | 0.25 |
ENSRNOT00000012760
|
Pdk4
|
pyruvate dehydrogenase kinase 4 |
| chr7_+_59200918 | 0.25 |
ENSRNOT00000085073
|
Ptprr
|
protein tyrosine phosphatase, receptor type, R |
| chr1_-_156327352 | 0.24 |
ENSRNOT00000074282
|
LOC100911776
|
coiled-coil domain-containing protein 89-like |
| chr14_+_43694183 | 0.24 |
ENSRNOT00000046342
|
RGD1563570
|
similar to ribosomal protein S23 |
| chr8_+_116776494 | 0.24 |
ENSRNOT00000050702
|
Cdhr4
|
cadherin-related family member 4 |
| chr17_-_22143324 | 0.24 |
ENSRNOT00000019361
|
Edn1
|
endothelin 1 |
| chr15_+_34584320 | 0.23 |
ENSRNOT00000048255
|
AABR07017917.1
|
|
| chr3_-_10153554 | 0.23 |
ENSRNOT00000093246
|
Exosc2
|
exosome component 2 |
| chr6_-_77421286 | 0.23 |
ENSRNOT00000011453
|
Nkx2-1
|
NK2 homeobox 1 |
| chr3_-_7498555 | 0.22 |
ENSRNOT00000017725
|
Barhl1
|
BarH-like homeobox 1 |
| chr14_+_83560541 | 0.22 |
ENSRNOT00000057738
ENSRNOT00000085228 |
Pik3ip1
|
phosphoinositide-3-kinase interacting protein 1 |
| chr20_-_4863198 | 0.22 |
ENSRNOT00000001108
|
Ltb
|
lymphotoxin beta |
| chr2_-_235249571 | 0.22 |
ENSRNOT00000093631
ENSRNOT00000085096 |
Rrh
|
retinal pigment epithelium derived rhodopsin homolog |
| chr4_-_82173207 | 0.21 |
ENSRNOT00000074167
|
Hoxa5
|
homeo box A5 |
| chr4_-_727691 | 0.21 |
ENSRNOT00000008497
|
Shh
|
sonic hedgehog |
| chr11_+_82945104 | 0.21 |
ENSRNOT00000002410
|
Ehhadh
|
enoyl-CoA hydratase and 3-hydroxyacyl CoA dehydrogenase |
| chr8_+_65733400 | 0.21 |
ENSRNOT00000089126
|
Uaca
|
uveal autoantigen with coiled-coil domains and ankyrin repeats |
| chr8_+_75516904 | 0.21 |
ENSRNOT00000013142
|
Rora
|
RAR-related orphan receptor A |
| chr10_+_56662561 | 0.20 |
ENSRNOT00000025254
|
Asgr1
|
asialoglycoprotein receptor 1 |
| chr8_+_94686938 | 0.20 |
ENSRNOT00000013285
|
Ripply2
|
ripply transcriptional repressor 2 |
| chr7_-_18577325 | 0.20 |
ENSRNOT00000084308
ENSRNOT00000090849 |
March2
|
membrane associated ring-CH-type finger 2 |
| chr12_-_38340327 | 0.20 |
ENSRNOT00000001672
|
LOC100359550
|
protein S100-A11-like |
| chr17_+_44763598 | 0.20 |
ENSRNOT00000079880
|
Hist1h3b
|
histone cluster 1, H3b |
| chr13_-_89654244 | 0.20 |
ENSRNOT00000004896
|
Ppox
|
protoporphyrinogen oxidase |
| chr1_+_29432152 | 0.19 |
ENSRNOT00000019436
ENSRNOT00000083276 |
Trmt11
|
tRNA methyltransferase 11 homolog |
| chr10_+_56662242 | 0.19 |
ENSRNOT00000086919
|
Asgr1
|
asialoglycoprotein receptor 1 |
| chr7_+_120580743 | 0.19 |
ENSRNOT00000017181
|
Maff
|
MAF bZIP transcription factor F |
| chrX_+_157759624 | 0.19 |
ENSRNOT00000003192
|
LOC686087
|
similar to motile sperm domain containing 1 |
| chr2_-_257474733 | 0.19 |
ENSRNOT00000016967
ENSRNOT00000066780 |
Nexn
|
nexilin (F actin binding protein) |
| chr4_+_83391283 | 0.19 |
ENSRNOT00000031365
|
Creb5
|
cAMP responsive element binding protein 5 |
| chr3_-_44086006 | 0.19 |
ENSRNOT00000034449
ENSRNOT00000082604 |
Ermn
|
ermin |
| chr2_-_198016898 | 0.19 |
ENSRNOT00000025523
|
Car14
|
carbonic anhydrase 14 |
| chr6_-_26486695 | 0.18 |
ENSRNOT00000073236
|
Krtcap3
|
keratinocyte associated protein 3 |
| chr4_+_154423209 | 0.18 |
ENSRNOT00000075799
|
LOC100911545
|
alpha-2-macroglobulin-like |
| chr4_-_121684264 | 0.18 |
ENSRNOT00000083168
|
Vom1r90
|
vomeronasal 1 receptor 90 |
| chr10_-_90312386 | 0.18 |
ENSRNOT00000028445
|
Slc4a1
|
solute carrier family 4 member 1 |
| chr11_+_36634662 | 0.18 |
ENSRNOT00000050178
|
B3galt5
|
Beta-1,3-galactosyltransferase 5 |
| chr20_+_3677474 | 0.17 |
ENSRNOT00000047663
|
Mt1m
|
metallothionein 1M |
| chr10_+_74724549 | 0.17 |
ENSRNOT00000009077
|
Tex14
|
testis expressed 14, intercellular bridge forming factor |
| chr7_-_145174771 | 0.17 |
ENSRNOT00000055270
|
Glycam1
|
glycosylation dependent cell adhesion molecule 1 |
| chr20_-_29738506 | 0.17 |
ENSRNOT00000000697
|
Chst3
|
carbohydrate sulfotransferase 3 |
| chr4_+_57855416 | 0.17 |
ENSRNOT00000029608
|
Cpa2
|
carboxypeptidase A2 |
| chr14_-_3351553 | 0.17 |
ENSRNOT00000061556
|
Btbd8
|
BTB (POZ) domain containing 8 |
| chr17_-_13393243 | 0.17 |
ENSRNOT00000018252
|
Gadd45g
|
growth arrest and DNA-damage-inducible, gamma |
| chr1_+_154606490 | 0.17 |
ENSRNOT00000024095
|
Ccdc89
|
coiled-coil domain containing 89 |
| chr3_-_40477754 | 0.16 |
ENSRNOT00000091168
|
AABR07052166.1
|
|
| chr4_+_94696965 | 0.16 |
ENSRNOT00000064696
|
Grid2
|
glutamate ionotropic receptor delta type subunit 2 |
| chr15_+_34552410 | 0.16 |
ENSRNOT00000027802
|
Khnyn
|
KH and NYN domain containing |
| chr20_+_6356423 | 0.16 |
ENSRNOT00000000628
|
Cdkn1a
|
cyclin-dependent kinase inhibitor 1A |
| chr5_+_24434872 | 0.16 |
ENSRNOT00000010696
|
Ccne2
|
cyclin E2 |
| chr5_+_50381244 | 0.16 |
ENSRNOT00000012385
|
Cga
|
glycoprotein hormones, alpha polypeptide |
| chr8_+_11931767 | 0.16 |
ENSRNOT00000087963
|
Maml2
|
mastermind-like transcriptional coactivator 2 |
| chr20_-_3372070 | 0.16 |
ENSRNOT00000080770
|
Dhx16
|
DEAH-box helicase 16 |
| chr15_-_25505691 | 0.16 |
ENSRNOT00000074488
|
LOC100911492
|
homeobox protein OTX2-like |
| chr15_+_30413488 | 0.16 |
ENSRNOT00000071781
|
AABR07017733.1
|
|
| chr1_-_67065797 | 0.16 |
ENSRNOT00000048152
|
Vom1r46
|
vomeronasal 1 receptor 46 |
| chr7_-_107775712 | 0.16 |
ENSRNOT00000010811
ENSRNOT00000093459 |
Ndrg1
|
N-myc downstream regulated 1 |
| chr1_+_240908483 | 0.15 |
ENSRNOT00000019367
|
Klf9
|
Kruppel-like factor 9 |
| chr2_+_51672722 | 0.15 |
ENSRNOT00000016485
|
Fgf10
|
fibroblast growth factor 10 |
| chr10_+_11206226 | 0.15 |
ENSRNOT00000006979
|
Tfap4
|
transcription factor AP-4 |
| chr12_+_38965063 | 0.15 |
ENSRNOT00000074936
|
Morn3
|
MORN repeat containing 3 |
| chr18_+_57011575 | 0.15 |
ENSRNOT00000026679
|
Il17b
|
interleukin 17B |
| chrX_-_106607352 | 0.15 |
ENSRNOT00000082858
|
AABR07040624.1
|
|
| chr10_-_94979259 | 0.15 |
ENSRNOT00000018394
|
Polg2
|
DNA polymerase gamma 2, accessory subunit |
| chr14_+_6221085 | 0.15 |
ENSRNOT00000068215
|
AABR07014259.1
|
|
| chr8_-_55276070 | 0.15 |
ENSRNOT00000041555
|
LOC108351703
|
60S ribosomal protein L27a-like |
| chrX_+_15669191 | 0.15 |
ENSRNOT00000013553
|
Magix
|
MAGI family member, X-linked |
| chr10_-_5533695 | 0.15 |
ENSRNOT00000051564
|
Rpl39l
|
ribosomal protein L39-like |
| chr3_+_79613171 | 0.15 |
ENSRNOT00000011467
|
Agbl2
|
ATP/GTP binding protein-like 2 |
| chr2_-_187401786 | 0.14 |
ENSRNOT00000025624
|
Hapln2
|
hyaluronan and proteoglycan link protein 2 |
| chr10_-_97750679 | 0.14 |
ENSRNOT00000078059
|
Slc16a6
|
solute carrier family 16, member 6 |
| chr9_+_12346117 | 0.14 |
ENSRNOT00000074599
|
AABR07066677.1
|
|
| chr18_-_410098 | 0.14 |
ENSRNOT00000084138
|
LOC102546764
|
cx9C motif-containing protein 4-like |
| chr10_-_85825735 | 0.14 |
ENSRNOT00000055379
|
Fbxo47
|
F-box protein 47 |
| chr8_-_111721303 | 0.14 |
ENSRNOT00000045628
ENSRNOT00000012725 |
Tf
|
transferrin |
| chr3_-_11820549 | 0.14 |
ENSRNOT00000020660
|
Cfap157
|
cilia and flagella associated protein 157 |
| chr5_-_76129441 | 0.14 |
ENSRNOT00000020335
|
Ptgr1
|
prostaglandin reductase 1 |
| chr7_+_2435553 | 0.14 |
ENSRNOT00000065593
|
Prim1
|
primase (DNA) subunit 1 |
| chr10_-_64108554 | 0.14 |
ENSRNOT00000081725
|
Rph3al
|
rabphilin 3A-like (without C2 domains) |
| chr4_-_89151184 | 0.14 |
ENSRNOT00000010263
|
Nap1l5
|
nucleosome assembly protein 1-like 5 |
| chr10_-_15603649 | 0.14 |
ENSRNOT00000051483
|
Hba-a2
|
hemoglobin alpha, adult chain 2 |
| chr19_+_55300395 | 0.14 |
ENSRNOT00000092169
|
Ctu2
|
cytosolic thiouridylase subunit 2 |
| chr9_+_94702129 | 0.14 |
ENSRNOT00000080930
|
Neu2
|
neuraminidase 2 |
| chr5_-_72000318 | 0.14 |
ENSRNOT00000029187
|
AABR07048308.1
|
|
| chr15_-_61873406 | 0.14 |
ENSRNOT00000045115
|
LOC100360244
|
LRRGT00053-like |
| chr1_+_227592635 | 0.14 |
ENSRNOT00000072135
|
Ms4a4a
|
membrane-spanning 4-domains, subfamily A, member 4A |
| chr5_-_169017295 | 0.13 |
ENSRNOT00000067481
|
Camta1
|
calmodulin binding transcription activator 1 |
| chrX_-_158925630 | 0.13 |
ENSRNOT00000073396
|
Ct45a9
|
cancer/testis antigen family 45 member A9 |
| chr10_-_15311189 | 0.13 |
ENSRNOT00000027371
|
Prr35
|
proline rich 35 |
| chr7_+_116090189 | 0.13 |
ENSRNOT00000081571
|
Psca
|
prostate stem cell antigen |
| chr20_+_46429222 | 0.13 |
ENSRNOT00000076818
|
Foxo3
|
forkhead box O3 |
| chr1_-_263762785 | 0.13 |
ENSRNOT00000018221
|
Cpn1
|
carboxypeptidase N subunit 1 |
| chr6_-_99273033 | 0.13 |
ENSRNOT00000088808
|
Tex21
|
testis expressed 21 |
| chr13_+_47440803 | 0.13 |
ENSRNOT00000030476
|
Yod1
|
YOD1 deubiquitinase |
| chr16_+_50152008 | 0.13 |
ENSRNOT00000019237
|
Klkb1
|
kallikrein B1 |
| chr1_-_250630677 | 0.13 |
ENSRNOT00000016688
|
Asah2
|
N-acylsphingosine amidohydrolase 2 |
| chr16_-_22647241 | 0.13 |
ENSRNOT00000087027
|
Ints10
|
integrator complex subunit 10 |
| chr2_+_95077577 | 0.12 |
ENSRNOT00000046368
|
Mrps28
|
mitochondrial ribosomal protein S28 |
| chr2_+_251805392 | 0.12 |
ENSRNOT00000019911
|
Bcl10
|
B-cell CLL/lymphoma 10 |
| chr16_-_79793619 | 0.12 |
ENSRNOT00000073971
|
Arhgef10
|
Rho guanine nucleotide exchange factor 10 |
| chr2_+_155718359 | 0.12 |
ENSRNOT00000077973
|
Kcnab1
|
potassium voltage-gated channel subfamily A member regulatory beta subunit 1 |
| chr10_+_86399827 | 0.12 |
ENSRNOT00000009299
|
Grb7
|
growth factor receptor bound protein 7 |
| chr8_-_133128290 | 0.12 |
ENSRNOT00000008783
|
Ccr1l1
|
chemokine (C-C motif) receptor 1-like 1 |
| chr1_+_247228061 | 0.12 |
ENSRNOT00000020809
|
Rcl1
|
RNA terminal phosphate cyclase-like 1 |
| chr17_+_12310214 | 0.12 |
ENSRNOT00000015786
|
Auh
|
AU RNA binding methylglutaconyl-CoA hydratase |
| chr9_-_65951516 | 0.12 |
ENSRNOT00000038132
|
Mpp4
|
membrane palmitoylated protein 4 |
| chr10_-_64202380 | 0.12 |
ENSRNOT00000008982
|
Rflnb
|
refilin B |
| chr7_-_141307233 | 0.12 |
ENSRNOT00000071885
|
Racgap1
|
Rac GTPase-activating protein 1 |
| chr6_+_29061618 | 0.12 |
ENSRNOT00000092223
|
Atad2b
|
ATPase family, AAA domain containing 2B |
| chr3_-_120233655 | 0.12 |
ENSRNOT00000020870
|
Mal
|
mal, T-cell differentiation protein |
| chr1_+_222311253 | 0.12 |
ENSRNOT00000028749
|
Macrod1
|
MACRO domain containing 1 |
| chr15_+_24159647 | 0.12 |
ENSRNOT00000082675
|
Lgals3
|
galectin 3 |
| chr1_-_221919210 | 0.12 |
ENSRNOT00000092580
ENSRNOT00000028665 |
Slc22a12
|
solute carrier family 22 member 12 |
| chr15_+_18941431 | 0.12 |
ENSRNOT00000092092
|
AABR07017236.1
|
|
| chr1_-_22748422 | 0.12 |
ENSRNOT00000021944
|
Slc18b1
|
solute carrier family 18 member B1 |
| chr1_+_168964202 | 0.12 |
ENSRNOT00000089102
|
LOC103694855
|
hemoglobin subunit beta-2-like |
| chr8_+_49354115 | 0.12 |
ENSRNOT00000032837
|
Mpzl3
|
myelin protein zero-like 3 |
| chr3_-_168018410 | 0.12 |
ENSRNOT00000087579
|
Bcas1
|
breast carcinoma amplified sequence 1 |
| chr9_+_42315682 | 0.12 |
ENSRNOT00000071995
|
AABR07067388.1
|
|
| chr4_+_83713666 | 0.12 |
ENSRNOT00000086473
|
Creb5
|
cAMP responsive element binding protein 5 |
| chr2_+_116416507 | 0.12 |
ENSRNOT00000030700
|
Actrt3
|
actin-related protein T3 |
| chr5_+_138154673 | 0.11 |
ENSRNOT00000064452
|
Slc2a1
|
solute carrier family 2 member 1 |
| chr9_-_97290639 | 0.11 |
ENSRNOT00000026491
ENSRNOT00000056724 |
Iqca1
|
IQ motif containing with AAA domain 1 |
| chr11_-_86328469 | 0.11 |
ENSRNOT00000071493
|
Ufd1l
|
ubiquitin fusion degradation 1 like (yeast) |
| chr1_+_125124743 | 0.11 |
ENSRNOT00000021530
|
Mtmr10
|
myotubularin related protein 10 |
| chr5_+_59008933 | 0.11 |
ENSRNOT00000023060
|
Car9
|
carbonic anhydrase 9 |
| chr11_-_34142753 | 0.11 |
ENSRNOT00000002297
|
Cldn14
|
claudin 14 |
| chr14_+_44889287 | 0.11 |
ENSRNOT00000091312
ENSRNOT00000032273 |
Tmem156
|
transmembrane protein 156 |
| chr12_+_44046217 | 0.11 |
ENSRNOT00000080853
ENSRNOT00000079510 |
Fbxw8
|
F-box and WD repeat domain containing 8 |
| chr5_-_166926636 | 0.11 |
ENSRNOT00000023287
|
Spsb1
|
splA/ryanodine receptor domain and SOCS box containing 1 |
| chr13_-_61070599 | 0.11 |
ENSRNOT00000005251
|
Rgs1
|
regulator of G-protein signaling 1 |
| chr2_-_1511591 | 0.11 |
ENSRNOT00000087906
ENSRNOT00000014709 |
Cast
|
calpastatin |
| chr13_-_98480419 | 0.11 |
ENSRNOT00000086306
|
Coq8a
|
coenzyme Q8A |
| chr9_+_51009116 | 0.11 |
ENSRNOT00000039313
|
Mettl21cl1
|
methyltransferase like 21C-like 1 |
| chr1_-_91588609 | 0.11 |
ENSRNOT00000050931
|
Snrpg
|
small nuclear ribonucleoprotein polypeptide G |
| chr6_-_27323992 | 0.11 |
ENSRNOT00000013198
|
RGD1559683
|
similar to RIKEN cDNA 1700001C02 |
| chr4_+_169161585 | 0.11 |
ENSRNOT00000079785
|
Emp1
|
epithelial membrane protein 1 |
| chr18_-_58097316 | 0.11 |
ENSRNOT00000088527
|
AABR07032265.1
|
|
| chr7_+_126756151 | 0.11 |
ENSRNOT00000022511
ENSRNOT00000065283 |
Trmu
|
tRNA 5-methylaminomethyl-2-thiouridylate methyltransferase |
| chr3_+_14467330 | 0.11 |
ENSRNOT00000078939
|
Gsn
|
gelsolin |
| chr1_-_252550394 | 0.11 |
ENSRNOT00000083468
|
Acta2
|
actin, alpha 2, smooth muscle, aorta |
| chr4_-_115239723 | 0.11 |
ENSRNOT00000042699
|
Actg2
|
actin, gamma 2, smooth muscle, enteric |
| chrX_-_111887906 | 0.11 |
ENSRNOT00000085118
|
Tsc22d3
|
TSC22 domain family, member 3 |
| chr9_+_9842585 | 0.11 |
ENSRNOT00000070806
|
Cd70
|
Cd70 molecule |
| chr14_-_79462080 | 0.11 |
ENSRNOT00000082180
|
Grpel1
|
GrpE-like 1, mitochondrial |
| chr2_+_110306363 | 0.11 |
ENSRNOT00000040463
|
LOC499584
|
LRRGT00202 |
| chr15_+_4091754 | 0.10 |
ENSRNOT00000083467
|
Usp54
|
ubiquitin specific peptidase 54 |
| chr10_-_15577977 | 0.10 |
ENSRNOT00000052292
|
Hba-a3
|
hemoglobin alpha, adult chain 3 |
| chr13_+_71107465 | 0.10 |
ENSRNOT00000003239
|
Rgs8
|
regulator of G-protein signaling 8 |
| chr4_-_183417667 | 0.10 |
ENSRNOT00000089160
|
Fam60a
|
family with sequence similarity 60, member A |
| chr9_-_43127887 | 0.10 |
ENSRNOT00000021685
|
Ankrd39
|
ankyrin repeat domain 39 |
| chr4_+_14001761 | 0.10 |
ENSRNOT00000076519
|
Cd36
|
CD36 molecule |
| chr7_+_72599479 | 0.10 |
ENSRNOT00000018963
|
AABR07057460.1
|
|
| chr4_+_41364441 | 0.10 |
ENSRNOT00000087146
|
Foxp2
|
forkhead box P2 |
| chr8_-_26345754 | 0.10 |
ENSRNOT00000091773
|
AC094212.1
|
triosephosphate isomerase |
| chr8_+_14060394 | 0.10 |
ENSRNOT00000014827
|
Smco4
|
single-pass membrane protein with coiled-coil domains 4 |
| chr6_+_123361864 | 0.10 |
ENSRNOT00000057577
|
AABR07065353.1
|
|
| chr13_-_97838228 | 0.10 |
ENSRNOT00000003618
|
Tfb2m
|
transcription factor B2, mitochondrial |
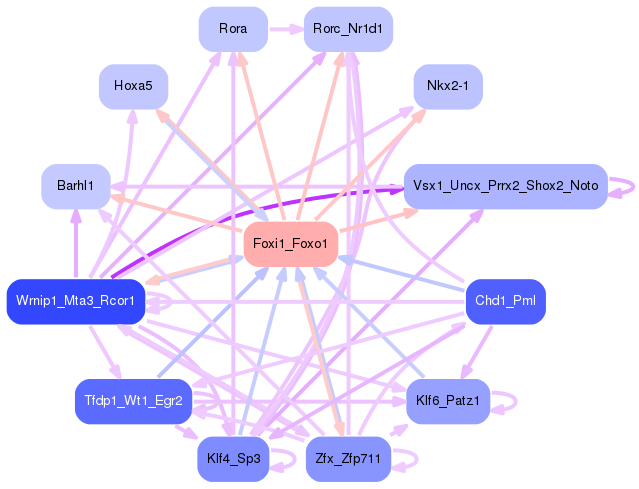
Network of associatons between targets according to the STRING database.

First level regulatory network of Foxi1_Foxo1
Gene Ontology Analysis
Gene overrepresentation in biological process category:
| Log-likelihood per target | Total log-likelihood | Term | Description |
|---|---|---|---|
| 0.2 | 2.0 | GO:0070327 | thyroid hormone transport(GO:0070327) |
| 0.2 | 0.9 | GO:0010037 | response to carbon dioxide(GO:0010037) |
| 0.2 | 0.8 | GO:0032227 | negative regulation of synaptic transmission, dopaminergic(GO:0032227) |
| 0.2 | 0.8 | GO:0046687 | response to chromate(GO:0046687) |
| 0.1 | 0.4 | GO:0060435 | bronchiole development(GO:0060435) |
| 0.1 | 0.4 | GO:0070447 | positive regulation of oligodendrocyte progenitor proliferation(GO:0070447) |
| 0.1 | 0.2 | GO:0071031 | nuclear mRNA surveillance of mRNA 3'-end processing(GO:0071031) nuclear polyadenylation-dependent tRNA catabolic process(GO:0071038) nuclear retention of pre-mRNA with aberrant 3'-ends at the site of transcription(GO:0071049) |
| 0.1 | 0.2 | GO:0002143 | tRNA wobble position uridine thiolation(GO:0002143) |
| 0.1 | 0.2 | GO:0031583 | phospholipase D-activating G-protein coupled receptor signaling pathway(GO:0031583) |
| 0.1 | 0.3 | GO:0090521 | glomerular visceral epithelial cell migration(GO:0090521) |
| 0.1 | 0.3 | GO:0050812 | regulation of acetyl-CoA biosynthetic process from pyruvate(GO:0010510) regulation of acyl-CoA biosynthetic process(GO:0050812) |
| 0.1 | 0.3 | GO:0090118 | receptor-mediated endocytosis of low-density lipoprotein particle involved in cholesterol transport(GO:0090118) |
| 0.1 | 0.3 | GO:0021797 | forebrain anterior/posterior pattern specification(GO:0021797) |
| 0.1 | 0.7 | GO:0015671 | oxygen transport(GO:0015671) |
| 0.1 | 0.2 | GO:0038128 | ERBB2 signaling pathway(GO:0038128) |
| 0.1 | 0.2 | GO:0019236 | response to pheromone(GO:0019236) |
| 0.1 | 0.3 | GO:0045329 | carnitine biosynthetic process(GO:0045329) |
| 0.1 | 0.4 | GO:0035726 | common myeloid progenitor cell proliferation(GO:0035726) |
| 0.1 | 0.2 | GO:0071387 | cellular response to cortisol stimulus(GO:0071387) |
| 0.0 | 0.3 | GO:0072615 | interleukin-17 secretion(GO:0072615) |
| 0.0 | 0.1 | GO:1904211 | membrane protein proteolysis involved in retrograde protein transport, ER to cytosol(GO:1904211) |
| 0.0 | 0.2 | GO:0014878 | response to electrical stimulus involved in regulation of muscle adaptation(GO:0014878) |
| 0.0 | 0.1 | GO:1990167 | protein K27-linked deubiquitination(GO:1990167) protein K33-linked deubiquitination(GO:1990168) |
| 0.0 | 0.2 | GO:0090131 | mesenchyme migration(GO:0090131) |
| 0.0 | 0.2 | GO:0051725 | protein de-ADP-ribosylation(GO:0051725) |
| 0.0 | 0.1 | GO:0061181 | regulation of chondrocyte development(GO:0061181) negative regulation of bone mineralization involved in bone maturation(GO:1900158) |
| 0.0 | 0.1 | GO:0000912 | assembly of actomyosin apparatus involved in cytokinesis(GO:0000912) actomyosin contractile ring assembly(GO:0000915) actomyosin contractile ring organization(GO:0044837) |
| 0.0 | 0.2 | GO:0007221 | positive regulation of transcription of Notch receptor target(GO:0007221) |
| 0.0 | 0.1 | GO:1903769 | negative regulation of cell proliferation in bone marrow(GO:1903769) |
| 0.0 | 0.2 | GO:0043987 | histone H3-S10 phosphorylation(GO:0043987) |
| 0.0 | 0.2 | GO:0021759 | globus pallidus development(GO:0021759) Clara cell differentiation(GO:0060486) |
| 0.0 | 0.2 | GO:0043553 | negative regulation of phosphatidylinositol 3-kinase activity(GO:0043553) |
| 0.0 | 0.1 | GO:1900756 | protein processing in phagocytic vesicle(GO:1900756) regulation of establishment of T cell polarity(GO:1903903) regulation of protein processing in phagocytic vesicle(GO:1903921) positive regulation of protein processing in phagocytic vesicle(GO:1903923) |
| 0.0 | 0.7 | GO:0003417 | growth plate cartilage development(GO:0003417) |
| 0.0 | 0.2 | GO:0045084 | positive regulation of interleukin-12 biosynthetic process(GO:0045084) |
| 0.0 | 0.1 | GO:0051692 | cellular oligosaccharide catabolic process(GO:0051692) |
| 0.0 | 0.2 | GO:0060574 | intestinal epithelial cell maturation(GO:0060574) |
| 0.0 | 0.1 | GO:0001966 | thigmotaxis(GO:0001966) epithelial cell differentiation involved in mammary gland alveolus development(GO:0061030) |
| 0.0 | 0.1 | GO:1904879 | positive regulation of calcium ion transmembrane transport via high voltage-gated calcium channel(GO:1904879) |
| 0.0 | 0.1 | GO:0001828 | inner cell mass cellular morphogenesis(GO:0001828) |
| 0.0 | 0.1 | GO:2000660 | negative regulation of interleukin-1-mediated signaling pathway(GO:2000660) |
| 0.0 | 0.2 | GO:0045416 | positive regulation of interleukin-8 biosynthetic process(GO:0045416) |
| 0.0 | 0.1 | GO:0071947 | protein deubiquitination involved in ubiquitin-dependent protein catabolic process(GO:0071947) |
| 0.0 | 0.2 | GO:0043249 | erythrocyte maturation(GO:0043249) |
| 0.0 | 0.1 | GO:0042196 | chlorinated hydrocarbon metabolic process(GO:0042196) halogenated hydrocarbon metabolic process(GO:0042197) |
| 0.0 | 0.1 | GO:1902219 | regulation of intrinsic apoptotic signaling pathway in response to osmotic stress(GO:1902218) negative regulation of intrinsic apoptotic signaling pathway in response to osmotic stress(GO:1902219) |
| 0.0 | 0.1 | GO:0030070 | insulin processing(GO:0030070) |
| 0.0 | 0.2 | GO:0051919 | positive regulation of fibrinolysis(GO:0051919) |
| 0.0 | 0.1 | GO:0061146 | Peyer's patch morphogenesis(GO:0061146) |
| 0.0 | 0.1 | GO:0010813 | neuropeptide catabolic process(GO:0010813) |
| 0.0 | 0.1 | GO:0035565 | regulation of pronephros size(GO:0035565) |
| 0.0 | 0.2 | GO:0097327 | response to antineoplastic agent(GO:0097327) |
| 0.0 | 0.2 | GO:0018298 | protein-chromophore linkage(GO:0018298) |
| 0.0 | 0.1 | GO:0032707 | negative regulation of interleukin-23 production(GO:0032707) |
| 0.0 | 0.1 | GO:0048880 | medulla oblongata development(GO:0021550) sensory system development(GO:0048880) |
| 0.0 | 0.2 | GO:1904646 | cellular response to beta-amyloid(GO:1904646) |
| 0.0 | 0.1 | GO:0034080 | CENP-A containing nucleosome assembly(GO:0034080) CENP-A containing chromatin organization(GO:0061641) |
| 0.0 | 0.1 | GO:0051790 | short-chain fatty acid biosynthetic process(GO:0051790) |
| 0.0 | 0.1 | GO:2000334 | blood microparticle formation(GO:0072564) regulation of blood microparticle formation(GO:2000332) positive regulation of blood microparticle formation(GO:2000334) |
| 0.0 | 0.1 | GO:0006663 | platelet activating factor biosynthetic process(GO:0006663) |
| 0.0 | 0.0 | GO:0002835 | negative regulation of response to tumor cell(GO:0002835) negative regulation of immune response to tumor cell(GO:0002838) negative regulation of natural killer cell mediated immune response to tumor cell(GO:0002856) negative regulation of natural killer cell mediated cytotoxicity directed against tumor cell target(GO:0002859) |
| 0.0 | 0.2 | GO:0000103 | sulfate assimilation(GO:0000103) |
| 0.0 | 0.2 | GO:0021778 | oligodendrocyte cell fate specification(GO:0021778) oligodendrocyte cell fate commitment(GO:0021779) glial cell fate specification(GO:0021780) |
| 0.0 | 0.2 | GO:0006269 | DNA replication, synthesis of RNA primer(GO:0006269) |
| 0.0 | 0.1 | GO:1903847 | regulation of aorta morphogenesis(GO:1903847) positive regulation of aorta morphogenesis(GO:1903849) |
| 0.0 | 0.2 | GO:2001269 | positive regulation of cysteine-type endopeptidase activity involved in apoptotic signaling pathway(GO:2001269) |
| 0.0 | 0.1 | GO:0060392 | negative regulation of SMAD protein import into nucleus(GO:0060392) |
| 0.0 | 0.2 | GO:0031914 | negative regulation of synaptic plasticity(GO:0031914) |
| 0.0 | 0.0 | GO:0090360 | platelet-derived growth factor production(GO:0090360) regulation of platelet-derived growth factor production(GO:0090361) |
| 0.0 | 0.3 | GO:0032525 | somite rostral/caudal axis specification(GO:0032525) |
| 0.0 | 0.1 | GO:0060005 | vestibular reflex(GO:0060005) |
| 0.0 | 0.1 | GO:0072144 | glomerular mesangial cell development(GO:0072144) |
| 0.0 | 0.1 | GO:0072369 | regulation of lipid transport by positive regulation of transcription from RNA polymerase II promoter(GO:0072369) |
| 0.0 | 0.1 | GO:0032919 | spermine acetylation(GO:0032919) |
| 0.0 | 0.1 | GO:0060266 | negative regulation of respiratory burst involved in inflammatory response(GO:0060266) |
| 0.0 | 0.1 | GO:0006710 | androgen catabolic process(GO:0006710) |
| 0.0 | 0.1 | GO:0002159 | desmosome assembly(GO:0002159) |
| 0.0 | 0.2 | GO:0032466 | negative regulation of cytokinesis(GO:0032466) |
| 0.0 | 0.1 | GO:0006116 | NADH oxidation(GO:0006116) |
| 0.0 | 0.2 | GO:0035542 | regulation of SNARE complex assembly(GO:0035542) |
| 0.0 | 0.1 | GO:0042908 | xenobiotic transport(GO:0042908) |
| 0.0 | 0.1 | GO:0061737 | leukotriene signaling pathway(GO:0061737) |
| 0.0 | 0.1 | GO:0052422 | modulation of catalytic activity in other organism involved in symbiotic interaction(GO:0052203) modulation by host of symbiont catalytic activity(GO:0052422) |
| 0.0 | 0.1 | GO:0002949 | tRNA threonylcarbamoyladenosine modification(GO:0002949) |
| 0.0 | 0.1 | GO:0038044 | transforming growth factor-beta secretion(GO:0038044) |
| 0.0 | 0.1 | GO:2000424 | regulation of eosinophil chemotaxis(GO:2000422) positive regulation of eosinophil chemotaxis(GO:2000424) |
| 0.0 | 0.0 | GO:0042998 | positive regulation of Golgi to plasma membrane protein transport(GO:0042998) |
| 0.0 | 0.1 | GO:0001766 | membrane raft polarization(GO:0001766) membrane raft distribution(GO:0031580) |
| 0.0 | 0.1 | GO:0075509 | receptor-mediated endocytosis of virus by host cell(GO:0019065) endocytosis involved in viral entry into host cell(GO:0075509) |
| 0.0 | 0.2 | GO:0032287 | peripheral nervous system myelin maintenance(GO:0032287) |
| 0.0 | 0.2 | GO:0000447 | endonucleolytic cleavage in ITS1 to separate SSU-rRNA from 5.8S rRNA and LSU-rRNA from tricistronic rRNA transcript (SSU-rRNA, 5.8S rRNA, LSU-rRNA)(GO:0000447) |
| 0.0 | 0.1 | GO:0048387 | negative regulation of retinoic acid receptor signaling pathway(GO:0048387) |
| 0.0 | 0.1 | GO:0014028 | notochord formation(GO:0014028) |
| 0.0 | 0.1 | GO:0035745 | T-helper 2 cell cytokine production(GO:0035745) |
| 0.0 | 0.0 | GO:2000458 | astrocyte chemotaxis(GO:0035700) regulation of astrocyte chemotaxis(GO:2000458) |
| 0.0 | 0.0 | GO:0014916 | regulation of lung blood pressure(GO:0014916) |
| 0.0 | 0.0 | GO:1902527 | positive regulation of protein monoubiquitination(GO:1902527) |
| 0.0 | 0.0 | GO:0002426 | immunoglobulin production in mucosal tissue(GO:0002426) |
| 0.0 | 0.1 | GO:2001270 | regulation of cysteine-type endopeptidase activity involved in execution phase of apoptosis(GO:2001270) |
| 0.0 | 0.0 | GO:2001034 | positive regulation of double-strand break repair via nonhomologous end joining(GO:2001034) |
| 0.0 | 0.3 | GO:0032291 | central nervous system myelination(GO:0022010) axon ensheathment in central nervous system(GO:0032291) |
| 0.0 | 0.2 | GO:0021702 | cerebellar Purkinje cell differentiation(GO:0021702) |
| 0.0 | 0.0 | GO:1904569 | regulation of selenocysteine incorporation(GO:1904569) |
| 0.0 | 0.0 | GO:0015766 | disaccharide transport(GO:0015766) sucrose transport(GO:0015770) oligosaccharide transport(GO:0015772) |
| 0.0 | 0.1 | GO:0071955 | recycling endosome to Golgi transport(GO:0071955) |
| 0.0 | 0.0 | GO:0090074 | negative regulation of protein homodimerization activity(GO:0090074) |
| 0.0 | 0.0 | GO:0006567 | threonine catabolic process(GO:0006567) |
| 0.0 | 0.1 | GO:0034244 | negative regulation of transcription elongation from RNA polymerase II promoter(GO:0034244) |
| 0.0 | 0.0 | GO:0001831 | trophectodermal cellular morphogenesis(GO:0001831) |
| 0.0 | 0.5 | GO:0006730 | one-carbon metabolic process(GO:0006730) |
| 0.0 | 0.0 | GO:0003220 | left ventricular cardiac muscle tissue morphogenesis(GO:0003220) |
| 0.0 | 0.2 | GO:0019511 | peptidyl-proline hydroxylation(GO:0019511) |
| 0.0 | 0.2 | GO:0030206 | chondroitin sulfate biosynthetic process(GO:0030206) |
| 0.0 | 0.1 | GO:0060501 | positive regulation of epithelial cell proliferation involved in lung morphogenesis(GO:0060501) |
| 0.0 | 0.1 | GO:1900113 | negative regulation of histone H3-K9 trimethylation(GO:1900113) |
| 0.0 | 0.1 | GO:0014891 | striated muscle atrophy(GO:0014891) |
| 0.0 | 0.0 | GO:0038108 | negative regulation of appetite by leptin-mediated signaling pathway(GO:0038108) |
| 0.0 | 0.1 | GO:0044793 | negative regulation by host of viral process(GO:0044793) negative regulation by host of viral genome replication(GO:0044828) |
| 0.0 | 0.1 | GO:0006104 | succinyl-CoA metabolic process(GO:0006104) |
| 0.0 | 0.1 | GO:0051542 | elastin biosynthetic process(GO:0051542) |
| 0.0 | 0.0 | GO:0035290 | trunk segmentation(GO:0035290) trunk neural crest cell migration(GO:0036484) ventral trunk neural crest cell migration(GO:0036486) sympathetic neuron projection extension(GO:0097490) sympathetic neuron projection guidance(GO:0097491) |
| 0.0 | 0.2 | GO:1900017 | positive regulation of cytokine production involved in inflammatory response(GO:1900017) |
| 0.0 | 0.2 | GO:1902260 | negative regulation of delayed rectifier potassium channel activity(GO:1902260) negative regulation of voltage-gated potassium channel activity(GO:1903817) |
| 0.0 | 0.1 | GO:0001582 | detection of chemical stimulus involved in sensory perception of sweet taste(GO:0001582) |
| 0.0 | 0.0 | GO:0051541 | elastin metabolic process(GO:0051541) |
| 0.0 | 0.1 | GO:0035610 | protein side chain deglutamylation(GO:0035610) |
| 0.0 | 0.1 | GO:0014055 | acetylcholine secretion, neurotransmission(GO:0014055) regulation of acetylcholine secretion, neurotransmission(GO:0014056) |
| 0.0 | 0.0 | GO:0090247 | cell motility involved in somitogenic axis elongation(GO:0090247) regulation of cell motility involved in somitogenic axis elongation(GO:0090249) |
| 0.0 | 0.2 | GO:0046501 | protoporphyrinogen IX metabolic process(GO:0046501) |
| 0.0 | 0.0 | GO:0051343 | positive regulation of cyclic-nucleotide phosphodiesterase activity(GO:0051343) |
| 0.0 | 0.1 | GO:0015747 | urate transport(GO:0015747) |
| 0.0 | 0.1 | GO:0030820 | regulation of cyclic nucleotide catabolic process(GO:0030805) regulation of cAMP catabolic process(GO:0030820) |
| 0.0 | 0.0 | GO:0046601 | positive regulation of centriole replication(GO:0046601) |
| 0.0 | 0.1 | GO:0090234 | regulation of kinetochore assembly(GO:0090234) |
| 0.0 | 0.1 | GO:2000973 | regulation of pro-B cell differentiation(GO:2000973) |
| 0.0 | 0.0 | GO:0032978 | protein insertion into membrane from inner side(GO:0032978) |
| 0.0 | 0.0 | GO:0006788 | heme oxidation(GO:0006788) |
| 0.0 | 0.0 | GO:1905244 | regulation of modification of synaptic structure(GO:1905244) |
| 0.0 | 0.2 | GO:0046884 | follicle-stimulating hormone secretion(GO:0046884) |
| 0.0 | 0.1 | GO:0008228 | opsonization(GO:0008228) |
| 0.0 | 0.1 | GO:0007343 | egg activation(GO:0007343) |
| 0.0 | 0.1 | GO:0010912 | regulation of isomerase activity(GO:0010911) positive regulation of isomerase activity(GO:0010912) regulation of DNA topoisomerase (ATP-hydrolyzing) activity(GO:2000371) positive regulation of DNA topoisomerase (ATP-hydrolyzing) activity(GO:2000373) |
| 0.0 | 0.0 | GO:0034085 | establishment of sister chromatid cohesion(GO:0034085) cohesin loading(GO:0071921) regulation of cohesin loading(GO:0071922) |
| 0.0 | 0.0 | GO:1904732 | regulation of electron carrier activity(GO:1904732) |
| 0.0 | 0.1 | GO:0035511 | oxidative DNA demethylation(GO:0035511) |
| 0.0 | 0.1 | GO:1903800 | positive regulation of production of miRNAs involved in gene silencing by miRNA(GO:1903800) |
| 0.0 | 0.1 | GO:0034063 | stress granule assembly(GO:0034063) |
| 0.0 | 0.4 | GO:0042462 | eye photoreceptor cell development(GO:0042462) |
| 0.0 | 0.0 | GO:0016598 | protein arginylation(GO:0016598) |
| 0.0 | 0.1 | GO:0021979 | hypothalamus cell differentiation(GO:0021979) |
| 0.0 | 0.2 | GO:0030150 | protein import into mitochondrial matrix(GO:0030150) |
| 0.0 | 0.0 | GO:0009992 | cellular water homeostasis(GO:0009992) |
| 0.0 | 0.0 | GO:0034443 | plasma lipoprotein particle oxidation(GO:0034441) regulation of lipoprotein oxidation(GO:0034442) negative regulation of lipoprotein oxidation(GO:0034443) |
| 0.0 | 0.1 | GO:0070836 | caveola assembly(GO:0070836) regulation of membrane depolarization during cardiac muscle cell action potential(GO:1900825) |
| 0.0 | 0.0 | GO:0061144 | alveolar secondary septum development(GO:0061144) |
| 0.0 | 0.1 | GO:0016338 | calcium-independent cell-cell adhesion via plasma membrane cell-adhesion molecules(GO:0016338) |
| 0.0 | 0.0 | GO:0071492 | cellular response to UV-A(GO:0071492) |
| 0.0 | 0.1 | GO:0021684 | cerebellar granular layer formation(GO:0021684) cerebellar granule cell differentiation(GO:0021707) |
| 0.0 | 0.1 | GO:0060681 | branch elongation involved in ureteric bud branching(GO:0060681) |
| 0.0 | 0.0 | GO:0060267 | positive regulation of respiratory burst(GO:0060267) |
| 0.0 | 0.1 | GO:0008065 | establishment of blood-nerve barrier(GO:0008065) |
| 0.0 | 0.1 | GO:0048143 | astrocyte activation(GO:0048143) |
| 0.0 | 0.2 | GO:0022011 | myelination in peripheral nervous system(GO:0022011) peripheral nervous system axon ensheathment(GO:0032292) |
| 0.0 | 0.1 | GO:0046602 | regulation of mitotic centrosome separation(GO:0046602) |
| 0.0 | 0.1 | GO:0002457 | T cell antigen processing and presentation(GO:0002457) |
| 0.0 | 0.0 | GO:0097089 | methyl-branched fatty acid metabolic process(GO:0097089) |
| 0.0 | 0.1 | GO:0090116 | C-5 methylation of cytosine(GO:0090116) |
| 0.0 | 0.0 | GO:1901844 | regulation of cell communication by electrical coupling involved in cardiac conduction(GO:1901844) calcium ion import into sarcoplasmic reticulum(GO:1990036) |
| 0.0 | 0.1 | GO:0002430 | complement receptor mediated signaling pathway(GO:0002430) |
| 0.0 | 0.0 | GO:0002386 | immune response in mucosal-associated lymphoid tissue(GO:0002386) |
| 0.0 | 0.2 | GO:0042347 | negative regulation of NF-kappaB import into nucleus(GO:0042347) |
| 0.0 | 0.1 | GO:0001992 | regulation of systemic arterial blood pressure by vasopressin(GO:0001992) |
Gene overrepresentation in cellular component category:
| Log-likelihood per target | Total log-likelihood | Term | Description |
|---|---|---|---|
| 0.1 | 0.7 | GO:0005833 | hemoglobin complex(GO:0005833) |
| 0.1 | 0.3 | GO:0030121 | AP-1 adaptor complex(GO:0030121) |
| 0.1 | 0.2 | GO:0070557 | PCNA-p21 complex(GO:0070557) |
| 0.1 | 0.3 | GO:0033269 | internode region of axon(GO:0033269) |
| 0.0 | 0.2 | GO:0043293 | apoptosome(GO:0043293) |
| 0.0 | 0.4 | GO:0005826 | actomyosin contractile ring(GO:0005826) |
| 0.0 | 0.2 | GO:0033093 | Weibel-Palade body(GO:0033093) |
| 0.0 | 0.3 | GO:0097197 | tetraspanin-enriched microdomain(GO:0097197) |
| 0.0 | 0.3 | GO:0044305 | calyx of Held(GO:0044305) |
| 0.0 | 0.2 | GO:0030478 | actin cap(GO:0030478) |
| 0.0 | 0.2 | GO:1990393 | Cul7-RING ubiquitin ligase complex(GO:0031467) 3M complex(GO:1990393) |
| 0.0 | 0.1 | GO:0002947 | tumor necrosis factor receptor superfamily complex(GO:0002947) |
| 0.0 | 0.1 | GO:0001405 | presequence translocase-associated import motor(GO:0001405) |
| 0.0 | 0.1 | GO:0071664 | catenin-TCF7L2 complex(GO:0071664) |
| 0.0 | 0.1 | GO:0009331 | glycerol-3-phosphate dehydrogenase complex(GO:0009331) |
| 0.0 | 0.1 | GO:0005607 | laminin-2 complex(GO:0005607) |
| 0.0 | 0.1 | GO:1990712 | HFE-transferrin receptor complex(GO:1990712) |
| 0.0 | 0.1 | GO:0031092 | platelet alpha granule membrane(GO:0031092) |
| 0.0 | 0.2 | GO:0000176 | nuclear exosome (RNase complex)(GO:0000176) |
| 0.0 | 0.2 | GO:0005658 | alpha DNA polymerase:primase complex(GO:0005658) |
| 0.0 | 0.1 | GO:0030485 | smooth muscle contractile fiber(GO:0030485) |
| 0.0 | 0.1 | GO:0044322 | endoplasmic reticulum quality control compartment(GO:0044322) |
| 0.0 | 0.1 | GO:0072558 | NLRP1 inflammasome complex(GO:0072558) |
| 0.0 | 0.2 | GO:0001939 | female pronucleus(GO:0001939) |
| 0.0 | 0.1 | GO:0031466 | Cul5-RING ubiquitin ligase complex(GO:0031466) |
| 0.0 | 0.1 | GO:0005672 | transcription factor TFIIA complex(GO:0005672) |
| 0.0 | 0.1 | GO:0005683 | U7 snRNP(GO:0005683) |
| 0.0 | 0.0 | GO:0097629 | extrinsic component of omegasome membrane(GO:0097629) |
| 0.0 | 0.0 | GO:0005967 | mitochondrial pyruvate dehydrogenase complex(GO:0005967) |
| 0.0 | 0.0 | GO:0005899 | insulin receptor complex(GO:0005899) |
| 0.0 | 0.1 | GO:1903768 | sweet taste receptor complex(GO:1903767) taste receptor complex(GO:1903768) |
| 0.0 | 0.1 | GO:0046696 | lipopolysaccharide receptor complex(GO:0046696) |
| 0.0 | 0.1 | GO:0000408 | EKC/KEOPS complex(GO:0000408) |
| 0.0 | 0.1 | GO:0036128 | CatSper complex(GO:0036128) |
| 0.0 | 0.1 | GO:0032777 | Piccolo NuA4 histone acetyltransferase complex(GO:0032777) |
| 0.0 | 0.1 | GO:0034366 | spherical high-density lipoprotein particle(GO:0034366) |
| 0.0 | 0.1 | GO:0005744 | mitochondrial inner membrane presequence translocase complex(GO:0005744) |
| 0.0 | 0.1 | GO:0005927 | muscle tendon junction(GO:0005927) |
| 0.0 | 0.1 | GO:0071141 | SMAD protein complex(GO:0071141) |
| 0.0 | 0.2 | GO:0016580 | Sin3 complex(GO:0016580) |
| 0.0 | 0.1 | GO:0043205 | microfibril(GO:0001527) fibril(GO:0043205) |
| 0.0 | 0.0 | GO:0032044 | DSIF complex(GO:0032044) |
| 0.0 | 0.1 | GO:0071547 | piP-body(GO:0071547) |
| 0.0 | 0.1 | GO:0005879 | axonemal microtubule(GO:0005879) |
| 0.0 | 0.1 | GO:1990635 | proximal dendrite(GO:1990635) |
| 0.0 | 0.0 | GO:0097513 | myosin II filament(GO:0097513) |
Gene overrepresentation in molecular function category:
| Log-likelihood per target | Total log-likelihood | Term | Description |
|---|---|---|---|
| 0.2 | 0.5 | GO:0008142 | oxysterol binding(GO:0008142) |
| 0.2 | 0.9 | GO:0043120 | tumor necrosis factor binding(GO:0043120) |
| 0.2 | 0.8 | GO:0005499 | vitamin D binding(GO:0005499) |
| 0.1 | 1.6 | GO:0070324 | thyroid hormone binding(GO:0070324) |
| 0.1 | 0.4 | GO:0019807 | aspartoacylase activity(GO:0019807) |
| 0.1 | 0.3 | GO:0008241 | peptidyl-dipeptidase activity(GO:0008241) |
| 0.1 | 0.2 | GO:0031708 | endothelin B receptor binding(GO:0031708) |
| 0.1 | 0.3 | GO:0004740 | pyruvate dehydrogenase (acetyl-transferring) kinase activity(GO:0004740) |
| 0.1 | 0.2 | GO:0004809 | tRNA (guanine-N2-)-methyltransferase activity(GO:0004809) |
| 0.1 | 0.7 | GO:0005344 | oxygen transporter activity(GO:0005344) |
| 0.1 | 0.2 | GO:0019912 | cyclin-dependent protein kinase activating kinase activity(GO:0019912) |
| 0.1 | 0.2 | GO:0004165 | dodecenoyl-CoA delta-isomerase activity(GO:0004165) |
| 0.1 | 0.7 | GO:0004089 | carbonate dehydratase activity(GO:0004089) |
| 0.1 | 0.2 | GO:0052794 | exo-alpha-(2->3)-sialidase activity(GO:0052794) exo-alpha-(2->6)-sialidase activity(GO:0052795) exo-alpha-(2->8)-sialidase activity(GO:0052796) |
| 0.0 | 0.3 | GO:0015349 | thyroid hormone transmembrane transporter activity(GO:0015349) |
| 0.0 | 0.1 | GO:0047522 | 15-oxoprostaglandin 13-oxidase activity(GO:0047522) |
| 0.0 | 0.4 | GO:0098748 | clathrin adaptor activity(GO:0035615) endocytic adaptor activity(GO:0098748) |
| 0.0 | 0.1 | GO:0000179 | rRNA (adenine-N6,N6-)-dimethyltransferase activity(GO:0000179) |
| 0.0 | 0.1 | GO:0004368 | glycerol-3-phosphate dehydrogenase activity(GO:0004368) |
| 0.0 | 0.2 | GO:0005111 | type 2 fibroblast growth factor receptor binding(GO:0005111) |
| 0.0 | 0.1 | GO:0004062 | aryl sulfotransferase activity(GO:0004062) |
| 0.0 | 0.1 | GO:0019809 | spermidine binding(GO:0019809) |
| 0.0 | 0.2 | GO:0001517 | N-acetylglucosamine 6-O-sulfotransferase activity(GO:0001517) |
| 0.0 | 0.2 | GO:0009881 | photoreceptor activity(GO:0009881) |
| 0.0 | 0.6 | GO:0015106 | bicarbonate transmembrane transporter activity(GO:0015106) |
| 0.0 | 0.2 | GO:0016634 | oxidoreductase activity, acting on the CH-CH group of donors, oxygen as acceptor(GO:0016634) |
| 0.0 | 0.2 | GO:0005113 | patched binding(GO:0005113) |
| 0.0 | 0.1 | GO:0070653 | high-density lipoprotein particle receptor binding(GO:0070653) |
| 0.0 | 0.1 | GO:0045159 | myosin II binding(GO:0045159) |
| 0.0 | 0.1 | GO:0052724 | inositol hexakisphosphate 1-kinase activity(GO:0052723) inositol hexakisphosphate 3-kinase activity(GO:0052724) |
| 0.0 | 0.2 | GO:0043199 | sulfate binding(GO:0043199) |
| 0.0 | 0.2 | GO:0019992 | diacylglycerol binding(GO:0019992) |
| 0.0 | 0.2 | GO:0003896 | DNA primase activity(GO:0003896) |
| 0.0 | 0.2 | GO:0017040 | ceramidase activity(GO:0017040) |
| 0.0 | 0.1 | GO:0033149 | FFAT motif binding(GO:0033149) |
| 0.0 | 0.1 | GO:0031493 | nucleosomal histone binding(GO:0031493) |
| 0.0 | 0.1 | GO:0019863 | IgE binding(GO:0019863) |
| 0.0 | 0.1 | GO:0008732 | threonine aldolase activity(GO:0004793) L-allo-threonine aldolase activity(GO:0008732) |
| 0.0 | 0.1 | GO:0070892 | lipoteichoic acid receptor activity(GO:0070892) |
| 0.0 | 0.2 | GO:0016783 | sulfurtransferase activity(GO:0016783) |
| 0.0 | 0.1 | GO:0004300 | enoyl-CoA hydratase activity(GO:0004300) |
| 0.0 | 0.1 | GO:0003987 | acetate-CoA ligase activity(GO:0003987) |
| 0.0 | 0.0 | GO:0050294 | steroid sulfotransferase activity(GO:0050294) |
| 0.0 | 0.0 | GO:0070905 | serine binding(GO:0070905) |
| 0.0 | 0.1 | GO:0004774 | succinate-CoA ligase activity(GO:0004774) succinate-CoA ligase (ADP-forming) activity(GO:0004775) |
| 0.0 | 0.1 | GO:0043426 | MRF binding(GO:0043426) |
| 0.0 | 0.2 | GO:0044213 | intronic transcription regulatory region sequence-specific DNA binding(GO:0001161) intronic transcription regulatory region DNA binding(GO:0044213) |
| 0.0 | 0.1 | GO:1990459 | transferrin receptor binding(GO:1990459) |
| 0.0 | 0.4 | GO:0004181 | metallocarboxypeptidase activity(GO:0004181) |
| 0.0 | 0.0 | GO:0008311 | double-stranded DNA 3'-5' exodeoxyribonuclease activity(GO:0008311) |
| 0.0 | 0.2 | GO:0015143 | urate transmembrane transporter activity(GO:0015143) salt transmembrane transporter activity(GO:1901702) |
| 0.0 | 0.1 | GO:0004111 | creatine kinase activity(GO:0004111) |
| 0.0 | 0.2 | GO:0016493 | C-C chemokine receptor activity(GO:0016493) |
| 0.0 | 0.1 | GO:0043423 | 3-phosphoinositide-dependent protein kinase binding(GO:0043423) |
| 0.0 | 0.3 | GO:0016503 | pheromone receptor activity(GO:0016503) |
| 0.0 | 0.1 | GO:0030274 | LIM domain binding(GO:0030274) |
| 0.0 | 0.1 | GO:1990446 | U1 snRNP binding(GO:1990446) |
| 0.0 | 0.0 | GO:0015157 | sucrose:proton symporter activity(GO:0008506) sucrose transmembrane transporter activity(GO:0008515) disaccharide transmembrane transporter activity(GO:0015154) oligosaccharide transmembrane transporter activity(GO:0015157) |
| 0.0 | 0.1 | GO:0005134 | interleukin-2 receptor binding(GO:0005134) |
| 0.0 | 0.1 | GO:0008527 | taste receptor activity(GO:0008527) |
| 0.0 | 0.1 | GO:0035514 | DNA demethylase activity(GO:0035514) |
| 0.0 | 0.0 | GO:0031208 | POZ domain binding(GO:0031208) |
| 0.0 | 0.1 | GO:0005005 | transmembrane-ephrin receptor activity(GO:0005005) |
| 0.0 | 0.0 | GO:0004982 | N-formyl peptide receptor activity(GO:0004982) |
| 0.0 | 0.0 | GO:0099510 | N-terminal myristoylation domain binding(GO:0031997) calcium ion binding involved in regulation of cytosolic calcium ion concentration(GO:0099510) calcium ion binding involved in regulation of postsynaptic cytosolic calcium ion concentration(GO:0099567) |
| 0.0 | 0.5 | GO:0071855 | neuropeptide receptor binding(GO:0071855) |
| 0.0 | 0.0 | GO:0002114 | interleukin-33 receptor activity(GO:0002114) |
| 0.0 | 0.1 | GO:0055056 | D-glucose transmembrane transporter activity(GO:0055056) |
| 0.0 | 0.0 | GO:0008158 | hedgehog receptor activity(GO:0008158) |
| 0.0 | 0.0 | GO:0004392 | heme oxygenase (decyclizing) activity(GO:0004392) |
| 0.0 | 0.1 | GO:0004887 | thyroid hormone receptor activity(GO:0004887) |
| 0.0 | 0.1 | GO:0019966 | interleukin-1 binding(GO:0019966) |
| 0.0 | 0.1 | GO:0051022 | Rho GDP-dissociation inhibitor binding(GO:0051022) |
| 0.0 | 0.1 | GO:1990715 | mRNA CDS binding(GO:1990715) |
| 0.0 | 0.2 | GO:0044548 | S100 protein binding(GO:0044548) |
| 0.0 | 0.0 | GO:0005006 | epidermal growth factor-activated receptor activity(GO:0005006) |
| 0.0 | 0.1 | GO:1990380 | Lys48-specific deubiquitinase activity(GO:1990380) |
| 0.0 | 0.0 | GO:0030060 | L-malate dehydrogenase activity(GO:0030060) |
| 0.0 | 0.0 | GO:0004605 | phosphatidate cytidylyltransferase activity(GO:0004605) |
| 0.0 | 0.1 | GO:0019911 | structural constituent of myelin sheath(GO:0019911) |
| 0.0 | 0.1 | GO:0000774 | adenyl-nucleotide exchange factor activity(GO:0000774) |
| 0.0 | 0.1 | GO:0033142 | progesterone receptor binding(GO:0033142) |
Gene overrepresentation in curated gene sets: canonical pathways category:
| Log-likelihood per target | Total log-likelihood | Term | Description |
|---|---|---|---|
| 0.0 | 1.7 | PID HNF3B PATHWAY | FOXA2 and FOXA3 transcription factor networks |
| 0.0 | 0.2 | SA G2 AND M PHASES | Cdc25 activates the cdc2/cyclin B complex to induce the G2/M transition. |
| 0.0 | 1.2 | PID HIF1 TFPATHWAY | HIF-1-alpha transcription factor network |
| 0.0 | 0.1 | ST G ALPHA I PATHWAY | G alpha i Pathway |
| 0.0 | 0.0 | SIG PIP3 SIGNALING IN B LYMPHOCYTES | Genes related to PIP3 signaling in B lymphocytes |
| 0.0 | 0.0 | PID FAS PATHWAY | FAS (CD95) signaling pathway |
Gene overrepresentation in curated gene sets: REACTOME pathways category:
| Log-likelihood per target | Total log-likelihood | Term | Description |
|---|---|---|---|
| 0.1 | 1.9 | REACTOME AMYLOIDS | Genes involved in Amyloids |
| 0.0 | 0.0 | REACTOME INSULIN RECEPTOR RECYCLING | Genes involved in Insulin receptor recycling |
| 0.0 | 0.1 | REACTOME ENDOSOMAL VACUOLAR PATHWAY | Genes involved in Endosomal/Vacuolar pathway |
| 0.0 | 0.3 | REACTOME RECYCLING OF BILE ACIDS AND SALTS | Genes involved in Recycling of bile acids and salts |
| 0.0 | 0.2 | REACTOME OPSINS | Genes involved in Opsins |
| 0.0 | 0.2 | REACTOME GLYCOPROTEIN HORMONES | Genes involved in Glycoprotein hormones |
| 0.0 | 0.3 | REACTOME NOTCH HLH TRANSCRIPTION PATHWAY | Genes involved in Notch-HLH transcription pathway |
| 0.0 | 0.5 | REACTOME INTRINSIC PATHWAY | Genes involved in Intrinsic Pathway |
| 0.0 | 0.4 | REACTOME CHYLOMICRON MEDIATED LIPID TRANSPORT | Genes involved in Chylomicron-mediated lipid transport |
| 0.0 | 0.0 | REACTOME DOWNSTREAM SIGNALING EVENTS OF B CELL RECEPTOR BCR | Genes involved in Downstream Signaling Events Of B Cell Receptor (BCR) |
| 0.0 | 0.2 | REACTOME MRNA DECAY BY 3 TO 5 EXORIBONUCLEASE | Genes involved in mRNA Decay by 3' to 5' Exoribonuclease |
| 0.0 | 0.3 | REACTOME REGULATION OF PYRUVATE DEHYDROGENASE PDH COMPLEX | Genes involved in Regulation of pyruvate dehydrogenase (PDH) complex |
| 0.0 | 0.5 | REACTOME TIGHT JUNCTION INTERACTIONS | Genes involved in Tight junction interactions |
| 0.0 | 0.3 | REACTOME METABOLISM OF PORPHYRINS | Genes involved in Metabolism of porphyrins |
| 0.0 | 0.3 | REACTOME PROCESSIVE SYNTHESIS ON THE LAGGING STRAND | Genes involved in Processive synthesis on the lagging strand |
| 0.0 | 0.1 | REACTOME OLFACTORY SIGNALING PATHWAY | Genes involved in Olfactory Signaling Pathway |
| 0.0 | 0.3 | REACTOME SMOOTH MUSCLE CONTRACTION | Genes involved in Smooth Muscle Contraction |
| 0.0 | 0.1 | REACTOME ACYL CHAIN REMODELLING OF PI | Genes involved in Acyl chain remodelling of PI |
| 0.0 | 0.2 | REACTOME FGFR1 LIGAND BINDING AND ACTIVATION | Genes involved in FGFR1 ligand binding and activation |
| 0.0 | 0.4 | REACTOME GLYCOSPHINGOLIPID METABOLISM | Genes involved in Glycosphingolipid metabolism |