Project
GSE49485: Hypoxia transcriptome sequencing of rat brain.
Navigation
Downloads
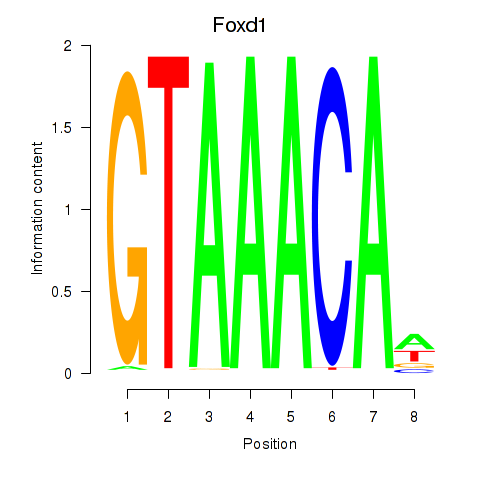
Results for Foxd1
Z-value: 0.37
Motif logo
Transcription factors associated with Foxd1
| Gene Symbol | Gene ID | Gene Info |
|---|---|---|
|
Foxd1
|
ENSRNOG00000043332 | forkhead box D1 |
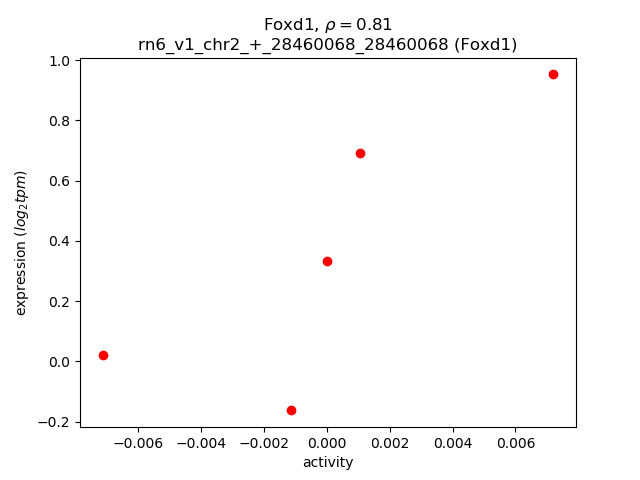
Activity-expression correlation:
| Gene | Promoter | Pearson corr. coef. | P-value | Plot |
|---|---|---|---|---|
| Foxd1 | rn6_v1_chr2_+_28460068_28460068 | 0.81 | 9.9e-02 | Click! |
Activity profile of Foxd1 motif
Sorted Z-values of Foxd1 motif
| Promoter | Log-likelihood | Transcript | Gene | Gene Info |
|---|---|---|---|---|
| chr18_+_27558089 | 0.23 |
ENSRNOT00000027499
|
Fam53c
|
family with sequence similarity 53, member C |
| chr10_-_74298599 | 0.21 |
ENSRNOT00000007379
|
Ypel2
|
yippee-like 2 |
| chr1_+_261337594 | 0.17 |
ENSRNOT00000019874
|
Pi4k2a
|
phosphatidylinositol 4-kinase type 2 alpha |
| chr13_+_90533365 | 0.17 |
ENSRNOT00000082469
|
Dcaf8
|
DDB1 and CUL4 associated factor 8 |
| chr13_+_97838361 | 0.16 |
ENSRNOT00000003641
|
Cnst
|
consortin, connexin sorting protein |
| chr8_-_104593625 | 0.15 |
ENSRNOT00000016625
|
Zbtb38
|
zinc finger and BTB domain containing 38 |
| chr3_-_148932878 | 0.15 |
ENSRNOT00000013881
|
Nol4l
|
nucleolar protein 4-like |
| chr2_-_208225888 | 0.15 |
ENSRNOT00000054860
|
AABR07012775.1
|
|
| chr4_-_115516296 | 0.14 |
ENSRNOT00000019399
|
Paip2b
|
poly(A) binding protein interacting protein 2B |
| chr20_+_5262946 | 0.14 |
ENSRNOT00000082900
|
Brd2
|
bromodomain containing 2 |
| chr8_-_80631873 | 0.13 |
ENSRNOT00000091661
ENSRNOT00000080662 |
Unc13c
|
unc-13 homolog C |
| chr3_-_60795951 | 0.12 |
ENSRNOT00000002174
|
Atf2
|
activating transcription factor 2 |
| chr5_-_60559533 | 0.11 |
ENSRNOT00000092899
|
Zbtb5
|
zinc finger and BTB domain containing 5 |
| chr6_+_73553210 | 0.11 |
ENSRNOT00000006562
|
Akap6
|
A-kinase anchoring protein 6 |
| chr10_+_89646195 | 0.11 |
ENSRNOT00000048140
|
Dhx8
|
DEAH-box helicase 8 |
| chr17_+_81922329 | 0.11 |
ENSRNOT00000031542
|
Cacnb2
|
calcium voltage-gated channel auxiliary subunit beta 2 |
| chr4_+_157438605 | 0.10 |
ENSRNOT00000079988
|
AC115420.4
|
|
| chr8_-_118696187 | 0.10 |
ENSRNOT00000056141
|
Klhl18
|
kelch-like family member 18 |
| chr10_-_109267500 | 0.09 |
ENSRNOT00000005977
|
Cep131
|
centrosomal protein 131 |
| chr4_-_30556814 | 0.09 |
ENSRNOT00000012760
|
Pdk4
|
pyruvate dehydrogenase kinase 4 |
| chrX_+_71155601 | 0.09 |
ENSRNOT00000076453
ENSRNOT00000048521 |
Foxo4
|
forkhead box O4 |
| chr7_-_120780108 | 0.09 |
ENSRNOT00000018185
|
Ddx17
|
DEAD-box helicase 17 |
| chr4_+_168599331 | 0.09 |
ENSRNOT00000086719
|
Crebl2
|
cAMP responsive element binding protein-like 2 |
| chr15_+_34552410 | 0.09 |
ENSRNOT00000027802
|
Khnyn
|
KH and NYN domain containing |
| chr14_-_3351553 | 0.09 |
ENSRNOT00000061556
|
Btbd8
|
BTB (POZ) domain containing 8 |
| chr10_+_103395511 | 0.09 |
ENSRNOT00000004256
|
Gprc5c
|
G protein-coupled receptor, class C, group 5, member C |
| chr12_+_21767606 | 0.09 |
ENSRNOT00000059602
|
LOC103691013
|
neuronal tyrosine-phosphorylated phosphoinositide-3-kinase adapter 1-like |
| chr2_+_205553163 | 0.08 |
ENSRNOT00000039572
|
Nras
|
neuroblastoma RAS viral oncogene homolog |
| chr7_-_120780641 | 0.08 |
ENSRNOT00000076164
|
Ddx17
|
DEAD-box helicase 17 |
| chr9_+_119542328 | 0.08 |
ENSRNOT00000082005
|
Lpin2
|
lipin 2 |
| chr9_-_38196273 | 0.08 |
ENSRNOT00000044452
|
Dst
|
dystonin |
| chr8_+_77107536 | 0.08 |
ENSRNOT00000083255
|
Adam10
|
ADAM metallopeptidase domain 10 |
| chr7_-_114590119 | 0.08 |
ENSRNOT00000079599
|
Ptk2
|
protein tyrosine kinase 2 |
| chr10_+_94988362 | 0.08 |
ENSRNOT00000066525
|
Cep95
|
centrosomal protein 95 |
| chr15_-_37983882 | 0.08 |
ENSRNOT00000087978
|
Lats2
|
large tumor suppressor kinase 2 |
| chrX_+_115563038 | 0.08 |
ENSRNOT00000087859
|
Alg13
|
ALG13, UDP-N-acetylglucosaminyltransferase subunit |
| chr15_-_77736892 | 0.07 |
ENSRNOT00000057924
|
Pcdh9
|
protocadherin 9 |
| chr16_-_19583386 | 0.07 |
ENSRNOT00000090131
|
Zfp617
|
zinc finger protein 617 |
| chr5_-_60559329 | 0.07 |
ENSRNOT00000017046
|
Zbtb5
|
zinc finger and BTB domain containing 5 |
| chr10_-_90501819 | 0.07 |
ENSRNOT00000050474
|
Gpatch8
|
G patch domain containing 8 |
| chr4_-_67520356 | 0.07 |
ENSRNOT00000014604
|
Braf
|
B-Raf proto-oncogene, serine/threonine kinase |
| chr17_-_9721542 | 0.07 |
ENSRNOT00000047958
ENSRNOT00000079063 |
Grk6
|
G protein-coupled receptor kinase 6 |
| chr4_+_157594436 | 0.07 |
ENSRNOT00000029053
|
Lpar5
|
lysophosphatidic acid receptor 5 |
| chr13_-_98480419 | 0.07 |
ENSRNOT00000086306
|
Coq8a
|
coenzyme Q8A |
| chr15_+_24942218 | 0.07 |
ENSRNOT00000016629
|
Peli2
|
pellino E3 ubiquitin protein ligase family member 2 |
| chr7_+_99954492 | 0.07 |
ENSRNOT00000005885
|
Trib1
|
tribbles pseudokinase 1 |
| chr6_+_54488038 | 0.07 |
ENSRNOT00000084661
ENSRNOT00000005637 |
Snx13
|
sorting nexin 13 |
| chr7_+_70753101 | 0.07 |
ENSRNOT00000090001
|
R3hdm2
|
R3H domain containing 2 |
| chr2_+_185590986 | 0.06 |
ENSRNOT00000088807
ENSRNOT00000088188 |
Lrba
|
LPS responsive beige-like anchor protein |
| chr1_+_190671696 | 0.06 |
ENSRNOT00000084934
|
AABR07005633.1
|
|
| chr17_+_86408151 | 0.06 |
ENSRNOT00000022734
|
Otud1
|
OTU deubiquitinase 1 |
| chr4_-_40136061 | 0.06 |
ENSRNOT00000009752
|
Bmt2
|
base methyltransferase of 25S rRNA 2 homolog |
| chr20_+_29655226 | 0.06 |
ENSRNOT00000089059
|
Spock2
|
SPARC/osteonectin, cwcv and kazal like domains proteoglycan 2 |
| chr7_-_139318455 | 0.06 |
ENSRNOT00000092029
|
Hdac7
|
histone deacetylase 7 |
| chr12_-_1816414 | 0.06 |
ENSRNOT00000041155
ENSRNOT00000067448 |
Insr
|
insulin receptor |
| chr1_+_15642153 | 0.06 |
ENSRNOT00000079845
|
Map7
|
microtubule-associated protein 7 |
| chr1_+_221236773 | 0.06 |
ENSRNOT00000051979
|
Slc25a45
|
solute carrier family 25, member 45 |
| chr10_+_89645973 | 0.06 |
ENSRNOT00000086892
|
Dhx8
|
DEAH-box helicase 8 |
| chr19_-_52206310 | 0.06 |
ENSRNOT00000087886
|
Mbtps1
|
membrane-bound transcription factor peptidase, site 1 |
| chr16_-_20807070 | 0.06 |
ENSRNOT00000072536
|
Comp
|
cartilage oligomeric matrix protein |
| chr5_+_48290061 | 0.06 |
ENSRNOT00000076508
|
Ube2j1
|
ubiquitin-conjugating enzyme E2, J1 |
| chr20_+_3823596 | 0.06 |
ENSRNOT00000087670
|
Rxrb
|
retinoid X receptor beta |
| chr8_+_11931767 | 0.06 |
ENSRNOT00000087963
|
Maml2
|
mastermind-like transcriptional coactivator 2 |
| chr2_+_257633425 | 0.05 |
ENSRNOT00000071770
|
Zzz3
|
zinc finger, ZZ-type containing 3 |
| chr6_+_108167716 | 0.05 |
ENSRNOT00000064426
|
Lin52
|
lin-52 DREAM MuvB core complex component |
| chr3_+_177351518 | 0.05 |
ENSRNOT00000023989
|
Pcmtd2
|
protein-L-isoaspartate (D-aspartate) O-methyltransferase domain containing 2 |
| chr1_-_90520344 | 0.05 |
ENSRNOT00000078598
|
Kctd15
|
potassium channel tetramerization domain containing 15 |
| chr10_-_40296470 | 0.05 |
ENSRNOT00000086456
|
Tnip1
|
TNFAIP3 interacting protein 1 |
| chr17_-_1093873 | 0.05 |
ENSRNOT00000086130
|
Ptch1
|
patched 1 |
| chr6_-_50786967 | 0.05 |
ENSRNOT00000009566
|
Cbll1
|
Cbl proto-oncogene like 1 |
| chr15_+_34216833 | 0.05 |
ENSRNOT00000025260
|
Pck2
|
phosphoenolpyruvate carboxykinase 2 (mitochondrial) |
| chr10_+_56824505 | 0.05 |
ENSRNOT00000067128
|
Slc16a11
|
solute carrier family 16, member 11 |
| chr2_+_31378743 | 0.05 |
ENSRNOT00000050384
|
AABR07007853.1
|
|
| chr10_-_94988461 | 0.05 |
ENSRNOT00000048490
|
Ddx5
|
DEAD-box helicase 5 |
| chr18_-_69671199 | 0.04 |
ENSRNOT00000082484
|
Smad4
|
SMAD family member 4 |
| chr6_+_27768943 | 0.04 |
ENSRNOT00000015820
|
Kif3c
|
kinesin family member 3C |
| chr5_+_113725717 | 0.04 |
ENSRNOT00000032248
|
Tek
|
TEK receptor tyrosine kinase |
| chr11_-_11585078 | 0.04 |
ENSRNOT00000088878
|
Robo2
|
roundabout guidance receptor 2 |
| chr5_-_157165767 | 0.04 |
ENSRNOT00000000167
|
Ubxn10
|
UBX domain protein 10 |
| chr1_+_178039063 | 0.04 |
ENSRNOT00000046313
|
Arntl
|
aryl hydrocarbon receptor nuclear translocator-like |
| chr4_+_169161585 | 0.04 |
ENSRNOT00000079785
|
Emp1
|
epithelial membrane protein 1 |
| chr7_-_91538673 | 0.04 |
ENSRNOT00000006209
|
Rad21
|
RAD21 cohesin complex component |
| chr3_-_46051096 | 0.04 |
ENSRNOT00000081302
|
Baz2b
|
bromodomain adjacent to zinc finger domain, 2B |
| chr4_+_153921115 | 0.04 |
ENSRNOT00000018821
|
Slc6a12
|
solute carrier family 6 member 12 |
| chr4_-_138885556 | 0.04 |
ENSRNOT00000008873
|
Crbn
|
cereblon |
| chr3_+_156886454 | 0.04 |
ENSRNOT00000022403
|
Lpin3
|
lipin 3 |
| chr5_-_50075454 | 0.04 |
ENSRNOT00000011085
|
Orc3
|
origin recognition complex, subunit 3 |
| chr3_+_120726906 | 0.04 |
ENSRNOT00000051069
|
Bcl2l11
|
BCL2 like 11 |
| chr4_-_17594598 | 0.04 |
ENSRNOT00000008936
|
Sema3e
|
semaphorin 3E |
| chr15_+_34234755 | 0.04 |
ENSRNOT00000059987
|
Dcaf11
|
DDB1 and CUL4 associated factor 11 |
| chr1_-_59347472 | 0.03 |
ENSRNOT00000017718
|
Lnpep
|
leucyl and cystinyl aminopeptidase |
| chr18_+_29972808 | 0.03 |
ENSRNOT00000074051
|
Pcdha4
|
protocadherin alpha 4 |
| chr6_-_109095557 | 0.03 |
ENSRNOT00000033493
|
Mlh3
|
mutL homolog 3 |
| chr2_+_189615948 | 0.03 |
ENSRNOT00000092144
|
Crtc2
|
CREB regulated transcription coactivator 2 |
| chr9_-_32019205 | 0.03 |
ENSRNOT00000016194
|
Adgrb3
|
adhesion G protein-coupled receptor B3 |
| chr15_+_34234193 | 0.03 |
ENSRNOT00000077584
|
Dcaf11
|
DDB1 and CUL4 associated factor 11 |
| chr2_+_198683159 | 0.03 |
ENSRNOT00000028793
|
Txnip
|
thioredoxin interacting protein |
| chr7_-_137856485 | 0.03 |
ENSRNOT00000007003
|
LOC688906
|
similar to splicing factor, arginine/serine-rich 2, interacting protein |
| chr4_-_157433467 | 0.03 |
ENSRNOT00000028965
|
Lag3
|
lymphocyte activating 3 |
| chr15_+_8730871 | 0.03 |
ENSRNOT00000081845
|
Nr1d2
|
nuclear receptor subfamily 1, group D, member 2 |
| chr6_-_51257625 | 0.03 |
ENSRNOT00000012004
|
Hbp1
|
HMG-box transcription factor 1 |
| chr1_-_264706476 | 0.03 |
ENSRNOT00000045446
|
AC121209.1
|
|
| chr9_+_43093138 | 0.03 |
ENSRNOT00000021592
|
Cnnm3
|
cyclin and CBS domain divalent metal cation transport mediator 3 |
| chr6_-_107080524 | 0.03 |
ENSRNOT00000011662
|
Zfyve1
|
zinc finger FYVE-type containing 1 |
| chr7_+_141053876 | 0.03 |
ENSRNOT00000084674
|
Tmbim6
|
transmembrane BAX inhibitor motif containing 6 |
| chr1_-_246110218 | 0.03 |
ENSRNOT00000077544
|
Rfx3
|
regulatory factor X3 |
| chr5_+_152533349 | 0.02 |
ENSRNOT00000067524
|
Trim63
|
tripartite motif containing 63 |
| chr1_+_68436917 | 0.02 |
ENSRNOT00000088586
|
LOC108348118
|
leucyl-cystinyl aminopeptidase |
| chr2_-_3124543 | 0.02 |
ENSRNOT00000036547
|
Fam81b
|
family with sequence similarity 81, member B |
| chr6_-_108167185 | 0.02 |
ENSRNOT00000015545
|
Aldh6a1
|
aldehyde dehydrogenase 6 family, member A1 |
| chr1_+_154606490 | 0.02 |
ENSRNOT00000024095
|
Ccdc89
|
coiled-coil domain containing 89 |
| chr4_+_145195070 | 0.02 |
ENSRNOT00000010723
|
Mtmr14
|
myotubularin related protein 14 |
| chr7_-_98197087 | 0.02 |
ENSRNOT00000010484
ENSRNOT00000079961 |
Klhl38
|
kelch-like family member 38 |
| chr9_-_37144015 | 0.02 |
ENSRNOT00000015638
|
Phf3
|
PHD finger protein 3 |
| chr9_-_71651512 | 0.02 |
ENSRNOT00000032782
|
Plekhm3
|
pleckstrin homology domain containing M3 |
| chr1_-_13395370 | 0.02 |
ENSRNOT00000085519
|
Ccdc28a
|
coiled-coil domain containing 28A |
| chr1_+_68436593 | 0.02 |
ENSRNOT00000080325
|
LOC108348118
|
leucyl-cystinyl aminopeptidase |
| chr18_+_65155685 | 0.02 |
ENSRNOT00000081797
|
Tcf4
|
transcription factor 4 |
| chr1_+_220114228 | 0.02 |
ENSRNOT00000026718
|
Ctsf
|
cathepsin F |
| chr13_-_101697684 | 0.02 |
ENSRNOT00000078834
|
Brox
|
BRO1 domain and CAAX motif containing |
| chr4_-_27331508 | 0.02 |
ENSRNOT00000090751
ENSRNOT00000010118 |
Akap9
|
A-kinase anchoring protein 9 |
| chr2_-_234296145 | 0.02 |
ENSRNOT00000014155
|
Elovl6
|
ELOVL fatty acid elongase 6 |
| chr8_+_111209908 | 0.02 |
ENSRNOT00000090221
|
Amotl2
|
angiomotin like 2 |
| chr1_-_100845392 | 0.02 |
ENSRNOT00000027436
|
Tbc1d17
|
TBC1 domain family, member 17 |
| chr14_+_34455934 | 0.01 |
ENSRNOT00000085991
ENSRNOT00000002981 |
Clock
|
clock circadian regulator |
| chrX_+_159513800 | 0.01 |
ENSRNOT00000065636
|
Htatsf1
|
HIV-1 Tat specific factor 1 |
| chr1_+_107262659 | 0.01 |
ENSRNOT00000022499
|
Gas2
|
growth arrest-specific 2 |
| chr6_+_93462852 | 0.01 |
ENSRNOT00000089473
|
Arid4a
|
AT-rich interaction domain 4A |
| chr6_-_124735741 | 0.01 |
ENSRNOT00000064716
ENSRNOT00000091693 |
Rps6ka5
|
ribosomal protein S6 kinase A5 |
| chr13_-_113871842 | 0.01 |
ENSRNOT00000079549
|
Cr1l
|
complement C3b/C4b receptor 1 like |
| chr14_+_83560541 | 0.01 |
ENSRNOT00000057738
ENSRNOT00000085228 |
Pik3ip1
|
phosphoinositide-3-kinase interacting protein 1 |
| chr20_-_4390436 | 0.01 |
ENSRNOT00000000497
ENSRNOT00000077655 |
Ppt2
|
palmitoyl-protein thioesterase 2 |
| chr4_+_62380914 | 0.01 |
ENSRNOT00000029845
|
Tmem140
|
transmembrane protein 140 |
| chr8_-_117446019 | 0.01 |
ENSRNOT00000042577
|
Arih2
|
ariadne RBR E3 ubiquitin protein ligase 2 |
| chr19_-_25345790 | 0.01 |
ENSRNOT00000010050
|
Zswim4
|
zinc finger, SWIM-type containing 4 |
| chr1_+_260798239 | 0.01 |
ENSRNOT00000036791
|
Lcor
|
ligand dependent nuclear receptor corepressor |
| chr2_+_34255305 | 0.01 |
ENSRNOT00000016649
ENSRNOT00000016596 |
Trim23
|
tripartite motif-containing 23 |
| chr13_+_89597138 | 0.01 |
ENSRNOT00000004662
|
Apoa2
|
apolipoprotein A2 |
| chr3_-_147865393 | 0.01 |
ENSRNOT00000009852
|
Sox12
|
SRY box 12 |
| chrX_-_154722220 | 0.01 |
ENSRNOT00000089743
ENSRNOT00000087893 |
Fmr1
|
fragile X mental retardation 1 |
| chr18_-_5314511 | 0.01 |
ENSRNOT00000022637
ENSRNOT00000079682 |
Zfp521
|
zinc finger protein 521 |
| chr6_+_8220228 | 0.01 |
ENSRNOT00000079279
ENSRNOT00000048656 |
Ppm1b
|
protein phosphatase, Mg2+/Mn2+ dependent, 1B |
| chr10_+_11206226 | 0.01 |
ENSRNOT00000006979
|
Tfap4
|
transcription factor AP-4 |
| chr8_+_104040934 | 0.01 |
ENSRNOT00000081204
|
Tfdp2
|
transcription factor Dp-2 |
| chr15_-_28314459 | 0.00 |
ENSRNOT00000042055
ENSRNOT00000040540 |
Ndrg2
|
NDRG family member 2 |
| chr1_-_134870255 | 0.00 |
ENSRNOT00000055829
|
Chd2
|
chromodomain helicase DNA binding protein 2 |
| chr4_+_139670092 | 0.00 |
ENSRNOT00000008879
|
Lrrn1
|
leucine rich repeat neuronal 1 |
| chr3_-_94657377 | 0.00 |
ENSRNOT00000077484
|
Tcp11l1
|
t-complex 11 like 1 |
| chr8_-_116469915 | 0.00 |
ENSRNOT00000024193
|
Sema3f
|
semaphorin 3F |
| chr16_+_53957858 | 0.00 |
ENSRNOT00000013078
|
Frg1
|
FSHD region gene 1 |
| chr10_-_87136026 | 0.00 |
ENSRNOT00000014230
ENSRNOT00000083233 |
Smarce1
|
SWI/SNF related, matrix associated, actin dependent regulator of chromatin, subfamily e, member 1 |
| chr18_+_3887419 | 0.00 |
ENSRNOT00000093089
|
Lama3
|
laminin subunit alpha 3 |
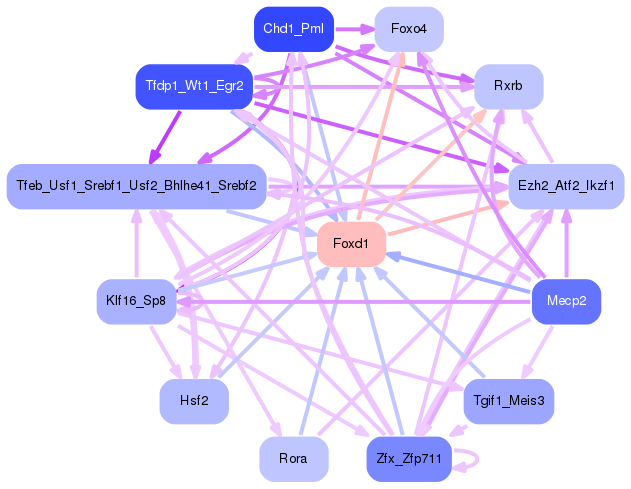
Network of associatons between targets according to the STRING database.

First level regulatory network of Foxd1
Gene Ontology Analysis
Gene overrepresentation in biological process category:
| Log-likelihood per target | Total log-likelihood | Term | Description |
|---|---|---|---|
| 0.1 | 0.2 | GO:0045575 | basophil activation(GO:0045575) |
| 0.0 | 0.1 | GO:0032915 | positive regulation of transforming growth factor beta2 production(GO:0032915) |
| 0.0 | 0.2 | GO:0042998 | positive regulation of Golgi to plasma membrane protein transport(GO:0042998) |
| 0.0 | 0.1 | GO:1904879 | positive regulation of calcium ion transmembrane transport via high voltage-gated calcium channel(GO:1904879) |
| 0.0 | 0.1 | GO:1902261 | positive regulation of delayed rectifier potassium channel activity(GO:1902261) |
| 0.0 | 0.1 | GO:0051088 | PMA-inducible membrane protein ectodomain proteolysis(GO:0051088) |
| 0.0 | 0.1 | GO:0001828 | inner cell mass cellular morphogenesis(GO:0001828) |
| 0.0 | 0.1 | GO:0010510 | regulation of acetyl-CoA biosynthetic process from pyruvate(GO:0010510) |
| 0.0 | 0.1 | GO:0007172 | signal complex assembly(GO:0007172) |
| 0.0 | 0.1 | GO:0045658 | regulation of neutrophil differentiation(GO:0045658) |
| 0.0 | 0.0 | GO:0009957 | epidermal cell fate specification(GO:0009957) neural plate axis specification(GO:0021997) |
| 0.0 | 0.0 | GO:0006116 | NADH oxidation(GO:0006116) |
| 0.0 | 0.1 | GO:2000301 | negative regulation of synaptic vesicle exocytosis(GO:2000301) |
| 0.0 | 0.0 | GO:0035262 | left ventricular cardiac muscle tissue morphogenesis(GO:0003220) cell proliferation involved in heart valve morphogenesis(GO:0003249) regulation of cell proliferation involved in heart valve morphogenesis(GO:0003250) gonad morphogenesis(GO:0035262) nephrogenic mesenchyme morphogenesis(GO:0072134) |
| 0.0 | 0.0 | GO:0048014 | Tie signaling pathway(GO:0048014) |
| 0.0 | 0.1 | GO:0035735 | intraciliary transport involved in cilium morphogenesis(GO:0035735) |
| 0.0 | 0.1 | GO:1990785 | response to water-immersion restraint stress(GO:1990785) |
| 0.0 | 0.2 | GO:0033148 | positive regulation of intracellular estrogen receptor signaling pathway(GO:0033148) |
| 0.0 | 0.0 | GO:0009992 | cellular water homeostasis(GO:0009992) |
| 0.0 | 0.0 | GO:1902299 | pre-replicative complex assembly involved in nuclear cell cycle DNA replication(GO:0006267) pre-replicative complex assembly(GO:0036388) pre-replicative complex assembly involved in cell cycle DNA replication(GO:1902299) |
| 0.0 | 0.0 | GO:1902263 | apoptotic process involved in embryonic digit morphogenesis(GO:1902263) |
| 0.0 | 0.1 | GO:0010360 | negative regulation of anion channel activity(GO:0010360) |
| 0.0 | 0.1 | GO:0031914 | negative regulation of synaptic plasticity(GO:0031914) |
| 0.0 | 0.1 | GO:0000066 | mitochondrial ornithine transport(GO:0000066) |
| 0.0 | 0.1 | GO:0007221 | positive regulation of transcription of Notch receptor target(GO:0007221) |
| 0.0 | 0.0 | GO:0010813 | neuropeptide catabolic process(GO:0010813) |
| 0.0 | 0.1 | GO:2000074 | regulation of type B pancreatic cell development(GO:2000074) |
| 0.0 | 0.1 | GO:0060267 | positive regulation of respiratory burst(GO:0060267) |
Gene overrepresentation in cellular component category:
| Log-likelihood per target | Total log-likelihood | Term | Description |
|---|---|---|---|
| 0.1 | 0.2 | GO:0035838 | growing cell tip(GO:0035838) |
| 0.0 | 0.1 | GO:0014701 | junctional sarcoplasmic reticulum membrane(GO:0014701) |
| 0.0 | 0.1 | GO:0043541 | UDP-N-acetylglucosamine transferase complex(GO:0043541) |
| 0.0 | 0.1 | GO:0005899 | insulin receptor complex(GO:0005899) |
| 0.0 | 0.1 | GO:0044305 | calyx of Held(GO:0044305) |
| 0.0 | 0.1 | GO:0060053 | neurofilament cytoskeleton(GO:0060053) |
| 0.0 | 0.0 | GO:0036387 | nuclear pre-replicative complex(GO:0005656) pre-replicative complex(GO:0036387) |
| 0.0 | 0.1 | GO:0071141 | SMAD protein complex(GO:0071141) |
| 0.0 | 0.0 | GO:0005712 | chiasma(GO:0005712) |
Gene overrepresentation in molecular function category:
| Log-likelihood per target | Total log-likelihood | Term | Description |
|---|---|---|---|
| 0.1 | 0.2 | GO:0035651 | AP-3 adaptor complex binding(GO:0035651) |
| 0.0 | 0.1 | GO:0004740 | pyruvate dehydrogenase (acetyl-transferring) kinase activity(GO:0004740) |
| 0.0 | 0.2 | GO:0071253 | connexin binding(GO:0071253) |
| 0.0 | 0.1 | GO:0086056 | voltage-gated calcium channel activity involved in AV node cell action potential(GO:0086056) |
| 0.0 | 0.0 | GO:0005119 | smoothened binding(GO:0005119) |
| 0.0 | 0.2 | GO:0008140 | cAMP response element binding protein binding(GO:0008140) |
| 0.0 | 0.1 | GO:0051425 | PTB domain binding(GO:0051425) |
| 0.0 | 0.1 | GO:0019992 | diacylglycerol binding(GO:0019992) |
| 0.0 | 0.1 | GO:0004719 | protein-L-isoaspartate (D-aspartate) O-methyltransferase activity(GO:0004719) |
| 0.0 | 0.1 | GO:0016433 | rRNA (adenine) methyltransferase activity(GO:0016433) |
| 0.0 | 0.1 | GO:0043495 | protein anchor(GO:0043495) |
| 0.0 | 0.1 | GO:0047696 | beta-adrenergic receptor kinase activity(GO:0047696) |
| 0.0 | 0.1 | GO:0005499 | vitamin D binding(GO:0005499) |
Gene overrepresentation in curated gene sets: REACTOME pathways category:
| Log-likelihood per target | Total log-likelihood | Term | Description |
|---|---|---|---|
| 0.0 | 0.2 | REACTOME SYNTHESIS OF PIPS AT THE EARLY ENDOSOME MEMBRANE | Genes involved in Synthesis of PIPs at the early endosome membrane |
| 0.0 | 0.0 | REACTOME ENDOSOMAL VACUOLAR PATHWAY | Genes involved in Endosomal/Vacuolar pathway |