Project
GSE49485: Hypoxia transcriptome sequencing of rat brain.
Navigation
Downloads
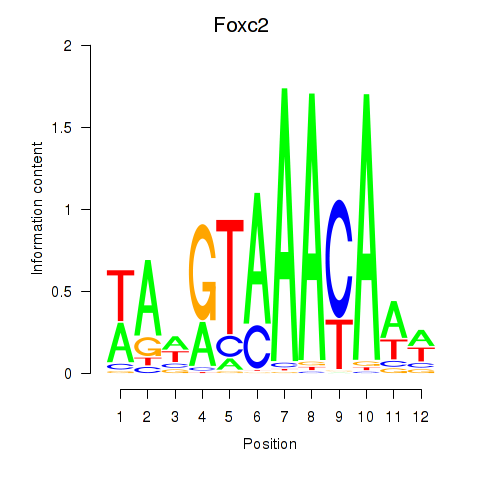
Results for Foxc2
Z-value: 0.41
Motif logo
Transcription factors associated with Foxc2
| Gene Symbol | Gene ID | Gene Info |
|---|---|---|
|
Foxc2
|
ENSRNOG00000047446 | forkhead box C2 |
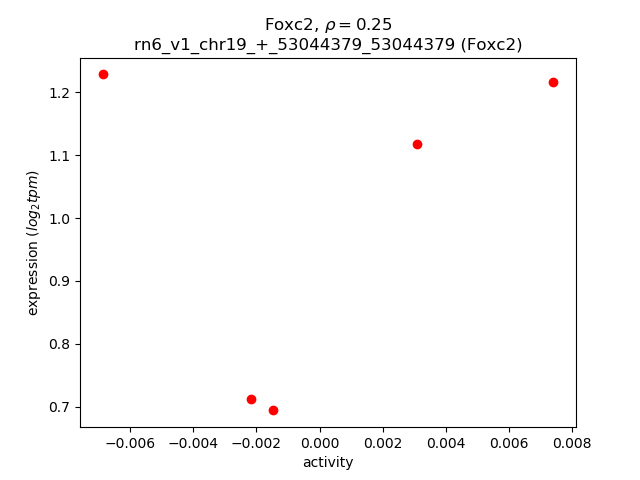
Activity-expression correlation:
| Gene | Promoter | Pearson corr. coef. | P-value | Plot |
|---|---|---|---|---|
| Foxc2 | rn6_v1_chr19_+_53044379_53044379 | 0.25 | 6.9e-01 | Click! |
Activity profile of Foxc2 motif
Sorted Z-values of Foxc2 motif
| Promoter | Log-likelihood | Transcript | Gene | Gene Info |
|---|---|---|---|---|
| chr2_+_145174876 | 0.70 |
ENSRNOT00000040631
|
Mab21l1
|
mab-21 like 1 |
| chr10_-_71849293 | 0.42 |
ENSRNOT00000003799
|
Lhx1
|
LIM homeobox 1 |
| chr4_+_51614676 | 0.37 |
ENSRNOT00000060494
|
Asb15
|
ankyrin repeat and SOCS box containing 15 |
| chr18_-_15540177 | 0.37 |
ENSRNOT00000022113
|
Ttr
|
transthyretin |
| chr15_-_25505691 | 0.16 |
ENSRNOT00000074488
|
LOC100911492
|
homeobox protein OTX2-like |
| chr18_-_5314511 | 0.15 |
ENSRNOT00000022637
ENSRNOT00000079682 |
Zfp521
|
zinc finger protein 521 |
| chr20_+_46429222 | 0.13 |
ENSRNOT00000076818
|
Foxo3
|
forkhead box O3 |
| chr14_+_42714315 | 0.11 |
ENSRNOT00000084095
ENSRNOT00000091449 |
Phox2b
|
paired-like homeobox 2b |
| chr4_-_115239723 | 0.11 |
ENSRNOT00000042699
|
Actg2
|
actin, gamma 2, smooth muscle, enteric |
| chr2_-_3124543 | 0.10 |
ENSRNOT00000036547
|
Fam81b
|
family with sequence similarity 81, member B |
| chr9_+_51298426 | 0.09 |
ENSRNOT00000065212
|
Gulp1
|
GULP, engulfment adaptor PTB domain containing 1 |
| chr1_+_154606490 | 0.08 |
ENSRNOT00000024095
|
Ccdc89
|
coiled-coil domain containing 89 |
| chr1_+_29432152 | 0.08 |
ENSRNOT00000019436
ENSRNOT00000083276 |
Trmt11
|
tRNA methyltransferase 11 homolog |
| chr7_-_114848414 | 0.07 |
ENSRNOT00000032620
|
Slc45a4
|
solute carrier family 45, member 4 |
| chr1_+_227592635 | 0.07 |
ENSRNOT00000072135
|
Ms4a4a
|
membrane-spanning 4-domains, subfamily A, member 4A |
| chr16_+_27399467 | 0.07 |
ENSRNOT00000065642
|
Tll1
|
tolloid-like 1 |
| chr1_-_156327352 | 0.06 |
ENSRNOT00000074282
|
LOC100911776
|
coiled-coil domain-containing protein 89-like |
| chr7_+_130071122 | 0.06 |
ENSRNOT00000078620
|
Selenoo
|
selenoprotein O |
| chr18_-_58097316 | 0.06 |
ENSRNOT00000088527
|
AABR07032265.1
|
|
| chr6_-_44363915 | 0.06 |
ENSRNOT00000085925
|
Id2
|
inhibitor of DNA binding 2, HLH protein |
| chr4_-_176528110 | 0.06 |
ENSRNOT00000049569
|
Slco1a2
|
solute carrier organic anion transporter family, member 1A2 |
| chr2_-_30634243 | 0.06 |
ENSRNOT00000077537
|
Marveld2
|
MARVEL domain containing 2 |
| chr6_-_104631355 | 0.05 |
ENSRNOT00000007825
|
Slc10a1
|
solute carrier family 10 member 1 |
| chr15_-_95514259 | 0.05 |
ENSRNOT00000038433
|
Slitrk6
|
SLIT and NTRK-like family, member 6 |
| chr3_+_60024013 | 0.05 |
ENSRNOT00000025255
|
Scrn3
|
secernin 3 |
| chr4_+_62221011 | 0.05 |
ENSRNOT00000041264
|
Cald1
|
caldesmon 1 |
| chr3_+_95939260 | 0.05 |
ENSRNOT00000041291
|
AABR07053188.1
|
|
| chr13_+_78979321 | 0.05 |
ENSRNOT00000003857
|
Ankrd45
|
ankyrin repeat domain 45 |
| chr16_+_47665816 | 0.05 |
ENSRNOT00000030519
|
Cdkn2aip
|
CDKN2A interacting protein |
| chr6_+_95826546 | 0.04 |
ENSRNOT00000043587
|
AABR07064810.1
|
|
| chr1_+_264741911 | 0.04 |
ENSRNOT00000019956
|
Sema4g
|
semaphorin 4G |
| chr3_+_149624712 | 0.04 |
ENSRNOT00000018581
|
Bpifa1
|
BPI fold containing family A, member 1 |
| chr4_+_179481263 | 0.04 |
ENSRNOT00000021284
|
Etfrf1
|
electron transfer flavoprotein regulatory factor 1 |
| chr2_+_195996521 | 0.04 |
ENSRNOT00000082849
|
Pogz
|
pogo transposable element with ZNF domain |
| chr6_-_51257625 | 0.04 |
ENSRNOT00000012004
|
Hbp1
|
HMG-box transcription factor 1 |
| chr4_+_62220736 | 0.03 |
ENSRNOT00000086377
|
Cald1
|
caldesmon 1 |
| chr4_+_62380914 | 0.03 |
ENSRNOT00000029845
|
Tmem140
|
transmembrane protein 140 |
| chr4_+_139670092 | 0.03 |
ENSRNOT00000008879
|
Lrrn1
|
leucine rich repeat neuronal 1 |
| chr13_+_97838361 | 0.03 |
ENSRNOT00000003641
|
Cnst
|
consortin, connexin sorting protein |
| chr2_-_233743866 | 0.03 |
ENSRNOT00000087062
|
Enpep
|
glutamyl aminopeptidase |
| chr3_-_60023913 | 0.03 |
ENSRNOT00000064662
|
Cir1
|
corepressor interacting with RBPJ, 1 |
| chr10_-_85825735 | 0.03 |
ENSRNOT00000055379
|
Fbxo47
|
F-box protein 47 |
| chr13_-_97838228 | 0.03 |
ENSRNOT00000003618
|
Tfb2m
|
transcription factor B2, mitochondrial |
| chr2_-_172361779 | 0.03 |
ENSRNOT00000085876
|
Schip1
|
schwannomin interacting protein 1 |
| chr10_+_105393072 | 0.02 |
ENSRNOT00000013359
|
Ubald2
|
UBA-like domain containing 2 |
| chr8_-_61595032 | 0.02 |
ENSRNOT00000023428
|
Snx33
|
sorting nexin 33 |
| chr9_-_55256340 | 0.02 |
ENSRNOT00000028907
|
Sdpr
|
serum deprivation response |
| chr18_-_69671199 | 0.02 |
ENSRNOT00000082484
|
Smad4
|
SMAD family member 4 |
| chr20_-_31597830 | 0.02 |
ENSRNOT00000085877
|
Col13a1
|
collagen type XIII alpha 1 chain |
| chrX_+_78991223 | 0.02 |
ENSRNOT00000031200
|
Fam46d
|
family with sequence similarity 46, member D |
| chr7_-_143523457 | 0.02 |
ENSRNOT00000012943
ENSRNOT00000082264 |
Krt4
|
keratin 4 |
| chr9_+_86874685 | 0.01 |
ENSRNOT00000041337
|
NEWGENE_1305560
|
neuronal tyrosine-phosphorylated phosphoinositide-3-kinase adaptor 2 |
| chr3_+_63536166 | 0.01 |
ENSRNOT00000016132
|
Plekha3
|
pleckstrin homology domain containing A3 |
| chrX_+_159703578 | 0.01 |
ENSRNOT00000001162
|
Cd40lg
|
CD40 ligand |
| chr5_+_162808646 | 0.01 |
ENSRNOT00000021155
|
Dhrs3
|
dehydrogenase/reductase 3 |
| chr20_+_29655226 | 0.01 |
ENSRNOT00000089059
|
Spock2
|
SPARC/osteonectin, cwcv and kazal like domains proteoglycan 2 |
| chr4_-_81241152 | 0.01 |
ENSRNOT00000015325
ENSRNOT00000015152 |
Hnrnpa2b1
|
heterogeneous nuclear ribonucleoprotein A2/B1 |
| chr4_+_71512695 | 0.01 |
ENSRNOT00000037220
|
Tas2r139
|
taste receptor, type 2, member 139 |
| chr3_-_160038078 | 0.01 |
ENSRNOT00000013445
|
Serinc3
|
serine incorporator 3 |
| chr17_-_45746753 | 0.01 |
ENSRNOT00000077475
|
RGD1564243
|
similar to brain Zn-finger protein |
| chr19_+_53055745 | 0.01 |
ENSRNOT00000074430
|
Foxl1
|
forkhead box L1 |
| chr3_+_51687809 | 0.01 |
ENSRNOT00000087242
|
Scn2a
|
sodium voltage-gated channel alpha subunit 2 |
| chr16_+_50181316 | 0.01 |
ENSRNOT00000077662
|
F11
|
coagulation factor XI |
| chr2_-_100249811 | 0.01 |
ENSRNOT00000086760
|
Hnf4g
|
hepatocyte nuclear factor 4, gamma |
| chr6_-_95890325 | 0.01 |
ENSRNOT00000050217
|
LOC690335
|
similar to 60S ribosomal protein L23a |
| chr5_+_103251986 | 0.01 |
ENSRNOT00000008757
|
Cntln
|
centlein |
| chr4_+_181428664 | 0.00 |
ENSRNOT00000002518
|
Rep15
|
RAB15 effector protein |
| chr12_-_7186873 | 0.00 |
ENSRNOT00000050438
|
LOC103690996
|
uncharacterized LOC103690996 |
| chr1_-_100845392 | 0.00 |
ENSRNOT00000027436
|
Tbc1d17
|
TBC1 domain family, member 17 |
| chr6_+_135139292 | 0.00 |
ENSRNOT00000043508
|
Rpl35al1
|
ribosomal protein L35a-like 1 |
| chr13_+_74456487 | 0.00 |
ENSRNOT00000065801
|
Angptl1
|
angiopoietin-like 1 |
| chr2_+_241909832 | 0.00 |
ENSRNOT00000047975
|
Ppp3ca
|
protein phosphatase 3 catalytic subunit alpha |
| chr18_+_3887419 | 0.00 |
ENSRNOT00000093089
|
Lama3
|
laminin subunit alpha 3 |
| chr3_-_63535991 | 0.00 |
ENSRNOT00000015722
|
Fkbp7
|
FK506 binding protein 7 |
| chr3_+_44806106 | 0.00 |
ENSRNOT00000035158
|
Upp2
|
uridine phosphorylase 2 |
| chr4_+_14070553 | 0.00 |
ENSRNOT00000077505
|
Cd36
|
CD36 molecule |
| chr5_+_164923302 | 0.00 |
ENSRNOT00000042285
|
LOC108349682
|
60S ribosomal protein L35a |
| chr18_+_68408890 | 0.00 |
ENSRNOT00000039702
|
Ccdc68
|
coiled-coil domain containing 68 |
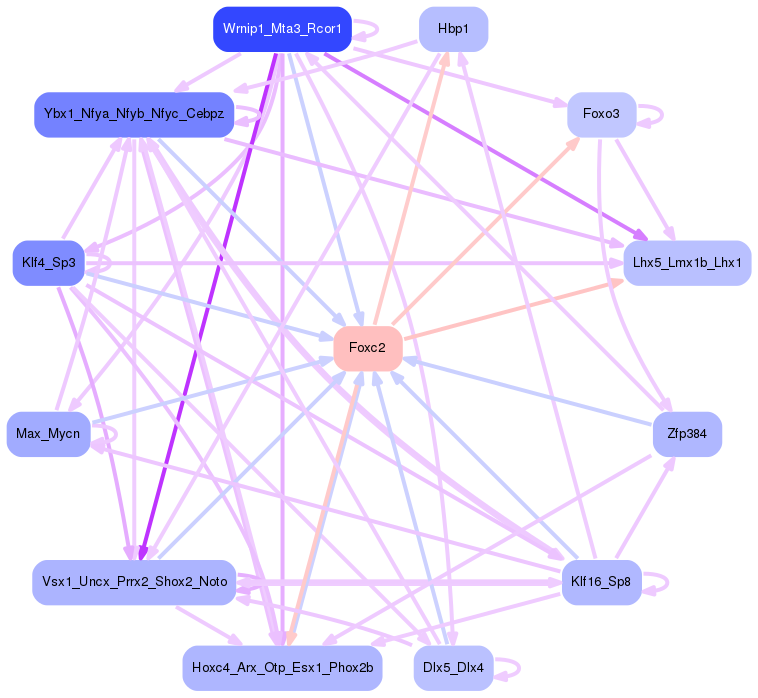
Network of associatons between targets according to the STRING database.

First level regulatory network of Foxc2
Gene Ontology Analysis
Gene overrepresentation in biological process category:
| Log-likelihood per target | Total log-likelihood | Term | Description |
|---|---|---|---|
| 0.1 | 0.4 | GO:0060066 | metanephric part of ureteric bud development(GO:0035502) oviduct development(GO:0060066) |
| 0.0 | 0.4 | GO:0070327 | thyroid hormone transport(GO:0070327) |
| 0.0 | 0.1 | GO:0048880 | medulla oblongata development(GO:0021550) sensory system development(GO:0048880) |
| 0.0 | 0.1 | GO:0015770 | disaccharide transport(GO:0015766) sucrose transport(GO:0015770) oligosaccharide transport(GO:0015772) |
| 0.0 | 0.1 | GO:0090131 | mesenchyme migration(GO:0090131) |
| 0.0 | 0.1 | GO:0071386 | cellular response to corticosterone stimulus(GO:0071386) |
| 0.0 | 0.1 | GO:0001966 | thigmotaxis(GO:0001966) |
| 0.0 | 0.0 | GO:0050828 | regulation of liquid surface tension(GO:0050828) |
Gene overrepresentation in cellular component category:
| Log-likelihood per target | Total log-likelihood | Term | Description |
|---|---|---|---|
| 0.0 | 0.1 | GO:0030478 | actin cap(GO:0030478) |
| 0.0 | 0.1 | GO:0061689 | tricellular tight junction(GO:0061689) |
Gene overrepresentation in molecular function category:
| Log-likelihood per target | Total log-likelihood | Term | Description |
|---|---|---|---|
| 0.0 | 0.4 | GO:0070324 | thyroid hormone binding(GO:0070324) |
| 0.0 | 0.1 | GO:0004809 | tRNA (guanine-N2-)-methyltransferase activity(GO:0004809) |
| 0.0 | 0.1 | GO:0008506 | sucrose:proton symporter activity(GO:0008506) sucrose transmembrane transporter activity(GO:0008515) disaccharide transmembrane transporter activity(GO:0015154) oligosaccharide transmembrane transporter activity(GO:0015157) |
| 0.0 | 0.1 | GO:0008508 | bile acid:sodium symporter activity(GO:0008508) |
Gene overrepresentation in curated gene sets: REACTOME pathways category:
| Log-likelihood per target | Total log-likelihood | Term | Description |
|---|---|---|---|
| 0.0 | 0.1 | REACTOME RECYCLING OF BILE ACIDS AND SALTS | Genes involved in Recycling of bile acids and salts |
| 0.0 | 0.4 | REACTOME AMYLOIDS | Genes involved in Amyloids |