Project
GSE49485: Hypoxia transcriptome sequencing of rat brain.
Navigation
Downloads
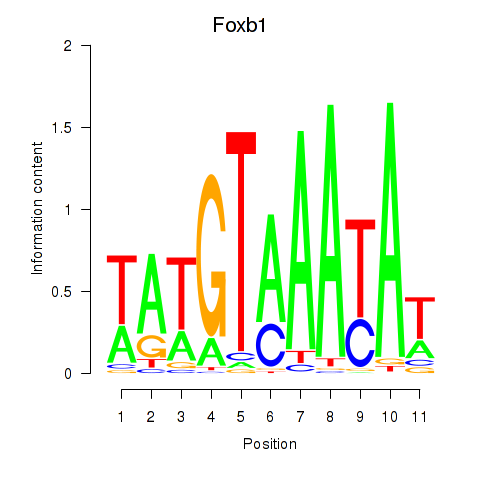
Results for Foxb1
Z-value: 0.20
Motif logo
Transcription factors associated with Foxb1
| Gene Symbol | Gene ID | Gene Info |
|---|---|---|
|
Foxb1
|
ENSRNOG00000010547 | forkhead box B1 |
Activity-expression correlation:
| Gene | Promoter | Pearson corr. coef. | P-value | Plot |
|---|---|---|---|---|
| Foxb1 | rn6_v1_chr8_-_75995371_75995371 | 0.36 | 5.5e-01 | Click! |
Activity profile of Foxb1 motif
Sorted Z-values of Foxb1 motif
| Promoter | Log-likelihood | Transcript | Gene | Gene Info |
|---|---|---|---|---|
| chr2_+_145174876 | 0.10 |
ENSRNOT00000040631
|
Mab21l1
|
mab-21 like 1 |
| chr9_-_15274917 | 0.09 |
ENSRNOT00000019650
|
Pgc
|
progastricsin |
| chr2_-_198382190 | 0.07 |
ENSRNOT00000044268
|
Hist2h2aa2
|
histone cluster 2, H2aa2 |
| chr2_+_198388809 | 0.07 |
ENSRNOT00000083087
|
Hist2h2aa3
|
histone cluster 2, H2aa3 |
| chr3_+_162357356 | 0.07 |
ENSRNOT00000030119
|
Eya2
|
EYA transcriptional coactivator and phosphatase 2 |
| chr3_-_141411170 | 0.06 |
ENSRNOT00000017364
|
Nkx2-2
|
NK2 homeobox 2 |
| chr16_+_50152008 | 0.05 |
ENSRNOT00000019237
|
Klkb1
|
kallikrein B1 |
| chr7_-_114848414 | 0.04 |
ENSRNOT00000032620
|
Slc45a4
|
solute carrier family 45, member 4 |
| chr10_+_56381813 | 0.04 |
ENSRNOT00000019687
|
Zbtb4
|
zinc finger and BTB domain containing 4 |
| chr8_-_80631873 | 0.04 |
ENSRNOT00000091661
ENSRNOT00000080662 |
Unc13c
|
unc-13 homolog C |
| chr4_-_81241152 | 0.04 |
ENSRNOT00000015325
ENSRNOT00000015152 |
Hnrnpa2b1
|
heterogeneous nuclear ribonucleoprotein A2/B1 |
| chr11_-_32858830 | 0.03 |
ENSRNOT00000002313
|
Runx1
|
runt-related transcription factor 1 |
| chr9_+_118849302 | 0.03 |
ENSRNOT00000087592
|
Dlgap1
|
DLG associated protein 1 |
| chr2_-_23909016 | 0.03 |
ENSRNOT00000084044
|
Scamp1
|
secretory carrier membrane protein 1 |
| chr18_-_55916220 | 0.03 |
ENSRNOT00000025934
|
Synpo
|
synaptopodin |
| chr13_-_36174908 | 0.02 |
ENSRNOT00000072295
|
Dbi
|
diazepam binding inhibitor, acyl-CoA binding protein |
| chr10_+_54156649 | 0.02 |
ENSRNOT00000074718
|
Gas7
|
growth arrest specific 7 |
| chr18_+_16146447 | 0.02 |
ENSRNOT00000022117
|
Galnt1
|
polypeptide N-acetylgalactosaminyltransferase 1 |
| chr14_+_42714315 | 0.02 |
ENSRNOT00000084095
ENSRNOT00000091449 |
Phox2b
|
paired-like homeobox 2b |
| chr2_-_233743866 | 0.02 |
ENSRNOT00000087062
|
Enpep
|
glutamyl aminopeptidase |
| chr9_+_2190915 | 0.02 |
ENSRNOT00000077417
|
Satb1
|
SATB homeobox 1 |
| chr13_-_94859390 | 0.02 |
ENSRNOT00000005467
ENSRNOT00000079763 |
AABR07021840.1
|
|
| chr4_+_62380914 | 0.01 |
ENSRNOT00000029845
|
Tmem140
|
transmembrane protein 140 |
| chr6_-_95061174 | 0.01 |
ENSRNOT00000072262
|
Rtn1
|
reticulon 1 |
| chr3_-_57607683 | 0.01 |
ENSRNOT00000093222
ENSRNOT00000058524 |
Mettl8
|
methyltransferase like 8 |
| chr3_+_65816569 | 0.01 |
ENSRNOT00000079672
|
Ube2e3
|
ubiquitin-conjugating enzyme E2E 3 |
| chr13_-_89242443 | 0.01 |
ENSRNOT00000029202
|
Atf6
|
activating transcription factor 6 |
| chr18_-_59819113 | 0.01 |
ENSRNOT00000065939
|
RGD1562699
|
RGD1562699 |
| chr2_-_30634243 | 0.01 |
ENSRNOT00000077537
|
Marveld2
|
MARVEL domain containing 2 |
| chr10_-_16046033 | 0.01 |
ENSRNOT00000089460
|
Cpeb4
|
cytoplasmic polyadenylation element binding protein 4 |
| chr20_+_12944786 | 0.01 |
ENSRNOT00000048218
|
Pcnt
|
pericentrin |
| chr4_+_148286858 | 0.01 |
ENSRNOT00000017294
ENSRNOT00000092294 ENSRNOT00000092477 |
March8
|
membrane associated ring-CH-type finger 8 |
| chr3_-_151258580 | 0.01 |
ENSRNOT00000026120
|
Edem2
|
ER degradation enhancing alpha-mannosidase like protein 2 |
| chr3_-_46153371 | 0.01 |
ENSRNOT00000085885
|
Baz2b
|
bromodomain adjacent to zinc finger domain, 2B |
| chr1_-_131460473 | 0.01 |
ENSRNOT00000084336
|
Nr2f2
|
nuclear receptor subfamily 2, group F, member 2 |
| chr9_-_121713091 | 0.01 |
ENSRNOT00000073432
|
Adcyap1
|
adenylate cyclase activating polypeptide 1 |
| chr6_-_95890325 | 0.01 |
ENSRNOT00000050217
|
LOC690335
|
similar to 60S ribosomal protein L23a |
| chr19_-_17045349 | 0.00 |
ENSRNOT00000086829
|
Fto
|
FTO, alpha-ketoglutarate dependent dioxygenase |
| chr1_-_134870255 | 0.00 |
ENSRNOT00000055829
|
Chd2
|
chromodomain helicase DNA binding protein 2 |
| chr11_-_45124423 | 0.00 |
ENSRNOT00000046383
|
Filip1l
|
filamin A interacting protein 1-like |
| chr1_+_80141630 | 0.00 |
ENSRNOT00000029552
|
Opa3
|
optic atrophy 3 |
| chr14_-_84820415 | 0.00 |
ENSRNOT00000057501
|
Mtmr3
|
myotubularin related protein 3 |
| chr7_-_107391184 | 0.00 |
ENSRNOT00000056793
|
Tmem71
|
transmembrane protein 71 |
| chr9_-_86103158 | 0.00 |
ENSRNOT00000021528
|
Cul3
|
cullin 3 |
| chr5_+_103251986 | 0.00 |
ENSRNOT00000008757
|
Cntln
|
centlein |
| chr2_+_239415046 | 0.00 |
ENSRNOT00000072196
|
Cxxc4
|
CXXC finger protein 4 |
| chr3_-_160038078 | 0.00 |
ENSRNOT00000013445
|
Serinc3
|
serine incorporator 3 |
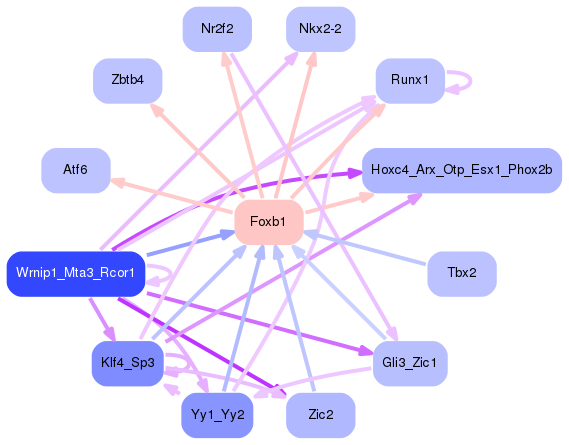
Network of associatons between targets according to the STRING database.

First level regulatory network of Foxb1
Gene Ontology Analysis
Gene overrepresentation in biological process category:
| Log-likelihood per target | Total log-likelihood | Term | Description |
|---|---|---|---|
| 0.0 | 0.1 | GO:0002225 | positive regulation of antimicrobial peptide production(GO:0002225) positive regulation of antibacterial peptide production(GO:0002803) |
| 0.0 | 0.1 | GO:0021530 | spinal cord oligodendrocyte cell differentiation(GO:0021529) spinal cord oligodendrocyte cell fate specification(GO:0021530) |
| 0.0 | 0.0 | GO:0015770 | disaccharide transport(GO:0015766) sucrose transport(GO:0015770) oligosaccharide transport(GO:0015772) |
| 0.0 | 0.0 | GO:0021550 | medulla oblongata development(GO:0021550) |
| 0.0 | 0.0 | GO:2000872 | positive regulation of progesterone secretion(GO:2000872) |
Gene overrepresentation in molecular function category:
| Log-likelihood per target | Total log-likelihood | Term | Description |
|---|---|---|---|
| 0.0 | 0.0 | GO:0015154 | sucrose:proton symporter activity(GO:0008506) sucrose transmembrane transporter activity(GO:0008515) disaccharide transmembrane transporter activity(GO:0015154) oligosaccharide transmembrane transporter activity(GO:0015157) |
| 0.0 | 0.0 | GO:0001069 | regulatory region RNA binding(GO:0001069) |