Project
GSE49485: Hypoxia transcriptome sequencing of rat brain.
Navigation
Downloads
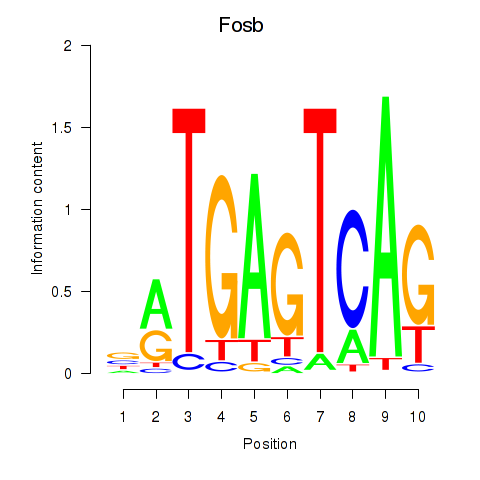
Results for Fosb
Z-value: 0.14
Motif logo
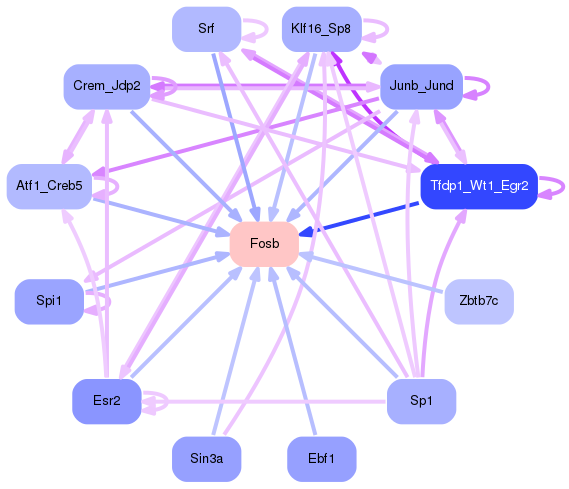
Transcription factors associated with Fosb
| Gene Symbol | Gene ID | Gene Info |
|---|---|---|
|
Fosb
|
ENSRNOG00000046667 | FosB proto-oncogene, AP-1 transcription factor subunit |
Activity-expression correlation:
| Gene | Promoter | Pearson corr. coef. | P-value | Plot |
|---|---|---|---|---|
| Fosb | rn6_v1_chr1_-_80221710_80221710 | 0.28 | 6.5e-01 | Click! |
Activity profile of Fosb motif
Sorted Z-values of Fosb motif
| Promoter | Log-likelihood | Transcript | Gene | Gene Info |
|---|---|---|---|---|
| chr2_+_204886202 | 0.06 |
ENSRNOT00000022200
|
Ngf
|
nerve growth factor |
| chr10_-_90312386 | 0.05 |
ENSRNOT00000028445
|
Slc4a1
|
solute carrier family 4 member 1 |
| chr5_+_161889342 | 0.05 |
ENSRNOT00000040481
|
LOC100362684
|
ribosomal protein S20-like |
| chr5_-_16706909 | 0.05 |
ENSRNOT00000011314
|
Rps20
|
ribosomal protein S20 |
| chr20_+_5040337 | 0.04 |
ENSRNOT00000068435
|
Clic1
|
chloride intracellular channel 1 |
| chr5_+_135687538 | 0.04 |
ENSRNOT00000091664
|
AC126292.2
|
|
| chr20_+_295250 | 0.03 |
ENSRNOT00000000955
|
Clic2
|
chloride intracellular channel 2 |
| chr15_-_34444244 | 0.03 |
ENSRNOT00000027612
|
Cideb
|
cell death-inducing DFFA-like effector b |
| chrX_-_142248369 | 0.02 |
ENSRNOT00000091330
|
Fgf13
|
fibroblast growth factor 13 |
| chr10_+_11338306 | 0.02 |
ENSRNOT00000033695
|
LOC100910875
|
protein FAM100A-like |
| chr3_+_22964230 | 0.02 |
ENSRNOT00000041813
|
LOC100362149
|
ribosomal protein S20-like |
| chr2_-_28799266 | 0.02 |
ENSRNOT00000089293
|
Tmem171
|
transmembrane protein 171 |
| chr4_-_119148358 | 0.02 |
ENSRNOT00000012218
|
Gkn1
|
gastrokine 1 |
| chr4_-_131694755 | 0.02 |
ENSRNOT00000013271
|
Foxp1
|
forkhead box P1 |
| chr18_+_81821127 | 0.02 |
ENSRNOT00000058199
|
Fbxo15
|
F-box protein 15 |
| chr10_-_87232723 | 0.02 |
ENSRNOT00000015150
|
Krt25
|
keratin 25 |
| chr10_-_87067456 | 0.02 |
ENSRNOT00000014163
|
Ccr7
|
C-C motif chemokine receptor 7 |
| chr4_+_176994129 | 0.01 |
ENSRNOT00000018734
|
Cmas
|
cytidine monophosphate N-acetylneuraminic acid synthetase |
| chr9_+_20251521 | 0.01 |
ENSRNOT00000005535
|
LOC100911625
|
gamma-enolase-like |
| chr1_-_256813711 | 0.01 |
ENSRNOT00000021055
|
Rbp4
|
retinol binding protein 4 |
| chr4_-_157294047 | 0.01 |
ENSRNOT00000005601
|
Eno2
|
enolase 2 |
| chr10_+_35537977 | 0.01 |
ENSRNOT00000071917
|
Rnf130
|
ring finger protein 130 |
| chr10_-_88036040 | 0.01 |
ENSRNOT00000018851
|
Krt13
|
keratin 13 |
| chr2_-_149417212 | 0.01 |
ENSRNOT00000018573
|
Gpr87
|
G protein-coupled receptor 87 |
| chr10_-_88152064 | 0.01 |
ENSRNOT00000019477
|
Krt16
|
keratin 16 |
| chr2_-_187863503 | 0.01 |
ENSRNOT00000093036
ENSRNOT00000026705 ENSRNOT00000082174 |
Lmna
|
lamin A/C |
| chr10_-_71382058 | 0.01 |
ENSRNOT00000043148
|
Dusp14
|
dual specificity phosphatase 14 |
| chr8_+_104106740 | 0.01 |
ENSRNOT00000015015
|
Tfdp2
|
transcription factor Dp-2 |
| chr4_+_7314369 | 0.01 |
ENSRNOT00000029724
|
Atg9b
|
autophagy related 9B |
| chr2_+_144861455 | 0.01 |
ENSRNOT00000093284
ENSRNOT00000019748 ENSRNOT00000072110 |
Dclk1
|
doublecortin-like kinase 1 |
| chr8_+_5522739 | 0.01 |
ENSRNOT00000011507
|
Mmp13
|
matrix metallopeptidase 13 |
| chr6_-_71199110 | 0.01 |
ENSRNOT00000081883
|
Prkd1
|
protein kinase D1 |
| chr8_+_5676665 | 0.01 |
ENSRNOT00000012310
|
Mmp3
|
matrix metallopeptidase 3 |
| chr7_+_23854846 | 0.01 |
ENSRNOT00000037290
|
Bpifc
|
BPI fold containing family C |
| chr12_-_2568382 | 0.01 |
ENSRNOT00000035142
|
Lrrc8e
|
leucine rich repeat containing 8 family, member E |
| chr2_-_45518502 | 0.01 |
ENSRNOT00000014627
|
Hspb3
|
heat shock protein family B (small) member 3 |
| chr19_+_52077501 | 0.01 |
ENSRNOT00000079240
|
Osgin1
|
oxidative stress induced growth inhibitor 1 |
| chr1_+_199555722 | 0.01 |
ENSRNOT00000054983
|
Itgax
|
integrin subunit alpha X |
| chr4_+_9882904 | 0.01 |
ENSRNOT00000016909
|
Dnajc2
|
DnaJ heat shock protein family (Hsp40) member C2 |
| chr13_+_51384389 | 0.00 |
ENSRNOT00000087025
|
Kdm5b
|
lysine demethylase 5B |
| chr4_+_71740532 | 0.00 |
ENSRNOT00000023537
|
Zyx
|
zyxin |
| chr20_-_2103864 | 0.00 |
ENSRNOT00000001014
|
Rnf39
|
ring finger protein 39 |
| chr1_+_20332371 | 0.00 |
ENSRNOT00000037259
|
Tmem200a
|
transmembrane protein 200A |
| chr11_+_87435185 | 0.00 |
ENSRNOT00000002558
|
P2rx6
|
purinergic receptor P2X 6 |
| chr7_-_143863186 | 0.00 |
ENSRNOT00000017096
|
Rarg
|
retinoic acid receptor, gamma |
| chr1_-_31122093 | 0.00 |
ENSRNOT00000016712
|
NEWGENE_1307525
|
SOGA family member 3 |
| chr17_-_55346279 | 0.00 |
ENSRNOT00000025037
|
Svil
|
supervillin |
| chr6_+_42092467 | 0.00 |
ENSRNOT00000060499
|
E2f6
|
E2F transcription factor 6 |
| chr19_+_41631715 | 0.00 |
ENSRNOT00000022749
|
Chst4
|
carbohydrate sulfotransferase 4 |
Network of associatons between targets according to the STRING database.

First level regulatory network of Fosb
Gene Ontology Analysis
Gene overrepresentation in biological process category:
| Log-likelihood per target | Total log-likelihood | Term | Description |
|---|---|---|---|
| 0.0 | 0.1 | GO:0010037 | response to carbon dioxide(GO:0010037) |
Gene overrepresentation in molecular function category:
| Log-likelihood per target | Total log-likelihood | Term | Description |
|---|---|---|---|
| 0.0 | 0.1 | GO:0005163 | nerve growth factor receptor binding(GO:0005163) |