Project
GSE49485: Hypoxia transcriptome sequencing of rat brain.
Navigation
Downloads
Results for Fos
Z-value: 0.63
Motif logo
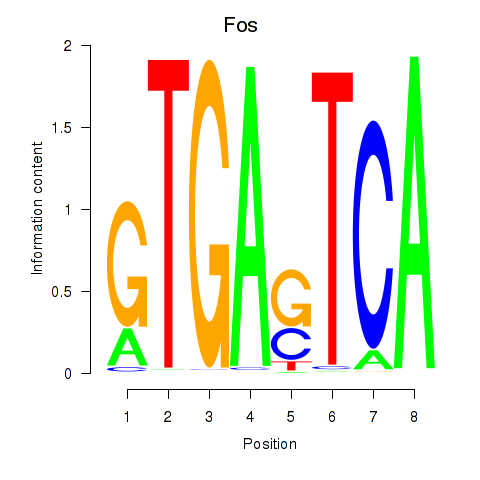
Transcription factors associated with Fos
| Gene Symbol | Gene ID | Gene Info |
|---|---|---|
|
Fos
|
ENSRNOG00000008015 | FBJ osteosarcoma oncogene |
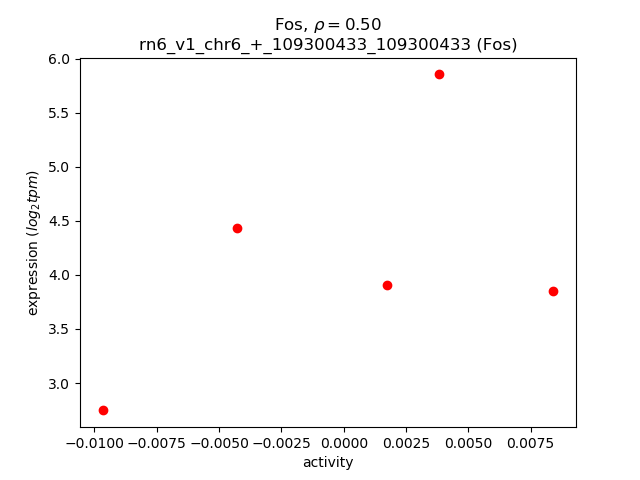
Activity-expression correlation:
| Gene | Promoter | Pearson corr. coef. | P-value | Plot |
|---|---|---|---|---|
| Fos | rn6_v1_chr6_+_109300433_109300433 | 0.50 | 3.9e-01 | Click! |
Activity profile of Fos motif
Sorted Z-values of Fos motif
| Promoter | Log-likelihood | Transcript | Gene | Gene Info |
|---|---|---|---|---|
| chr17_+_43357888 | 0.42 |
ENSRNOT00000022329
|
Scgn
|
secretagogin, EF-hand calcium binding protein |
| chr10_-_90312386 | 0.27 |
ENSRNOT00000028445
|
Slc4a1
|
solute carrier family 4 member 1 |
| chr20_+_5040337 | 0.25 |
ENSRNOT00000068435
|
Clic1
|
chloride intracellular channel 1 |
| chr20_+_295250 | 0.24 |
ENSRNOT00000000955
|
Clic2
|
chloride intracellular channel 2 |
| chr5_-_151397603 | 0.22 |
ENSRNOT00000076866
|
Gpr3
|
G protein-coupled receptor 3 |
| chr4_+_33638709 | 0.21 |
ENSRNOT00000009888
ENSRNOT00000034719 ENSRNOT00000052333 |
Tac1
|
tachykinin, precursor 1 |
| chr1_+_91152635 | 0.21 |
ENSRNOT00000073438
|
LOC100912070
|
dermokine-like |
| chr18_+_36371041 | 0.18 |
ENSRNOT00000025408
|
Sh3rf2
|
SH3 domain containing ring finger 2 |
| chr4_+_169147243 | 0.18 |
ENSRNOT00000011580
|
Emp1
|
epithelial membrane protein 1 |
| chr1_-_124803363 | 0.18 |
ENSRNOT00000066380
|
Klf13
|
Kruppel-like factor 13 |
| chr4_-_132171153 | 0.17 |
ENSRNOT00000015058
ENSRNOT00000015075 |
Prok2
|
prokineticin 2 |
| chr2_-_19808937 | 0.17 |
ENSRNOT00000044237
|
Atp6ap1l
|
ATPase H+ transporting accessory protein 1 like |
| chr8_-_33661049 | 0.16 |
ENSRNOT00000068037
|
Fli1
|
Fli-1 proto-oncogene, ETS transcription factor |
| chr3_+_37545238 | 0.16 |
ENSRNOT00000070792
|
Tnfaip6
|
TNF alpha induced protein 6 |
| chr7_-_11648322 | 0.15 |
ENSRNOT00000026871
|
Gadd45b
|
growth arrest and DNA-damage-inducible, beta |
| chr2_+_204886202 | 0.15 |
ENSRNOT00000022200
|
Ngf
|
nerve growth factor |
| chr1_+_220826560 | 0.15 |
ENSRNOT00000027891
|
Fosl1
|
FOS like 1, AP-1 transcription factor subunit |
| chr1_+_81230612 | 0.14 |
ENSRNOT00000026489
|
Kcnn4
|
potassium calcium-activated channel subfamily N member 4 |
| chr2_+_144861455 | 0.14 |
ENSRNOT00000093284
ENSRNOT00000019748 ENSRNOT00000072110 |
Dclk1
|
doublecortin-like kinase 1 |
| chr8_+_48571323 | 0.12 |
ENSRNOT00000059776
|
Ccdc153
|
coiled-coil domain containing 153 |
| chr4_-_131694755 | 0.12 |
ENSRNOT00000013271
|
Foxp1
|
forkhead box P1 |
| chr1_-_87191588 | 0.12 |
ENSRNOT00000027998
|
LOC100361913
|
rCG54286-like |
| chr13_-_70626252 | 0.11 |
ENSRNOT00000036947
|
Lamc2
|
laminin subunit gamma 2 |
| chr1_+_89215266 | 0.11 |
ENSRNOT00000093612
ENSRNOT00000084799 |
Dmkn
|
dermokine |
| chr4_+_78694447 | 0.11 |
ENSRNOT00000011945
|
Gpnmb
|
glycoprotein nmb |
| chr1_+_87066289 | 0.11 |
ENSRNOT00000027645
|
Capn12
|
calpain 12 |
| chr1_-_88111293 | 0.11 |
ENSRNOT00000077195
|
Spred3
|
sprouty-related, EVH1 domain containing 3 |
| chr5_-_153924896 | 0.11 |
ENSRNOT00000065247
|
Grhl3
|
grainyhead-like transcription factor 3 |
| chr7_-_115981731 | 0.10 |
ENSRNOT00000036549
|
RGD1308195
|
similar to secreted Ly6/uPAR related protein 2 |
| chr10_-_37099004 | 0.10 |
ENSRNOT00000075465
|
N4bp3
|
Nedd4 binding protein 3 |
| chr8_+_58870516 | 0.10 |
ENSRNOT00000033900
|
Gldn
|
gliomedin |
| chr1_-_89473904 | 0.10 |
ENSRNOT00000089474
|
Fxyd5
|
FXYD domain-containing ion transport regulator 5 |
| chr8_-_85840818 | 0.10 |
ENSRNOT00000013608
|
Eef1a1
|
eukaryotic translation elongation factor 1 alpha 1 |
| chr1_+_198690794 | 0.10 |
ENSRNOT00000023999
|
Zfp771
|
zinc finger protein 771 |
| chr8_+_119228612 | 0.10 |
ENSRNOT00000078439
ENSRNOT00000043737 |
Lrrc2
|
leucine rich repeat containing 2 |
| chr4_+_169161585 | 0.10 |
ENSRNOT00000079785
|
Emp1
|
epithelial membrane protein 1 |
| chr10_-_83655182 | 0.10 |
ENSRNOT00000007897
|
Abi3
|
ABI family, member 3 |
| chr14_-_10395047 | 0.10 |
ENSRNOT00000002936
|
Gpat3
|
glycerol-3-phosphate acyltransferase 3 |
| chr10_-_35005287 | 0.10 |
ENSRNOT00000032386
|
LOC103689949
|
nedd4 binding protein 3 |
| chr1_+_79989019 | 0.10 |
ENSRNOT00000020428
|
Dmpk
|
dystrophia myotonica-protein kinase |
| chr3_-_2411544 | 0.10 |
ENSRNOT00000012406
|
Tor4a
|
torsin family 4, member A |
| chr1_-_88193346 | 0.09 |
ENSRNOT00000078600
|
LOC103690068
|
immortalization up-regulated protein-like |
| chr5_+_59008933 | 0.09 |
ENSRNOT00000023060
|
Car9
|
carbonic anhydrase 9 |
| chr15_-_34444244 | 0.09 |
ENSRNOT00000027612
|
Cideb
|
cell death-inducing DFFA-like effector b |
| chr3_+_110442637 | 0.09 |
ENSRNOT00000010471
|
Pak6
|
p21 (RAC1) activated kinase 6 |
| chr2_-_149417212 | 0.09 |
ENSRNOT00000018573
|
Gpr87
|
G protein-coupled receptor 87 |
| chr1_-_89474252 | 0.09 |
ENSRNOT00000028597
|
Fxyd5
|
FXYD domain-containing ion transport regulator 5 |
| chr13_-_70625842 | 0.09 |
ENSRNOT00000092499
|
Lamc2
|
laminin subunit gamma 2 |
| chr20_+_12658065 | 0.09 |
ENSRNOT00000072951
ENSRNOT00000001679 |
Col6a1
|
collagen type VI alpha 1 chain |
| chr10_-_87067456 | 0.09 |
ENSRNOT00000014163
|
Ccr7
|
C-C motif chemokine receptor 7 |
| chr1_-_170318935 | 0.08 |
ENSRNOT00000024119
|
Prkcdbp
|
protein kinase C, delta binding protein |
| chr8_-_128665988 | 0.08 |
ENSRNOT00000050543
|
Csrnp1
|
cysteine and serine rich nuclear protein 1 |
| chr9_+_17817721 | 0.08 |
ENSRNOT00000086986
ENSRNOT00000026920 |
Hsp90ab1
|
heat shock protein 90 alpha family class B member 1 |
| chr5_+_135687538 | 0.08 |
ENSRNOT00000091664
|
AC126292.2
|
|
| chr17_+_13670520 | 0.08 |
ENSRNOT00000019442
|
Shc3
|
SHC adaptor protein 3 |
| chr2_-_60657712 | 0.07 |
ENSRNOT00000040348
|
Rai14
|
retinoic acid induced 14 |
| chr7_+_99954492 | 0.07 |
ENSRNOT00000005885
|
Trib1
|
tribbles pseudokinase 1 |
| chr9_+_18564927 | 0.07 |
ENSRNOT00000061014
|
Runx2
|
runt-related transcription factor 2 |
| chr3_-_2444281 | 0.07 |
ENSRNOT00000013863
|
Tubb4b
|
tubulin, beta 4B class IVb |
| chr10_+_105499569 | 0.07 |
ENSRNOT00000088457
|
Sphk1
|
sphingosine kinase 1 |
| chr1_-_24191908 | 0.06 |
ENSRNOT00000061157
|
Sgk1
|
serum/glucocorticoid regulated kinase 1 |
| chr2_+_26240385 | 0.06 |
ENSRNOT00000024292
|
F2rl2
|
coagulation factor II (thrombin) receptor-like 2 |
| chr10_+_10889488 | 0.06 |
ENSRNOT00000071746
|
Ubald1
|
UBA-like domain containing 1 |
| chr9_+_66335492 | 0.06 |
ENSRNOT00000037555
|
RGD1562029
|
similar to KIAA2012 protein |
| chr4_+_83713666 | 0.06 |
ENSRNOT00000086473
|
Creb5
|
cAMP responsive element binding protein 5 |
| chr1_+_140601791 | 0.06 |
ENSRNOT00000091588
|
Isg20
|
interferon stimulated exonuclease gene 20 |
| chr4_+_176994129 | 0.06 |
ENSRNOT00000018734
|
Cmas
|
cytidine monophosphate N-acetylneuraminic acid synthetase |
| chr10_+_59831241 | 0.06 |
ENSRNOT00000026596
|
Trpv3
|
transient receptor potential cation channel, subfamily V, member 3 |
| chr15_+_12827707 | 0.06 |
ENSRNOT00000012452
|
Fezf2
|
Fez family zinc finger 2 |
| chr19_+_52077501 | 0.06 |
ENSRNOT00000079240
|
Osgin1
|
oxidative stress induced growth inhibitor 1 |
| chr3_-_164055561 | 0.06 |
ENSRNOT00000064849
|
B4galt5
|
beta-1,4-galactosyltransferase 5 |
| chr1_-_174411141 | 0.06 |
ENSRNOT00000065288
|
Nrip3
|
nuclear receptor interacting protein 3 |
| chr4_+_157511642 | 0.06 |
ENSRNOT00000065846
|
Pianp
|
PILR alpha associated neural protein |
| chr2_+_199199845 | 0.06 |
ENSRNOT00000020932
|
LOC100909441
|
tubulin alpha-1C chain-like |
| chr4_+_7314369 | 0.05 |
ENSRNOT00000029724
|
Atg9b
|
autophagy related 9B |
| chr8_+_117117430 | 0.05 |
ENSRNOT00000073247
|
Gpx1
|
glutathione peroxidase 1 |
| chr13_+_92264231 | 0.05 |
ENSRNOT00000066509
ENSRNOT00000004716 |
Spta1
|
spectrin, alpha, erythrocytic 1 |
| chr19_+_55094585 | 0.05 |
ENSRNOT00000068452
|
Zfpm1
|
zinc finger protein, multitype 1 |
| chr14_-_85484275 | 0.05 |
ENSRNOT00000083770
|
Kremen1
|
kringle containing transmembrane protein 1 |
| chr8_-_128249538 | 0.05 |
ENSRNOT00000082892
|
Scn5a
|
sodium voltage-gated channel alpha subunit 5 |
| chr5_-_144274981 | 0.05 |
ENSRNOT00000065871
|
Map7d1
|
MAP7 domain containing 1 |
| chr11_-_33003021 | 0.05 |
ENSRNOT00000084134
|
Runx1
|
runt-related transcription factor 1 |
| chr3_+_55910177 | 0.05 |
ENSRNOT00000009969
|
Klhl41
|
kelch-like family member 41 |
| chr3_+_113976687 | 0.05 |
ENSRNOT00000022437
|
Eif3j
|
eukaryotic translation initiation factor 3, subunit J |
| chr7_-_114573900 | 0.05 |
ENSRNOT00000011219
|
Ptk2
|
protein tyrosine kinase 2 |
| chr8_+_75687100 | 0.05 |
ENSRNOT00000038677
|
Anxa2
|
annexin A2 |
| chr3_+_1452644 | 0.05 |
ENSRNOT00000007949
|
Il1rn
|
interleukin 1 receptor antagonist |
| chr1_-_252461461 | 0.05 |
ENSRNOT00000026093
|
Ankrd22
|
ankyrin repeat domain 22 |
| chr10_-_81666523 | 0.05 |
ENSRNOT00000003658
|
Nme1
|
NME/NM23 nucleoside diphosphate kinase 1 |
| chr8_-_120446455 | 0.05 |
ENSRNOT00000085161
ENSRNOT00000042854 ENSRNOT00000037199 |
Arpp21
|
cAMP regulated phosphoprotein 21 |
| chr11_-_84047497 | 0.05 |
ENSRNOT00000088821
ENSRNOT00000058092 |
Ap2m1
|
adaptor-related protein complex 2, mu 1 subunit |
| chr8_-_82492243 | 0.05 |
ENSRNOT00000013852
|
Tmod3
|
tropomodulin 3 |
| chrX_-_142248369 | 0.04 |
ENSRNOT00000091330
|
Fgf13
|
fibroblast growth factor 13 |
| chr1_+_240908483 | 0.04 |
ENSRNOT00000019367
|
Klf9
|
Kruppel-like factor 9 |
| chr7_+_70580198 | 0.04 |
ENSRNOT00000083472
ENSRNOT00000008941 |
Ddit3
|
DNA-damage inducible transcript 3 |
| chr3_-_151600140 | 0.04 |
ENSRNOT00000026451
|
Fer1l4
|
fer-1-like family member 4 |
| chrX_+_28593405 | 0.04 |
ENSRNOT00000071708
|
Tmsb4x
|
thymosin beta 4, X-linked |
| chrX_-_31968152 | 0.04 |
ENSRNOT00000004884
|
Pir
|
pirin |
| chr5_+_137357674 | 0.04 |
ENSRNOT00000092813
|
RGD1305347
|
similar to RIKEN cDNA 2610528J11 |
| chr10_+_46018659 | 0.04 |
ENSRNOT00000040865
ENSRNOT00000004357 |
Mprip
|
myosin phosphatase Rho interacting protein |
| chr10_+_35857797 | 0.04 |
ENSRNOT00000004517
|
Cby3
|
chibby family member 3 |
| chr9_-_17206994 | 0.04 |
ENSRNOT00000026195
|
Gtpbp2
|
GTP binding protein 2 |
| chr2_-_227207584 | 0.04 |
ENSRNOT00000065361
ENSRNOT00000080215 |
Myoz2
|
myozenin 2 |
| chr3_-_29984201 | 0.04 |
ENSRNOT00000006350
|
Zeb2
|
zinc finger E-box binding homeobox 2 |
| chr19_-_39646693 | 0.04 |
ENSRNOT00000019104
|
Psmd7
|
proteasome 26S subunit, non-ATPase 7 |
| chr13_-_50499060 | 0.04 |
ENSRNOT00000065347
ENSRNOT00000076924 |
Etnk2
|
ethanolamine kinase 2 |
| chr7_+_3332788 | 0.04 |
ENSRNOT00000010180
|
Cd63
|
Cd63 molecule |
| chr10_-_88050622 | 0.04 |
ENSRNOT00000019037
|
Krt15
|
keratin 15 |
| chr6_+_135610743 | 0.04 |
ENSRNOT00000010906
|
Traf3
|
Tnf receptor-associated factor 3 |
| chr3_-_29993715 | 0.04 |
ENSRNOT00000085801
|
Zeb2
|
zinc finger E-box binding homeobox 2 |
| chr9_-_100306194 | 0.04 |
ENSRNOT00000087584
|
RGD1563692
|
similar to hypothetical protein FLJ22671 |
| chr7_+_3216497 | 0.04 |
ENSRNOT00000008909
|
Mmp19
|
matrix metallopeptidase 19 |
| chr4_+_61924013 | 0.03 |
ENSRNOT00000090717
|
Bpgm
|
bisphosphoglycerate mutase |
| chr4_+_9882904 | 0.03 |
ENSRNOT00000016909
|
Dnajc2
|
DnaJ heat shock protein family (Hsp40) member C2 |
| chr2_-_28799266 | 0.03 |
ENSRNOT00000089293
|
Tmem171
|
transmembrane protein 171 |
| chr7_-_11330278 | 0.03 |
ENSRNOT00000027730
|
Matk
|
megakaryocyte-associated tyrosine kinase |
| chr2_-_187863503 | 0.03 |
ENSRNOT00000093036
ENSRNOT00000026705 ENSRNOT00000082174 |
Lmna
|
lamin A/C |
| chr3_+_22964230 | 0.03 |
ENSRNOT00000041813
|
LOC100362149
|
ribosomal protein S20-like |
| chr17_-_35037076 | 0.03 |
ENSRNOT00000090946
|
Dusp22
|
dual specificity phosphatase 22 |
| chr7_+_143122269 | 0.03 |
ENSRNOT00000082542
ENSRNOT00000045495 ENSRNOT00000081386 ENSRNOT00000067422 |
Krt86
|
keratin 86 |
| chr8_+_5606592 | 0.03 |
ENSRNOT00000011727
|
Mmp12
|
matrix metallopeptidase 12 |
| chr18_+_27923572 | 0.03 |
ENSRNOT00000008041
|
Ctnna1
|
catenin alpha 1 |
| chr15_-_33358138 | 0.03 |
ENSRNOT00000019155
|
Cebpe
|
CCAAT/enhancer binding protein epsilon |
| chr13_+_88557860 | 0.03 |
ENSRNOT00000058547
|
Sh2d1b2
|
SH2 domain containing 1B2 |
| chr7_+_23854846 | 0.03 |
ENSRNOT00000037290
|
Bpifc
|
BPI fold containing family C |
| chr1_+_199555722 | 0.03 |
ENSRNOT00000054983
|
Itgax
|
integrin subunit alpha X |
| chr12_+_11240761 | 0.03 |
ENSRNOT00000001310
|
Pdap1
|
PDGFA associated protein 1 |
| chr7_+_54213319 | 0.03 |
ENSRNOT00000005286
|
Nap1l1
|
nucleosome assembly protein 1-like 1 |
| chr3_-_22951711 | 0.03 |
ENSRNOT00000016876
ENSRNOT00000085981 |
Psmb7
|
proteasome subunit beta 7 |
| chr8_-_115179191 | 0.02 |
ENSRNOT00000017224
|
Parp3
|
poly (ADP-ribose) polymerase family, member 3 |
| chr1_-_19376301 | 0.02 |
ENSRNOT00000015547
|
Arhgap18
|
Rho GTPase activating protein 18 |
| chr10_+_67762995 | 0.02 |
ENSRNOT00000000253
|
Zfp207
|
zinc finger protein 207 |
| chr13_+_100980574 | 0.02 |
ENSRNOT00000067005
ENSRNOT00000004649 |
Capn8
|
calpain 8 |
| chr10_-_71382058 | 0.02 |
ENSRNOT00000043148
|
Dusp14
|
dual specificity phosphatase 14 |
| chr20_+_25990304 | 0.02 |
ENSRNOT00000033980
|
Lrrtm3
|
leucine rich repeat transmembrane neuronal 3 |
| chrX_+_17171605 | 0.02 |
ENSRNOT00000048236
|
Nudt10
|
nudix (nucleoside diphosphate linked moiety X)-type motif 10 |
| chr5_+_157327657 | 0.02 |
ENSRNOT00000022847
|
Pla2g2e
|
phospholipase A2, group IIE |
| chr12_+_7865938 | 0.02 |
ENSRNOT00000061229
|
Ubl3
|
ubiquitin-like 3 |
| chr6_+_50528823 | 0.02 |
ENSRNOT00000008321
|
Lamb1
|
laminin subunit beta 1 |
| chr5_+_48290061 | 0.02 |
ENSRNOT00000076508
|
Ube2j1
|
ubiquitin-conjugating enzyme E2, J1 |
| chr13_-_36101411 | 0.02 |
ENSRNOT00000074471
|
Tmem37
|
transmembrane protein 37 |
| chr1_+_244615821 | 0.02 |
ENSRNOT00000080124
|
Smarca2
|
SWI/SNF related, matrix associated, actin dependent regulator of chromatin, subfamily a, member 2 |
| chr3_-_92242318 | 0.02 |
ENSRNOT00000007018
|
Trim44
|
tripartite motif-containing 44 |
| chr5_+_168019058 | 0.02 |
ENSRNOT00000077202
|
Tnfrsf9
|
TNF receptor superfamily member 9 |
| chr20_+_31102476 | 0.02 |
ENSRNOT00000078719
|
Lrrc20
|
leucine rich repeat containing 20 |
| chr10_+_4312863 | 0.02 |
ENSRNOT00000091610
|
LOC100911685
|
eukaryotic peptide chain release factor GTP-binding subunit ERF3B-like |
| chr17_-_55300998 | 0.02 |
ENSRNOT00000064331
|
Svil
|
supervillin |
| chr10_+_11338306 | 0.02 |
ENSRNOT00000033695
|
LOC100910875
|
protein FAM100A-like |
| chr10_-_35716260 | 0.02 |
ENSRNOT00000004308
ENSRNOT00000059255 |
Sqstm1
|
sequestosome 1 |
| chr14_+_19319299 | 0.02 |
ENSRNOT00000086542
|
Ankrd17
|
ankyrin repeat domain 17 |
| chr4_+_129574264 | 0.02 |
ENSRNOT00000010185
|
Arl6ip5
|
ADP-ribosylation factor like GTPase 6 interacting protein 5 |
| chr3_+_156886454 | 0.02 |
ENSRNOT00000022403
|
Lpin3
|
lipin 3 |
| chr2_+_243502073 | 0.02 |
ENSRNOT00000015870
|
Adh7
|
alcohol dehydrogenase 7 (class IV), mu or sigma polypeptide |
| chr19_-_9777465 | 0.02 |
ENSRNOT00000017413
|
Ndrg4
|
NDRG family member 4 |
| chr9_+_66058047 | 0.02 |
ENSRNOT00000071819
|
Cdk15
|
cyclin-dependent kinase 15 |
| chr7_+_121480723 | 0.02 |
ENSRNOT00000065304
|
Atf4
|
activating transcription factor 4 |
| chr10_-_88122233 | 0.02 |
ENSRNOT00000083895
ENSRNOT00000005285 |
Krt14
|
keratin 14 |
| chr17_+_10138810 | 0.01 |
ENSRNOT00000079850
|
Hk3
|
hexokinase 3 |
| chr10_+_88992487 | 0.01 |
ENSRNOT00000027061
|
Coasy
|
Coenzyme A synthase |
| chr7_-_2712723 | 0.01 |
ENSRNOT00000004363
|
Il23a
|
interleukin 23 subunit alpha |
| chrX_-_74968405 | 0.01 |
ENSRNOT00000035653
|
RGD1561931
|
similar to KIAA2022 protein |
| chr15_+_42653148 | 0.01 |
ENSRNOT00000022095
|
Clu
|
clusterin |
| chr18_-_28301863 | 0.01 |
ENSRNOT00000026895
|
Sil1
|
SIL1 nucleotide exchange factor |
| chr4_+_3959640 | 0.01 |
ENSRNOT00000009439
|
Paxip1
|
PAX interacting protein 1 |
| chr7_-_115963046 | 0.01 |
ENSRNOT00000007923
|
Slurp1
|
secreted Ly6/Plaur domain containing 1 |
| chrX_-_115073890 | 0.01 |
ENSRNOT00000006638
|
Capn6
|
calpain 6 |
| chr4_-_155401480 | 0.01 |
ENSRNOT00000020735
|
Apobec1
|
apolipoprotein B mRNA editing enzyme catalytic subunit 1 |
| chr2_-_187863349 | 0.01 |
ENSRNOT00000084455
|
Lmna
|
lamin A/C |
| chr17_+_9109731 | 0.01 |
ENSRNOT00000016009
|
Cxcl14
|
C-X-C motif chemokine ligand 14 |
| chr13_+_105408179 | 0.01 |
ENSRNOT00000003378
|
Ddx3y
|
DEAD (Asp-Glu-Ala-Asp) box helicase 3, Y-linked |
| chr3_+_164665532 | 0.01 |
ENSRNOT00000014309
|
Ptpn1
|
protein tyrosine phosphatase, non-receptor type 1 |
| chr12_-_2568382 | 0.01 |
ENSRNOT00000035142
|
Lrrc8e
|
leucine rich repeat containing 8 family, member E |
| chr2_-_196207560 | 0.01 |
ENSRNOT00000028589
|
Psmd4
|
proteasome 26S subunit, non-ATPase 4 |
| chr8_+_113938626 | 0.01 |
ENSRNOT00000065794
|
Aste1
|
asteroid homolog 1 (Drosophila) |
| chr17_-_70481750 | 0.01 |
ENSRNOT00000025252
|
Il15ra
|
interleukin 15 receptor subunit alpha |
| chr2_+_211050360 | 0.01 |
ENSRNOT00000026928
|
Psma5
|
proteasome subunit alpha 5 |
| chr3_+_44806106 | 0.01 |
ENSRNOT00000035158
|
Upp2
|
uridine phosphorylase 2 |
| chr10_-_88163712 | 0.01 |
ENSRNOT00000005382
ENSRNOT00000084493 |
Krt17
|
keratin 17 |
| chrX_+_69730242 | 0.01 |
ENSRNOT00000075980
ENSRNOT00000076425 |
Eda
|
ectodysplasin-A |
| chr2_-_192027225 | 0.01 |
ENSRNOT00000016430
|
Prr9
|
proline rich 9 |
| chr2_+_225310624 | 0.01 |
ENSRNOT00000015836
|
F3
|
coagulation factor III, tissue factor |
| chrX_+_43625169 | 0.01 |
ENSRNOT00000086311
|
Sat1
|
spermidine/spermine N1-acetyl transferase 1 |
| chr10_-_87232723 | 0.01 |
ENSRNOT00000015150
|
Krt25
|
keratin 25 |
| chr1_-_256813711 | 0.01 |
ENSRNOT00000021055
|
Rbp4
|
retinol binding protein 4 |
| chr7_-_93280009 | 0.01 |
ENSRNOT00000064877
|
Samd12
|
sterile alpha motif domain containing 12 |
| chr2_+_198040536 | 0.01 |
ENSRNOT00000028744
|
Anp32e
|
acidic nuclear phosphoprotein 32 family member E |
| chr9_+_20251521 | 0.01 |
ENSRNOT00000005535
|
LOC100911625
|
gamma-enolase-like |
| chr17_-_55346279 | 0.01 |
ENSRNOT00000025037
|
Svil
|
supervillin |
| chr13_-_100928811 | 0.01 |
ENSRNOT00000045326
|
Capn2
|
calpain 2 |
| chr4_-_157294047 | 0.00 |
ENSRNOT00000005601
|
Eno2
|
enolase 2 |
| chr15_+_2526368 | 0.00 |
ENSRNOT00000048713
ENSRNOT00000074803 |
Dusp13
Dusp13
|
dual specificity phosphatase 13 dual specificity phosphatase 13 |
| chr4_+_78618737 | 0.00 |
ENSRNOT00000043790
|
Doxl2
|
diamine oxidase-like protein 2 |
| chr7_+_125576327 | 0.00 |
ENSRNOT00000016679
|
Prr5
|
proline rich 5 |
| chr18_+_81821127 | 0.00 |
ENSRNOT00000058199
|
Fbxo15
|
F-box protein 15 |
| chr11_-_83944763 | 0.00 |
ENSRNOT00000002358
|
Psmd2
|
proteasome 26S subunit, non-ATPase 2 |
| chr8_+_115193146 | 0.00 |
ENSRNOT00000056391
|
Iqcf1
|
IQ motif containing F1 |
| chr5_+_61425746 | 0.00 |
ENSRNOT00000064113
|
RGD1305807
|
hypothetical LOC298077 |
| chr5_+_161889342 | 0.00 |
ENSRNOT00000040481
|
LOC100362684
|
ribosomal protein S20-like |
| chr14_+_44889287 | 0.00 |
ENSRNOT00000091312
ENSRNOT00000032273 |
Tmem156
|
transmembrane protein 156 |
| chr16_-_21274688 | 0.00 |
ENSRNOT00000027953
|
Tssk6
|
testis-specific serine kinase 6 |
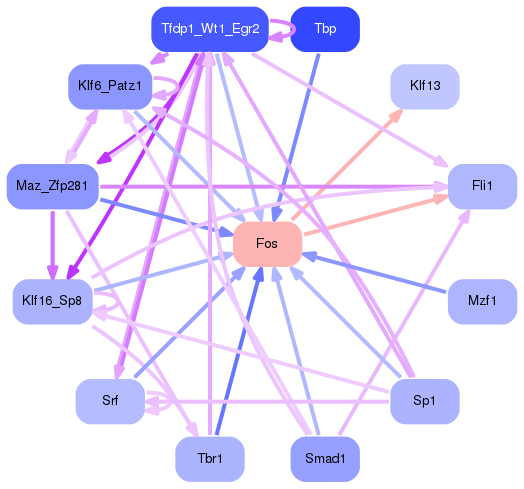
Network of associatons between targets according to the STRING database.

First level regulatory network of Fos
Gene Ontology Analysis
Gene overrepresentation in biological process category:
| Log-likelihood per target | Total log-likelihood | Term | Description |
|---|---|---|---|
| 0.1 | 0.3 | GO:1903575 | cornified envelope assembly(GO:1903575) |
| 0.1 | 0.3 | GO:0010037 | response to carbon dioxide(GO:0010037) |
| 0.0 | 0.2 | GO:2000851 | positive regulation of saliva secretion(GO:0046878) positive regulation of glucocorticoid secretion(GO:2000851) |
| 0.0 | 0.1 | GO:0061470 | T follicular helper cell differentiation(GO:0061470) |
| 0.0 | 0.2 | GO:0060315 | negative regulation of ryanodine-sensitive calcium-release channel activity(GO:0060315) |
| 0.0 | 0.1 | GO:0007296 | vitellogenesis(GO:0007296) |
| 0.0 | 0.1 | GO:1903660 | negative regulation of complement-dependent cytotoxicity(GO:1903660) |
| 0.0 | 0.1 | GO:1902748 | positive regulation of lens fiber cell differentiation(GO:1902748) |
| 0.0 | 0.1 | GO:2000525 | regulation of T cell costimulation(GO:2000523) positive regulation of T cell costimulation(GO:2000525) |
| 0.0 | 0.1 | GO:0000738 | DNA catabolic process, exonucleolytic(GO:0000738) |
| 0.0 | 0.1 | GO:0014722 | regulation of skeletal muscle contraction by calcium ion signaling(GO:0014722) |
| 0.0 | 0.1 | GO:2000675 | negative regulation of type B pancreatic cell apoptotic process(GO:2000675) |
| 0.0 | 0.1 | GO:0009609 | response to symbiotic bacterium(GO:0009609) |
| 0.0 | 0.1 | GO:0045658 | regulation of neutrophil differentiation(GO:0045658) |
| 0.0 | 0.1 | GO:0071733 | mitral valve formation(GO:0003192) transcriptional activation by promoter-enhancer looping(GO:0071733) gene looping(GO:0090202) dsDNA loop formation(GO:0090579) |
| 0.0 | 0.0 | GO:2000872 | positive regulation of progesterone secretion(GO:2000872) |
| 0.0 | 0.3 | GO:0032060 | bleb assembly(GO:0032060) |
| 0.0 | 0.0 | GO:0071387 | cellular response to cortisol stimulus(GO:0071387) |
| 0.0 | 0.1 | GO:0021797 | forebrain anterior/posterior pattern specification(GO:0021797) |
| 0.0 | 0.1 | GO:1902534 | single-organism membrane invagination(GO:1902534) |
| 0.0 | 0.0 | GO:2000660 | negative regulation of interleukin-1-mediated signaling pathway(GO:2000660) |
| 0.0 | 0.1 | GO:0019371 | cyclooxygenase pathway(GO:0019371) |
| 0.0 | 0.1 | GO:0046541 | saliva secretion(GO:0046541) positive regulation of T cell receptor signaling pathway(GO:0050862) |
| 0.0 | 0.2 | GO:0045647 | negative regulation of erythrocyte differentiation(GO:0045647) |
| 0.0 | 0.0 | GO:0007172 | signal complex assembly(GO:0007172) |
| 0.0 | 0.1 | GO:0045162 | clustering of voltage-gated sodium channels(GO:0045162) |
| 0.0 | 0.1 | GO:0002051 | osteoblast fate commitment(GO:0002051) |
| 0.0 | 0.1 | GO:0016024 | CDP-diacylglycerol biosynthetic process(GO:0016024) |
| 0.0 | 0.1 | GO:1903026 | negative regulation of RNA polymerase II regulatory region sequence-specific DNA binding(GO:1903026) |
Gene overrepresentation in cellular component category:
| Log-likelihood per target | Total log-likelihood | Term | Description |
|---|---|---|---|
| 0.1 | 0.2 | GO:0005607 | laminin-2 complex(GO:0005607) |
| 0.0 | 0.1 | GO:0034751 | aryl hydrocarbon receptor complex(GO:0034751) |
| 0.0 | 0.0 | GO:1990622 | CHOP-C/EBP complex(GO:0036488) CHOP-ATF3 complex(GO:1990622) |
| 0.0 | 0.2 | GO:0033180 | proton-transporting V-type ATPase, V1 domain(GO:0033180) |
| 0.0 | 0.1 | GO:0097413 | Lewy body(GO:0097413) |
| 0.0 | 0.1 | GO:0005796 | Golgi lumen(GO:0005796) |
Gene overrepresentation in molecular function category:
| Log-likelihood per target | Total log-likelihood | Term | Description |
|---|---|---|---|
| 0.0 | 0.1 | GO:0005163 | nerve growth factor receptor binding(GO:0005163) |
| 0.0 | 0.1 | GO:0002134 | UTP binding(GO:0002134) sulfonylurea receptor binding(GO:0017098) pyrimidine ribonucleoside binding(GO:0032551) |
| 0.0 | 0.1 | GO:0008481 | sphinganine kinase activity(GO:0008481) |
| 0.0 | 0.1 | GO:0016286 | small conductance calcium-activated potassium channel activity(GO:0016286) |
| 0.0 | 0.1 | GO:0004366 | glycerol-3-phosphate O-acyltransferase activity(GO:0004366) |
| 0.0 | 0.1 | GO:0015057 | thrombin receptor activity(GO:0015057) |
| 0.0 | 0.1 | GO:0045545 | syndecan binding(GO:0045545) |
| 0.0 | 0.2 | GO:0005247 | voltage-gated chloride channel activity(GO:0005247) |
| 0.0 | 0.3 | GO:0004602 | glutathione peroxidase activity(GO:0004602) |
| 0.0 | 0.3 | GO:0015106 | bicarbonate transmembrane transporter activity(GO:0015106) |
| 0.0 | 0.0 | GO:0019834 | phospholipase A2 inhibitor activity(GO:0019834) |
| 0.0 | 0.1 | GO:0008310 | single-stranded DNA 3'-5' exodeoxyribonuclease activity(GO:0008310) |
| 0.0 | 0.1 | GO:0086080 | protein binding involved in heterotypic cell-cell adhesion(GO:0086080) |
| 0.0 | 0.1 | GO:0048019 | receptor antagonist activity(GO:0048019) |
| 0.0 | 0.1 | GO:0086062 | voltage-gated sodium channel activity involved in Purkinje myocyte action potential(GO:0086062) |
Gene overrepresentation in curated gene sets: canonical pathways category:
| Log-likelihood per target | Total log-likelihood | Term | Description |
|---|---|---|---|
| 0.0 | 0.2 | PID INTEGRIN4 PATHWAY | Alpha6 beta4 integrin-ligand interactions |
Gene overrepresentation in curated gene sets: REACTOME pathways category:
| Log-likelihood per target | Total log-likelihood | Term | Description |
|---|---|---|---|
| 0.0 | 0.2 | REACTOME NFKB IS ACTIVATED AND SIGNALS SURVIVAL | Genes involved in NF-kB is activated and signals survival |