Project
GSE49485: Hypoxia transcriptome sequencing of rat brain.
Navigation
Downloads
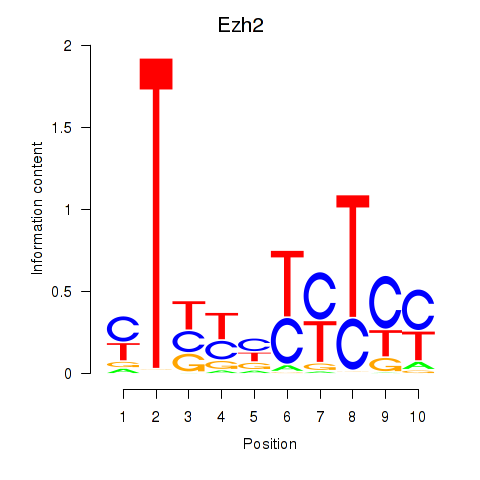
Results for Ezh2_Atf2_Ikzf1
Z-value: 0.49
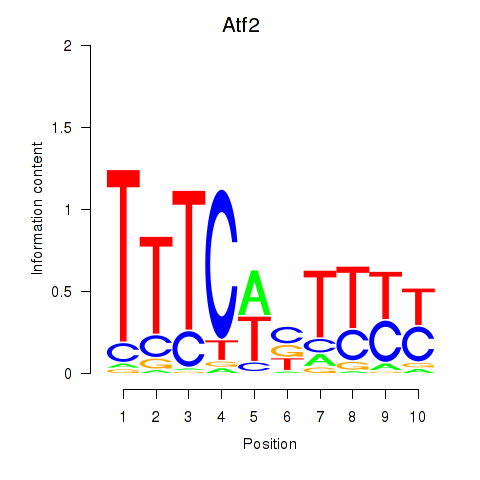
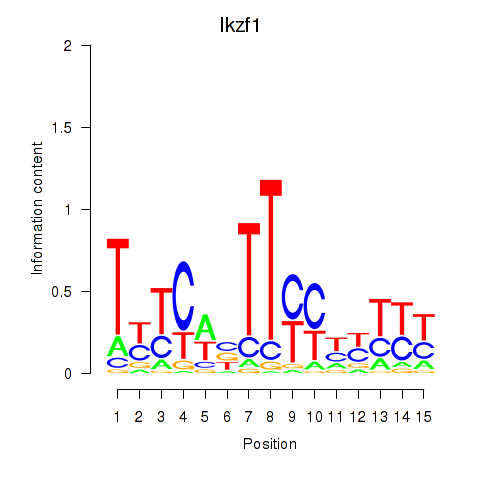
Motif logo
Transcription factors associated with Ezh2_Atf2_Ikzf1
| Gene Symbol | Gene ID | Gene Info |
|---|---|---|
|
Ezh2
|
ENSRNOG00000006048 | enhancer of zeste 2 polycomb repressive complex 2 subunit |
|
Atf2
|
ENSRNOG00000001597 | activating transcription factor 2 |
|
Ikzf1
|
ENSRNOG00000004444 | IKAROS family zinc finger 1 |
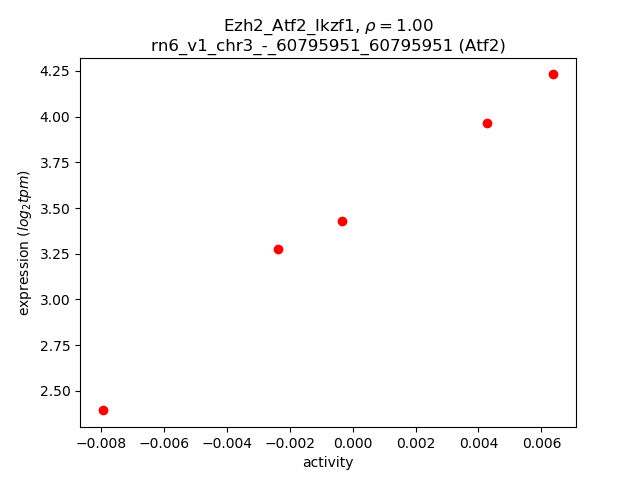
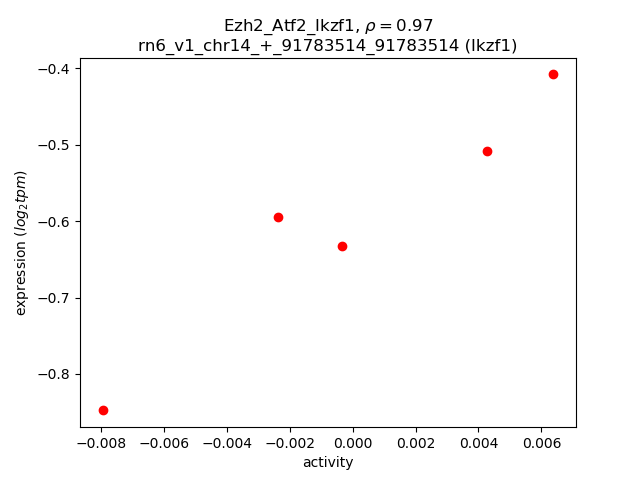
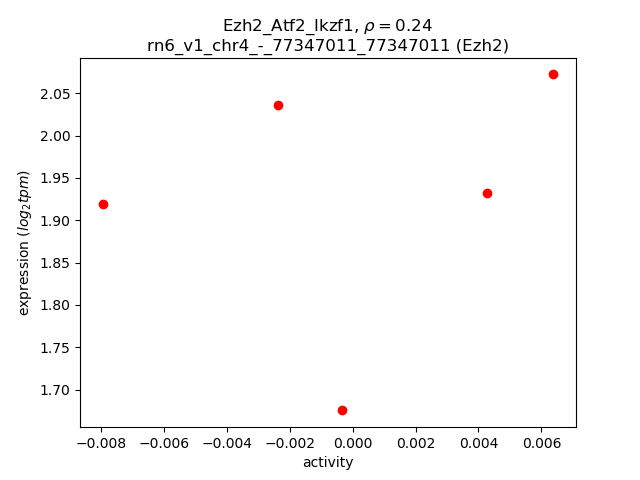
Activity-expression correlation:
| Gene | Promoter | Pearson corr. coef. | P-value | Plot |
|---|---|---|---|---|
| Atf2 | rn6_v1_chr3_-_60795951_60795951 | 1.00 | 3.7e-04 | Click! |
| Ikzf1 | rn6_v1_chr14_+_91783514_91783514 | 0.97 | 7.6e-03 | Click! |
| Ezh2 | rn6_v1_chr4_-_77347011_77347011 | 0.24 | 7.0e-01 | Click! |
Activity profile of Ezh2_Atf2_Ikzf1 motif
Sorted Z-values of Ezh2_Atf2_Ikzf1 motif
| Promoter | Log-likelihood | Transcript | Gene | Gene Info |
|---|---|---|---|---|
| chr3_+_58965552 | 0.27 |
ENSRNOT00000002068
|
Map3k20
|
mitogen-activated protein kinase kinase kinase 20 |
| chr12_-_10307265 | 0.23 |
ENSRNOT00000092627
|
Wasf3
|
WAS protein family, member 3 |
| chr1_-_43638161 | 0.23 |
ENSRNOT00000024460
|
Ipcef1
|
interaction protein for cytohesin exchange factors 1 |
| chr12_+_13810180 | 0.22 |
ENSRNOT00000084865
ENSRNOT00000038203 |
Tnrc18
|
trinucleotide repeat containing 18 |
| chr14_+_8080565 | 0.21 |
ENSRNOT00000092395
|
Mapk10
|
mitogen activated protein kinase 10 |
| chr15_-_110046687 | 0.21 |
ENSRNOT00000057404
ENSRNOT00000006624 ENSRNOT00000089695 |
Nalcn
|
sodium leak channel, non-selective |
| chr18_+_27558089 | 0.21 |
ENSRNOT00000027499
|
Fam53c
|
family with sequence similarity 53, member C |
| chr4_+_22859622 | 0.20 |
ENSRNOT00000073501
ENSRNOT00000068410 |
Adam22
|
ADAM metallopeptidase domain 22 |
| chr4_-_11497531 | 0.19 |
ENSRNOT00000078799
|
Magi2
|
membrane associated guanylate kinase, WW and PDZ domain containing 2 |
| chr10_+_47019326 | 0.19 |
ENSRNOT00000006984
|
Smcr8
|
Smith-Magenis syndrome chromosome region, candidate 8 |
| chr7_-_59587382 | 0.19 |
ENSRNOT00000091427
ENSRNOT00000066396 |
Cnot2
|
CCR4-NOT transcription complex, subunit 2 |
| chr9_+_82571269 | 0.18 |
ENSRNOT00000026941
|
Speg
|
SPEG complex locus |
| chr10_-_92476109 | 0.17 |
ENSRNOT00000089029
|
Kansl1
|
KAT8 regulatory NSL complex subunit 1 |
| chr15_-_54528480 | 0.16 |
ENSRNOT00000066888
|
Fndc3a
|
fibronectin type III domain containing 3a |
| chr16_-_6245644 | 0.15 |
ENSRNOT00000040759
|
Cacna1d
|
calcium voltage-gated channel subunit alpha1 D |
| chr2_-_157058194 | 0.15 |
ENSRNOT00000076409
|
Rn50_2_1765.1
|
|
| chr6_-_86713370 | 0.15 |
ENSRNOT00000005821
|
Klhl28
|
kelch-like family member 28 |
| chr7_+_123510804 | 0.15 |
ENSRNOT00000010491
|
Sept3
|
septin 3 |
| chr3_+_82548959 | 0.15 |
ENSRNOT00000000009
|
Alx4
|
ALX homeobox 4 |
| chr10_+_42614713 | 0.15 |
ENSRNOT00000081136
ENSRNOT00000073148 |
Gria1
|
glutamate ionotropic receptor AMPA type subunit 1 |
| chr18_+_30562178 | 0.14 |
ENSRNOT00000040998
|
LOC108348771
|
protocadherin beta-16-like |
| chr16_-_20097287 | 0.14 |
ENSRNOT00000025162
|
Unc13a
|
unc-13 homolog A |
| chr12_+_21767606 | 0.14 |
ENSRNOT00000059602
|
LOC103691013
|
neuronal tyrosine-phosphorylated phosphoinositide-3-kinase adapter 1-like |
| chr14_+_109533792 | 0.14 |
ENSRNOT00000067690
|
LOC108348154
|
ankyrin repeat domain-containing protein 29-like |
| chr14_-_84751886 | 0.13 |
ENSRNOT00000078838
|
Mtmr3
|
myotubularin related protein 3 |
| chr10_+_47018974 | 0.13 |
ENSRNOT00000079375
|
Smcr8
|
Smith-Magenis syndrome chromosome region, candidate 8 |
| chr7_+_119820537 | 0.13 |
ENSRNOT00000077256
ENSRNOT00000056221 |
Cyth4
|
cytohesin 4 |
| chr20_-_19637958 | 0.13 |
ENSRNOT00000074657
|
Slc16a9
|
solute carrier family 16 (monocarboxylic acid transporters), member 9 |
| chr1_+_187149453 | 0.13 |
ENSRNOT00000082738
|
Xylt1
|
xylosyltransferase 1 |
| chr6_-_147172022 | 0.13 |
ENSRNOT00000080675
|
Itgb8
|
integrin subunit beta 8 |
| chr17_+_85364483 | 0.13 |
ENSRNOT00000064257
|
Bmi1
|
BMI1 proto-oncogene, polycomb ring finger |
| chr3_-_72052990 | 0.13 |
ENSRNOT00000064009
ENSRNOT00000081400 |
Ctnnd1
|
catenin delta 1 |
| chr1_-_101323960 | 0.13 |
ENSRNOT00000041513
|
Trpm4
|
transient receptor potential cation channel, subfamily M, member 4 |
| chr3_-_113312127 | 0.12 |
ENSRNOT00000065285
|
Mfap1a
|
microfibrillar-associated protein 1A |
| chr11_+_69484293 | 0.12 |
ENSRNOT00000049292
|
Kalrn
|
kalirin, RhoGEF kinase |
| chr1_+_101517714 | 0.12 |
ENSRNOT00000028423
|
Plekha4
|
pleckstrin homology domain containing A4 |
| chr2_+_201289357 | 0.12 |
ENSRNOT00000067358
|
Tbx15
|
T-box 15 |
| chr6_+_86713803 | 0.12 |
ENSRNOT00000005861
|
Fam179b
|
family with sequence similarity 179, member B |
| chrX_-_19386541 | 0.11 |
ENSRNOT00000072722
|
AABR07037356.1
|
|
| chr15_-_33250546 | 0.11 |
ENSRNOT00000017857
|
RGD1565222
|
similar to RIKEN cDNA 4931414P19 |
| chr3_+_71114100 | 0.11 |
ENSRNOT00000088549
ENSRNOT00000006961 |
Itgav
|
integrin subunit alpha V |
| chr15_-_43542939 | 0.11 |
ENSRNOT00000012996
|
Dpysl2
|
dihydropyrimidinase-like 2 |
| chr5_-_58469399 | 0.11 |
ENSRNOT00000013213
|
Pigo
|
phosphatidylinositol glycan anchor biosynthesis, class O |
| chr2_+_122368265 | 0.11 |
ENSRNOT00000078321
|
Atp11b
|
ATPase phospholipid transporting 11B (putative) |
| chr18_-_75207306 | 0.11 |
ENSRNOT00000021717
|
Setbp1
|
SET binding protein 1 |
| chr1_+_166125474 | 0.11 |
ENSRNOT00000091822
|
Fchsd2
|
FCH and double SH3 domains 2 |
| chr10_+_35343189 | 0.11 |
ENSRNOT00000083688
|
Mapk9
|
mitogen-activated protein kinase 9 |
| chr4_-_16654811 | 0.11 |
ENSRNOT00000008637
|
Pclo
|
piccolo (presynaptic cytomatrix protein) |
| chr9_-_63637677 | 0.10 |
ENSRNOT00000049259
|
Satb2
|
SATB homeobox 2 |
| chrX_-_116792707 | 0.10 |
ENSRNOT00000049482
|
Amot
|
angiomotin |
| chr3_+_161149935 | 0.10 |
ENSRNOT00000073626
|
Wfdc13
|
WAP four-disulfide core domain 13 |
| chrX_-_26376467 | 0.10 |
ENSRNOT00000051655
ENSRNOT00000036502 |
Arhgap6
|
Rho GTPase activating protein 6 |
| chr17_-_10766253 | 0.10 |
ENSRNOT00000000117
|
Cplx2
|
complexin 2 |
| chr8_+_12160067 | 0.10 |
ENSRNOT00000036338
|
Maml2
|
mastermind-like transcriptional coactivator 2 |
| chrX_-_152642531 | 0.10 |
ENSRNOT00000085037
|
Gabra3
|
gamma-aminobutyric acid type A receptor alpha3 subunit |
| chr9_+_73433252 | 0.10 |
ENSRNOT00000092540
|
Map2
|
microtubule-associated protein 2 |
| chr4_+_51614676 | 0.10 |
ENSRNOT00000060494
|
Asb15
|
ankyrin repeat and SOCS box containing 15 |
| chr17_+_81922329 | 0.10 |
ENSRNOT00000031542
|
Cacnb2
|
calcium voltage-gated channel auxiliary subunit beta 2 |
| chr18_-_18079560 | 0.10 |
ENSRNOT00000072093
|
AABR07031533.1
|
|
| chr5_+_167141875 | 0.09 |
ENSRNOT00000089314
|
Slc2a5
|
solute carrier family 2 member 5 |
| chr3_+_7035169 | 0.09 |
ENSRNOT00000036601
|
Ppp1r26
|
protein phosphatase 1, regulatory subunit 26 |
| chr9_+_118849302 | 0.09 |
ENSRNOT00000087592
|
Dlgap1
|
DLG associated protein 1 |
| chr14_-_5006594 | 0.09 |
ENSRNOT00000076571
|
Zfp326
|
zinc finger protein 326 |
| chr2_+_207930796 | 0.09 |
ENSRNOT00000047827
|
Kcnd3
|
potassium voltage-gated channel subfamily D member 3 |
| chr3_+_103773459 | 0.09 |
ENSRNOT00000079727
|
Slc12a6
|
solute carrier family 12, member 6 |
| chr15_-_24056073 | 0.09 |
ENSRNOT00000015100
|
Wdhd1
|
WD repeat and HMG-box DNA binding protein 1 |
| chr10_+_42618487 | 0.09 |
ENSRNOT00000071615
|
Gria1
|
glutamate ionotropic receptor AMPA type subunit 1 |
| chr1_-_49844547 | 0.09 |
ENSRNOT00000086127
ENSRNOT00000077423 ENSRNOT00000089439 ENSRNOT00000090521 |
AABR07001519.1
|
|
| chr17_+_9236249 | 0.09 |
ENSRNOT00000015878
|
Tifab
|
TIFA inhibitor |
| chr3_-_7796385 | 0.09 |
ENSRNOT00000082489
|
Ntng2
|
netrin G2 |
| chr15_-_48445588 | 0.09 |
ENSRNOT00000077197
ENSRNOT00000018583 |
Extl3
|
exostosin-like glycosyltransferase 3 |
| chr5_-_158439078 | 0.09 |
ENSRNOT00000025517
|
Klhdc7a
|
kelch domain containing 7A |
| chrX_+_159081445 | 0.09 |
ENSRNOT00000056688
|
AABR07042542.1
|
|
| chr9_+_60039297 | 0.09 |
ENSRNOT00000016262
|
Slc39a10
|
solute carrier family 39 member 10 |
| chr2_+_36246628 | 0.08 |
ENSRNOT00000013618
|
Htr1a
|
5-hydroxytryptamine receptor 1A |
| chr4_+_163358009 | 0.08 |
ENSRNOT00000082064
|
Klrd1
|
killer cell lectin like receptor D1 |
| chr3_-_72113680 | 0.08 |
ENSRNOT00000009708
|
Zdhhc5
|
zinc finger, DHHC-type containing 5 |
| chr18_+_29966245 | 0.08 |
ENSRNOT00000074028
|
Pcdha4
|
protocadherin alpha 4 |
| chr5_+_90818736 | 0.08 |
ENSRNOT00000093480
ENSRNOT00000009083 |
Kdm4c
|
lysine demethylase 4C |
| chr1_-_126211439 | 0.08 |
ENSRNOT00000014988
|
Tjp1
|
tight junction protein 1 |
| chr4_-_155563249 | 0.08 |
ENSRNOT00000011298
|
Slc2a3
|
solute carrier family 2 member 3 |
| chr4_+_6282278 | 0.08 |
ENSRNOT00000010349
|
Kmt2c
|
lysine methyltransferase 2C |
| chr19_-_52186260 | 0.08 |
ENSRNOT00000020838
|
Mbtps1
|
membrane-bound transcription factor peptidase, site 1 |
| chr10_-_65963932 | 0.08 |
ENSRNOT00000011726
|
Nlk
|
nemo like kinase |
| chr6_-_4520604 | 0.08 |
ENSRNOT00000042230
ENSRNOT00000043870 ENSRNOT00000070918 ENSRNOT00000046246 ENSRNOT00000052367 ENSRNOT00000042251 |
Slc8a1
|
solute carrier family 8 member A1 |
| chr2_+_150756185 | 0.08 |
ENSRNOT00000088461
ENSRNOT00000036808 |
Mbnl1
|
muscleblind-like splicing regulator 1 |
| chr18_-_38088457 | 0.08 |
ENSRNOT00000077814
|
Jakmip2
|
janus kinase and microtubule interacting protein 2 |
| chr18_+_30954609 | 0.08 |
ENSRNOT00000086893
|
Pcdhgc3
|
protocadherin gamma subfamily C, 3 |
| chr10_-_27179254 | 0.08 |
ENSRNOT00000004619
|
Gabrg2
|
gamma-aminobutyric acid type A receptor gamma 2 subunit |
| chrX_+_62363757 | 0.08 |
ENSRNOT00000091240
|
Arx
|
aristaless related homeobox |
| chr6_+_64252970 | 0.08 |
ENSRNOT00000093700
|
Pnpla8
|
patatin-like phospholipase domain containing 8 |
| chr15_-_77736892 | 0.08 |
ENSRNOT00000057924
|
Pcdh9
|
protocadherin 9 |
| chr5_-_168734296 | 0.08 |
ENSRNOT00000066120
|
Camta1
|
calmodulin binding transcription activator 1 |
| chr2_+_186980992 | 0.08 |
ENSRNOT00000020717
|
Arhgef11
|
Rho guanine nucleotide exchange factor 11 |
| chr9_-_66033871 | 0.08 |
ENSRNOT00000035209
|
Als2
|
ALS2, alsin Rho guanine nucleotide exchange factor |
| chr20_+_3823596 | 0.08 |
ENSRNOT00000087670
|
Rxrb
|
retinoid X receptor beta |
| chr3_+_8192575 | 0.08 |
ENSRNOT00000060977
|
Rapgef1
|
Rap guanine nucleotide exchange factor 1 |
| chr17_-_58292624 | 0.08 |
ENSRNOT00000047512
|
Adarb2
|
adenosine deaminase, RNA-specific, B2 |
| chr2_+_266315036 | 0.08 |
ENSRNOT00000055245
|
Wls
|
wntless Wnt ligand secretion mediator |
| chr14_-_13058172 | 0.08 |
ENSRNOT00000002746
ENSRNOT00000071706 |
Prdm8
|
PR/SET domain 8 |
| chr3_+_131351587 | 0.08 |
ENSRNOT00000010835
|
Btbd3
|
BTB domain containing 3 |
| chr3_-_64554953 | 0.08 |
ENSRNOT00000067452
|
LOC102553814
|
serine/arginine repetitive matrix protein 1-like |
| chr7_-_120770435 | 0.07 |
ENSRNOT00000077000
|
Ddx17
|
DEAD-box helicase 17 |
| chr20_-_5485837 | 0.07 |
ENSRNOT00000092272
ENSRNOT00000000559 ENSRNOT00000092597 |
Daxx
|
death-domain associated protein |
| chrX_+_62363953 | 0.07 |
ENSRNOT00000083362
|
Arx
|
aristaless related homeobox |
| chr20_-_6548179 | 0.07 |
ENSRNOT00000093711
|
Lemd2
|
LEM domain containing 2 |
| chrX_+_80213332 | 0.07 |
ENSRNOT00000042827
|
Sh3bgrl
|
SH3 domain binding glutamate-rich protein like |
| chr20_-_3793985 | 0.07 |
ENSRNOT00000049540
ENSRNOT00000086293 |
RT1-CE16
|
RT1 class I, locus CE16 |
| chr9_-_43022998 | 0.07 |
ENSRNOT00000063781
ENSRNOT00000089843 |
Lman2l
|
lectin, mannose-binding 2-like |
| chr20_-_31956649 | 0.07 |
ENSRNOT00000072429
|
Hk1
|
hexokinase 1 |
| chr4_-_22424862 | 0.07 |
ENSRNOT00000082359
|
Abcb1a
|
ATP binding cassette subfamily B member 1A |
| chr18_+_30885789 | 0.07 |
ENSRNOT00000044434
|
Pcdhga9
|
protocadherin gamma subfamily A, 9 |
| chr6_+_86713604 | 0.07 |
ENSRNOT00000059271
|
Fam179b
|
family with sequence similarity 179, member B |
| chr1_+_199037544 | 0.07 |
ENSRNOT00000025499
|
Rnf40
|
ring finger protein 40 |
| chr10_-_103685844 | 0.07 |
ENSRNOT00000064284
|
Cd300lf
|
Cd300 molecule-like family member F |
| chr8_-_13906355 | 0.07 |
ENSRNOT00000029634
|
Cep295
|
centrosomal protein 295 |
| chr17_+_60059949 | 0.07 |
ENSRNOT00000025458
|
Mpp7
|
membrane palmitoylated protein 7 |
| chr13_+_57131395 | 0.07 |
ENSRNOT00000017884
|
Kcnt2
|
potassium sodium-activated channel subfamily T member 2 |
| chrX_-_29648359 | 0.07 |
ENSRNOT00000086721
ENSRNOT00000006777 |
Gpm6b
|
glycoprotein m6b |
| chr13_+_50196042 | 0.07 |
ENSRNOT00000090858
|
Zc3h11a
|
zinc finger CCCH-type containing 11A |
| chr8_-_39093277 | 0.07 |
ENSRNOT00000043344
|
LOC100911068
|
roundabout homolog 4-like |
| chr12_-_44381289 | 0.07 |
ENSRNOT00000001493
|
Nos1
|
nitric oxide synthase 1 |
| chr3_+_139695028 | 0.07 |
ENSRNOT00000089098
|
Slc24a3
|
solute carrier family 24 member 3 |
| chr18_-_32670665 | 0.07 |
ENSRNOT00000019409
|
Nr3c1
|
nuclear receptor subfamily 3, group C, member 1 |
| chr15_-_88036354 | 0.07 |
ENSRNOT00000014747
|
Ednrb
|
endothelin receptor type B |
| chr7_-_104749552 | 0.07 |
ENSRNOT00000079981
|
Asap1
|
ArfGAP with SH3 domain, ankyrin repeat and PH domain 1 |
| chr2_+_104744461 | 0.07 |
ENSRNOT00000016083
ENSRNOT00000082627 |
Cp
|
ceruloplasmin |
| chr16_-_10296341 | 0.07 |
ENSRNOT00000083990
|
Zfp488
|
zinc finger protein 488 |
| chr2_+_144191846 | 0.07 |
ENSRNOT00000000102
|
Smad9
|
SMAD family member 9 |
| chr17_-_1093873 | 0.07 |
ENSRNOT00000086130
|
Ptch1
|
patched 1 |
| chr15_-_23606634 | 0.07 |
ENSRNOT00000075602
|
Gmfb
|
glia maturation factor, beta |
| chr5_+_64566804 | 0.07 |
ENSRNOT00000073192
|
LOC103690035
|
TGF-beta receptor type-1-like |
| chr8_-_116893057 | 0.07 |
ENSRNOT00000082113
|
Bsn
|
bassoon (presynaptic cytomatrix protein) |
| chr14_+_79205466 | 0.06 |
ENSRNOT00000085534
|
Tbc1d14
|
TBC1 domain family, member 14 |
| chr18_+_30831365 | 0.06 |
ENSRNOT00000067185
|
Pcdhga4
|
protocadherin gamma subfamily A, 4 |
| chr20_+_6211420 | 0.06 |
ENSRNOT00000000624
|
Kctd20
|
potassium channel tetramerization domain containing 20 |
| chr2_+_185590986 | 0.06 |
ENSRNOT00000088807
ENSRNOT00000088188 |
Lrba
|
LPS responsive beige-like anchor protein |
| chr1_-_80471527 | 0.06 |
ENSRNOT00000023867
|
Ppp1r37
|
protein phosphatase 1, regulatory subunit 37 |
| chr10_-_36419926 | 0.06 |
ENSRNOT00000004902
|
Znf354b
|
zinc finger protein 354B |
| chr1_-_73732118 | 0.06 |
ENSRNOT00000077964
|
Leng8
|
leukocyte receptor cluster member 8 |
| chr4_-_157155609 | 0.06 |
ENSRNOT00000016330
|
C1s
|
complement C1s |
| chr5_-_152762165 | 0.06 |
ENSRNOT00000022921
|
Selenon
|
selenoprotein N |
| chr1_+_100593892 | 0.06 |
ENSRNOT00000027062
|
Kcnc3
|
potassium voltage-gated channel subfamily C member 3 |
| chr10_-_42928461 | 0.06 |
ENSRNOT00000058619
|
Fam114a2
|
family with sequence similarity 114, member A2 |
| chr1_-_92119951 | 0.06 |
ENSRNOT00000018153
ENSRNOT00000092121 |
Zfp507
|
zinc finger protein 507 |
| chr11_-_62451149 | 0.06 |
ENSRNOT00000093686
ENSRNOT00000081443 |
Zbtb20
|
zinc finger and BTB domain containing 20 |
| chr1_-_4011161 | 0.06 |
ENSRNOT00000044778
|
Stxbp5
|
syntaxin binding protein 5 |
| chr1_+_25174456 | 0.06 |
ENSRNOT00000092830
|
Clvs2
|
clavesin 2 |
| chr18_+_30913842 | 0.06 |
ENSRNOT00000026947
|
Pcdhgc3
|
protocadherin gamma subfamily C, 3 |
| chr12_+_6403940 | 0.06 |
ENSRNOT00000083484
|
B3glct
|
beta 3-glucosyltransferase |
| chr7_-_50638798 | 0.06 |
ENSRNOT00000048880
|
Syt1
|
synaptotagmin 1 |
| chr13_+_46169963 | 0.06 |
ENSRNOT00000005212
|
Thsd7b
|
thrombospondin type 1 domain containing 7B |
| chr2_-_173087648 | 0.06 |
ENSRNOT00000091079
|
Iqcj
|
IQ motif containing J |
| chr13_+_52667969 | 0.06 |
ENSRNOT00000084986
ENSRNOT00000050284 |
Tnnt2
|
troponin T2, cardiac type |
| chr3_-_3855391 | 0.06 |
ENSRNOT00000025764
|
Inpp5e
|
inositol polyphosphate-5-phosphatase E |
| chr13_+_34365147 | 0.06 |
ENSRNOT00000093066
|
Clasp1
|
cytoplasmic linker associated protein 1 |
| chr17_-_1085885 | 0.06 |
ENSRNOT00000026287
|
Ptch1
|
patched 1 |
| chr1_-_219388009 | 0.06 |
ENSRNOT00000001550
|
Cabp4
|
calcium binding protein 4 |
| chr7_+_70753101 | 0.06 |
ENSRNOT00000090001
|
R3hdm2
|
R3H domain containing 2 |
| chr7_+_144503534 | 0.06 |
ENSRNOT00000021543
|
Tbca
|
tubulin folding cofactor A |
| chr2_-_210454737 | 0.05 |
ENSRNOT00000079993
|
Ahcyl1
|
adenosylhomocysteinase-like 1 |
| chr1_-_201906286 | 0.05 |
ENSRNOT00000064511
ENSRNOT00000036625 |
RGD1560958
|
similar to RIKEN cDNA 1700063I17 |
| chr18_-_77317969 | 0.05 |
ENSRNOT00000090369
|
Nfatc1
|
nuclear factor of activated T-cells 1 |
| chr4_+_168599331 | 0.05 |
ENSRNOT00000086719
|
Crebl2
|
cAMP responsive element binding protein-like 2 |
| chr8_+_102304095 | 0.05 |
ENSRNOT00000011358
|
Slc9a9
|
solute carrier family 9 member A9 |
| chr1_+_234252757 | 0.05 |
ENSRNOT00000091814
|
Rorb
|
RAR-related orphan receptor B |
| chr1_+_166478005 | 0.05 |
ENSRNOT00000030037
|
Arap1
|
ArfGAP with RhoGAP domain, ankyrin repeat and PH domain 1 |
| chr12_-_17311112 | 0.05 |
ENSRNOT00000001732
|
Gper1
|
G protein-coupled estrogen receptor 1 |
| chr6_+_64789940 | 0.05 |
ENSRNOT00000085979
ENSRNOT00000059739 ENSRNOT00000051908 ENSRNOT00000082793 ENSRNOT00000078583 ENSRNOT00000091677 ENSRNOT00000093241 |
Nrcam
|
neuronal cell adhesion molecule |
| chr2_+_186980793 | 0.05 |
ENSRNOT00000091336
|
Arhgef11
|
Rho guanine nucleotide exchange factor 11 |
| chr1_+_128924966 | 0.05 |
ENSRNOT00000019267
|
Igf1r
|
insulin-like growth factor 1 receptor |
| chr2_+_188141350 | 0.05 |
ENSRNOT00000078913
|
Gon4l
|
gon-4 like |
| chr19_-_58735173 | 0.05 |
ENSRNOT00000030077
|
Pcnx2
|
pecanex homolog 2 (Drosophila) |
| chr2_+_219628695 | 0.05 |
ENSRNOT00000067324
|
Sass6
|
SAS-6 centriolar assembly protein |
| chr20_+_20105047 | 0.05 |
ENSRNOT00000082181
|
Ank3
|
ankyrin 3 |
| chr15_+_120372 | 0.05 |
ENSRNOT00000007828
|
Dlg5
|
discs large MAGUK scaffold protein 5 |
| chr16_+_2743823 | 0.05 |
ENSRNOT00000087873
|
Arhgef3
|
Rho guanine nucleotide exchange factor 3 |
| chr1_+_87697005 | 0.05 |
ENSRNOT00000028158
|
Zfp84
|
zinc finger protein 84 |
| chrX_+_53360839 | 0.05 |
ENSRNOT00000091467
ENSRNOT00000034372 ENSRNOT00000081061 |
Dmd
|
dystrophin |
| chr18_+_55505993 | 0.05 |
ENSRNOT00000043736
|
RGD1309362
|
similar to interferon-inducible GTPase |
| chr14_+_63095720 | 0.05 |
ENSRNOT00000006071
|
Ppargc1a
|
PPARG coactivator 1 alpha |
| chrX_+_71155601 | 0.05 |
ENSRNOT00000076453
ENSRNOT00000048521 |
Foxo4
|
forkhead box O4 |
| chr18_+_56379890 | 0.05 |
ENSRNOT00000078764
|
Pdgfrb
|
platelet derived growth factor receptor beta |
| chr7_+_73273985 | 0.05 |
ENSRNOT00000077730
|
Pop1
|
POP1 homolog, ribonuclease P/MRP subunit |
| chr18_+_1723565 | 0.05 |
ENSRNOT00000033468
|
Greb1l
|
growth regulation by estrogen in breast cancer 1 like |
| chr5_-_147886615 | 0.05 |
ENSRNOT00000087556
|
Kpna6
|
karyopherin subunit alpha 6 |
| chr2_-_189400323 | 0.05 |
ENSRNOT00000024364
|
Ubap2l
|
ubiquitin associated protein 2-like |
| chr10_-_85435016 | 0.05 |
ENSRNOT00000079921
|
4933428G20Rik
|
RIKEN cDNA 4933428G20 gene |
| chr3_-_111354419 | 0.05 |
ENSRNOT00000038365
|
Exd1
|
exonuclease 3'-5' domain containing 1 |
| chr12_-_11175917 | 0.05 |
ENSRNOT00000079573
|
Zkscan5
|
zinc finger with KRAB and SCAN domains 5 |
| chrX_+_68771100 | 0.05 |
ENSRNOT00000043872
|
Stard8
|
StAR-related lipid transfer domain containing 8 |
| chr17_+_70262363 | 0.05 |
ENSRNOT00000048933
|
Fam208b
|
family with sequence similarity 208, member B |
| chr1_+_87563975 | 0.05 |
ENSRNOT00000088772
|
Zfp30
|
zinc finger protein 30 |
| chr17_+_49417067 | 0.05 |
ENSRNOT00000090024
|
Pou6f2
|
POU domain, class 6, transcription factor 2 |
| chr6_+_27887797 | 0.05 |
ENSRNOT00000015827
|
Asxl2
|
additional sex combs like 2, transcriptional regulator |
| chr10_-_73690860 | 0.05 |
ENSRNOT00000004876
ENSRNOT00000075843 |
Ints2
|
integrator complex subunit 2 |
| chr1_+_277459200 | 0.05 |
ENSRNOT00000086008
|
AABR07007023.1
|
|
| chr1_+_199323628 | 0.05 |
ENSRNOT00000036187
|
Zfp646
|
zinc finger protein 646 |
| chr6_-_76608864 | 0.05 |
ENSRNOT00000010824
|
Ralgapa1
|
Ral GTPase activating protein catalytic alpha subunit 1 |
| chr9_+_71915421 | 0.05 |
ENSRNOT00000020447
|
Pikfyve
|
phosphoinositide kinase, FYVE-type zinc finger containing |
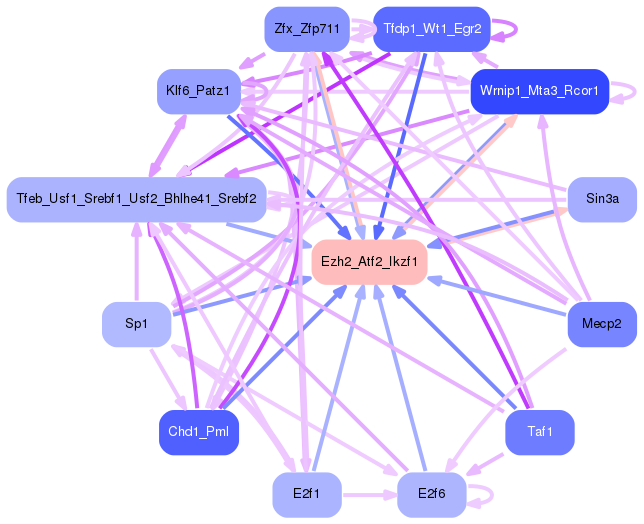
Network of associatons between targets according to the STRING database.

First level regulatory network of Ezh2_Atf2_Ikzf1
Gene Ontology Analysis
Gene overrepresentation in biological process category:
| Log-likelihood per target | Total log-likelihood | Term | Description |
|---|---|---|---|
| 0.0 | 0.3 | GO:1901098 | positive regulation of autophagosome maturation(GO:1901098) |
| 0.0 | 0.1 | GO:1903116 | positive regulation of actin filament-based movement(GO:1903116) |
| 0.0 | 0.1 | GO:0021997 | epidermal cell fate specification(GO:0009957) neural plate axis specification(GO:0021997) |
| 0.0 | 0.2 | GO:0098735 | positive regulation of the force of heart contraction(GO:0098735) |
| 0.0 | 0.2 | GO:0099566 | regulation of postsynaptic cytosolic calcium ion concentration(GO:0099566) |
| 0.0 | 0.2 | GO:0098928 | presynaptic signal transduction(GO:0098928) presynapse to nucleus signaling pathway(GO:0099526) |
| 0.0 | 0.1 | GO:1904879 | positive regulation of calcium ion transmembrane transport via high voltage-gated calcium channel(GO:1904879) |
| 0.0 | 0.4 | GO:0007258 | JUN phosphorylation(GO:0007258) |
| 0.0 | 0.2 | GO:0033092 | positive regulation of immature T cell proliferation in thymus(GO:0033092) |
| 0.0 | 0.1 | GO:0003365 | establishment of cell polarity involved in ameboidal cell migration(GO:0003365) |
| 0.0 | 0.1 | GO:0098989 | NMDA selective glutamate receptor signaling pathway(GO:0098989) |
| 0.0 | 0.1 | GO:0042539 | hypotonic salinity response(GO:0042539) cellular hypotonic salinity response(GO:0071477) |
| 0.0 | 0.1 | GO:0071896 | protein localization to adherens junction(GO:0071896) |
| 0.0 | 0.2 | GO:0071332 | cellular response to fructose stimulus(GO:0071332) |
| 0.0 | 0.1 | GO:0007356 | thorax and anterior abdomen determination(GO:0007356) |
| 0.0 | 0.2 | GO:0097118 | neuroligin clustering involved in postsynaptic membrane assembly(GO:0097118) |
| 0.0 | 0.1 | GO:0003220 | left ventricular cardiac muscle tissue morphogenesis(GO:0003220) |
| 0.0 | 0.2 | GO:0010606 | positive regulation of cytoplasmic mRNA processing body assembly(GO:0010606) |
| 0.0 | 0.1 | GO:0045715 | negative regulation of low-density lipoprotein particle receptor biosynthetic process(GO:0045715) |
| 0.0 | 0.2 | GO:0099525 | presynaptic dense core granule exocytosis(GO:0099525) |
| 0.0 | 0.1 | GO:0060689 | cell differentiation involved in salivary gland development(GO:0060689) |
| 0.0 | 0.2 | GO:0021759 | globus pallidus development(GO:0021759) |
| 0.0 | 0.1 | GO:0061357 | positive regulation of Wnt protein secretion(GO:0061357) |
| 0.0 | 0.2 | GO:0060075 | regulation of resting membrane potential(GO:0060075) |
| 0.0 | 0.1 | GO:0071454 | cellular response to anoxia(GO:0071454) |
| 0.0 | 0.1 | GO:2000426 | regulation of interleukin-4-mediated signaling pathway(GO:1902214) negative regulation of apoptotic cell clearance(GO:2000426) |
| 0.0 | 0.1 | GO:0051581 | negative regulation of neurotransmitter uptake(GO:0051581) regulation of serotonin uptake(GO:0051611) negative regulation of serotonin uptake(GO:0051612) |
| 0.0 | 0.1 | GO:0014873 | response to muscle activity involved in regulation of muscle adaptation(GO:0014873) |
| 0.0 | 0.1 | GO:0046338 | phosphatidylethanolamine catabolic process(GO:0046338) |
| 0.0 | 0.1 | GO:0007221 | positive regulation of transcription of Notch receptor target(GO:0007221) |
| 0.0 | 0.1 | GO:0035441 | cell migration involved in vasculogenesis(GO:0035441) |
| 0.0 | 0.1 | GO:0032972 | regulation of muscle filament sliding speed(GO:0032972) |
| 0.0 | 0.1 | GO:0008594 | photoreceptor cell morphogenesis(GO:0008594) |
| 0.0 | 0.1 | GO:1905235 | carbohydrate export(GO:0033231) daunorubicin transport(GO:0043215) response to borneol(GO:1905230) cellular response to borneol(GO:1905231) response to codeine(GO:1905233) response to quercetin(GO:1905235) drug transport across blood-brain barrier(GO:1990962) establishment of blood-retinal barrier(GO:1990963) |
| 0.0 | 0.1 | GO:0014043 | negative regulation of neuron maturation(GO:0014043) |
| 0.0 | 0.1 | GO:2001168 | regulation of histone H2B ubiquitination(GO:2001166) positive regulation of histone H2B ubiquitination(GO:2001168) |
| 0.0 | 0.1 | GO:0031959 | mineralocorticoid receptor signaling pathway(GO:0031959) |
| 0.0 | 0.1 | GO:1903943 | regulation of hepatocyte apoptotic process(GO:1903943) negative regulation of hepatocyte apoptotic process(GO:1903944) |
| 0.0 | 0.1 | GO:1900170 | negative regulation of glucocorticoid mediated signaling pathway(GO:1900170) |
| 0.0 | 0.1 | GO:0016203 | muscle attachment(GO:0016203) olfactory nerve morphogenesis(GO:0021627) olfactory nerve structural organization(GO:0021629) |
| 0.0 | 0.2 | GO:0031507 | heterochromatin assembly(GO:0031507) |
| 0.0 | 0.2 | GO:0086046 | membrane depolarization during SA node cell action potential(GO:0086046) |
| 0.0 | 0.0 | GO:0061443 | endocardial cushion cell differentiation(GO:0061443) |
| 0.0 | 0.1 | GO:0001880 | Mullerian duct regression(GO:0001880) |
| 0.0 | 0.0 | GO:0030997 | regulation of centriole-centriole cohesion(GO:0030997) |
| 0.0 | 0.0 | GO:0019086 | late viral transcription(GO:0019086) |
| 0.0 | 0.2 | GO:0031915 | positive regulation of synaptic plasticity(GO:0031915) |
| 0.0 | 0.0 | GO:1904708 | granulosa cell apoptotic process(GO:1904700) regulation of granulosa cell apoptotic process(GO:1904708) |
| 0.0 | 0.1 | GO:0007198 | adenylate cyclase-inhibiting serotonin receptor signaling pathway(GO:0007198) |
| 0.0 | 0.0 | GO:0015675 | nickel cation transport(GO:0015675) vanadium ion transport(GO:0015676) lead ion transport(GO:0015692) nickel cation transmembrane transport(GO:0035444) |
| 0.0 | 0.1 | GO:0070828 | heterochromatin organization(GO:0070828) |
| 0.0 | 0.0 | GO:0090164 | asymmetric Golgi ribbon formation(GO:0090164) |
| 0.0 | 0.1 | GO:0051595 | response to methylglyoxal(GO:0051595) |
| 0.0 | 0.1 | GO:0015679 | plasma membrane copper ion transport(GO:0015679) |
| 0.0 | 0.1 | GO:0070842 | aggresome assembly(GO:0070842) |
| 0.0 | 0.1 | GO:0034316 | negative regulation of Arp2/3 complex-mediated actin nucleation(GO:0034316) |
| 0.0 | 0.1 | GO:0071955 | recycling endosome to Golgi transport(GO:0071955) |
| 0.0 | 0.1 | GO:0003383 | apical constriction(GO:0003383) |
| 0.0 | 0.1 | GO:1900827 | positive regulation of cell communication by electrical coupling(GO:0010650) positive regulation of membrane depolarization during cardiac muscle cell action potential(GO:1900827) |
| 0.0 | 0.1 | GO:0071000 | response to magnetism(GO:0071000) |
| 0.0 | 0.0 | GO:0001682 | tRNA 5'-leader removal(GO:0001682) |
| 0.0 | 0.1 | GO:0072656 | maintenance of protein location in mitochondrion(GO:0072656) |
| 0.0 | 0.0 | GO:0007199 | G-protein coupled receptor signaling pathway coupled to cGMP nucleotide second messenger(GO:0007199) |
| 0.0 | 0.1 | GO:0061484 | hematopoietic stem cell homeostasis(GO:0061484) |
| 0.0 | 0.2 | GO:0031643 | positive regulation of myelination(GO:0031643) |
| 0.0 | 0.1 | GO:1903527 | positive regulation of membrane tubulation(GO:1903527) |
| 0.0 | 0.0 | GO:1905247 | regulation of aspartic-type endopeptidase activity involved in amyloid precursor protein catabolic process(GO:1902959) positive regulation of aspartic-type endopeptidase activity involved in amyloid precursor protein catabolic process(GO:1902961) regulation of metalloendopeptidase activity involved in amyloid precursor protein catabolic process(GO:1902962) negative regulation of metalloendopeptidase activity involved in amyloid precursor protein catabolic process(GO:1902963) regulation of aspartic-type peptidase activity(GO:1905245) positive regulation of aspartic-type peptidase activity(GO:1905247) |
| 0.0 | 0.1 | GO:0051036 | regulation of endosome size(GO:0051036) |
| 0.0 | 0.1 | GO:0030206 | chondroitin sulfate biosynthetic process(GO:0030206) |
| 0.0 | 0.0 | GO:0002337 | B-1a B cell differentiation(GO:0002337) |
| 0.0 | 0.3 | GO:0032012 | regulation of ARF protein signal transduction(GO:0032012) |
| 0.0 | 0.1 | GO:0021540 | corpus callosum morphogenesis(GO:0021540) |
Gene overrepresentation in cellular component category:
| Log-likelihood per target | Total log-likelihood | Term | Description |
|---|---|---|---|
| 0.1 | 0.2 | GO:0034686 | integrin alphav-beta8 complex(GO:0034686) |
| 0.1 | 0.4 | GO:0099569 | presynaptic cytoskeleton(GO:0099569) |
| 0.0 | 0.2 | GO:0030015 | CCR4-NOT core complex(GO:0030015) |
| 0.0 | 0.3 | GO:1990316 | ATG1/ULK1 kinase complex(GO:1990316) |
| 0.0 | 0.2 | GO:0044308 | axonal spine(GO:0044308) |
| 0.0 | 0.1 | GO:0098831 | presynaptic active zone cytoplasmic component(GO:0098831) |
| 0.0 | 0.1 | GO:0044609 | DBIRD complex(GO:0044609) |
| 0.0 | 0.2 | GO:0005677 | chromatin silencing complex(GO:0005677) |
| 0.0 | 0.2 | GO:0036057 | filtration diaphragm(GO:0036056) slit diaphragm(GO:0036057) |
| 0.0 | 0.3 | GO:1990454 | L-type voltage-gated calcium channel complex(GO:1990454) |
| 0.0 | 0.1 | GO:0070033 | synaptobrevin 2-SNAP-25-syntaxin-1a-complexin II complex(GO:0070033) |
| 0.0 | 0.1 | GO:0090571 | RNA polymerase II transcription repressor complex(GO:0090571) |
| 0.0 | 0.1 | GO:0033503 | HULC complex(GO:0033503) |
| 0.0 | 0.1 | GO:0097025 | MPP7-DLG1-LIN7 complex(GO:0097025) |
| 0.0 | 0.0 | GO:0000172 | ribonuclease MRP complex(GO:0000172) |
| 0.0 | 0.1 | GO:0097442 | CA3 pyramidal cell dendrite(GO:0097442) |
| 0.0 | 0.0 | GO:0002944 | cyclin K-CDK12 complex(GO:0002944) |
| 0.0 | 0.1 | GO:0031592 | centrosomal corona(GO:0031592) |
| 0.0 | 0.0 | GO:0070826 | paraferritin complex(GO:0070826) |
| 0.0 | 0.1 | GO:0035867 | alphav-beta3 integrin-IGF-1-IGF1R complex(GO:0035867) |
| 0.0 | 0.2 | GO:0035102 | PRC1 complex(GO:0035102) |
| 0.0 | 0.2 | GO:0046581 | intercellular canaliculus(GO:0046581) |
| 0.0 | 0.1 | GO:0005915 | zonula adherens(GO:0005915) |
| 0.0 | 0.1 | GO:0044294 | dendritic growth cone(GO:0044294) |
| 0.0 | 0.1 | GO:0043203 | axon hillock(GO:0043203) |
| 0.0 | 0.1 | GO:0098536 | deuterosome(GO:0098536) |
Gene overrepresentation in molecular function category:
| Log-likelihood per target | Total log-likelihood | Term | Description |
|---|---|---|---|
| 0.1 | 0.3 | GO:0004971 | AMPA glutamate receptor activity(GO:0004971) |
| 0.1 | 0.2 | GO:0070699 | type II activin receptor binding(GO:0070699) |
| 0.1 | 0.2 | GO:0001226 | RNA polymerase II transcription corepressor binding(GO:0001226) |
| 0.0 | 0.1 | GO:0030158 | protein xylosyltransferase activity(GO:0030158) |
| 0.0 | 0.1 | GO:0000827 | inositol-1,3,4,5,6-pentakisphosphate kinase activity(GO:0000827) |
| 0.0 | 0.1 | GO:0005119 | smoothened binding(GO:0005119) |
| 0.0 | 0.4 | GO:0004705 | JUN kinase activity(GO:0004705) SAP kinase activity(GO:0016909) |
| 0.0 | 0.1 | GO:0071535 | RING-like zinc finger domain binding(GO:0071535) |
| 0.0 | 0.2 | GO:1990430 | extracellular matrix protein binding(GO:1990430) |
| 0.0 | 0.1 | GO:0086056 | voltage-gated calcium channel activity involved in AV node cell action potential(GO:0086056) |
| 0.0 | 0.1 | GO:0033222 | xylose binding(GO:0033222) |
| 0.0 | 0.1 | GO:0051377 | mannose-ethanolamine phosphotransferase activity(GO:0051377) |
| 0.0 | 0.1 | GO:0001069 | regulatory region RNA binding(GO:0001069) |
| 0.0 | 0.1 | GO:0052629 | phosphatidylinositol-3,5-bisphosphate 3-phosphatase activity(GO:0052629) |
| 0.0 | 0.2 | GO:0022840 | leak channel activity(GO:0022840) narrow pore channel activity(GO:0022842) |
| 0.0 | 0.2 | GO:0086059 | voltage-gated calcium channel activity involved SA node cell action potential(GO:0086059) |
| 0.0 | 0.2 | GO:0019992 | diacylglycerol binding(GO:0019992) |
| 0.0 | 0.1 | GO:0005250 | A-type (transient outward) potassium channel activity(GO:0005250) |
| 0.0 | 0.1 | GO:0008332 | low voltage-gated calcium channel activity(GO:0008332) |
| 0.0 | 0.1 | GO:0043532 | angiostatin binding(GO:0043532) |
| 0.0 | 0.1 | GO:0008502 | melatonin receptor activity(GO:0008502) |
| 0.0 | 0.1 | GO:0005136 | interleukin-4 receptor binding(GO:0005136) |
| 0.0 | 0.1 | GO:0031697 | beta-1 adrenergic receptor binding(GO:0031697) |
| 0.0 | 0.0 | GO:0000171 | ribonuclease MRP activity(GO:0000171) |
| 0.0 | 0.1 | GO:0035827 | rubidium ion transmembrane transporter activity(GO:0035827) |
| 0.0 | 0.1 | GO:0017034 | Rap guanyl-nucleotide exchange factor activity(GO:0017034) |
| 0.0 | 0.2 | GO:0043995 | histone acetyltransferase activity (H4-K5 specific)(GO:0043995) histone acetyltransferase activity (H4-K8 specific)(GO:0043996) histone acetyltransferase activity (H4-K16 specific)(GO:0046972) |
| 0.0 | 0.0 | GO:0052591 | sn-glycerol-3-phosphate:ubiquinone oxidoreductase activity(GO:0052590) sn-glycerol-3-phosphate:ubiquinone-8 oxidoreductase activity(GO:0052591) |
| 0.0 | 0.1 | GO:0090555 | phosphatidylethanolamine-translocating ATPase activity(GO:0090555) |
| 0.0 | 0.0 | GO:0015094 | cadmium ion transmembrane transporter activity(GO:0015086) lead ion transmembrane transporter activity(GO:0015094) nickel cation transmembrane transporter activity(GO:0015099) vanadium ion transmembrane transporter activity(GO:0015100) ferrous iron uptake transmembrane transporter activity(GO:0015639) chromium ion transmembrane transporter activity(GO:0070835) |
| 0.0 | 0.1 | GO:0004517 | nitric-oxide synthase activity(GO:0004517) |
| 0.0 | 0.1 | GO:0004013 | adenosylhomocysteinase activity(GO:0004013) trialkylsulfonium hydrolase activity(GO:0016802) |
| 0.0 | 0.1 | GO:0001225 | RNA polymerase II transcription coactivator binding(GO:0001225) |
| 0.0 | 0.1 | GO:0004962 | endothelin receptor activity(GO:0004962) |
| 0.0 | 0.1 | GO:0004886 | 9-cis retinoic acid receptor activity(GO:0004886) |
| 0.0 | 0.1 | GO:0008865 | glucokinase activity(GO:0004340) hexokinase activity(GO:0004396) fructokinase activity(GO:0008865) mannokinase activity(GO:0019158) |
| 0.0 | 0.3 | GO:0017075 | syntaxin-1 binding(GO:0017075) |
| 0.0 | 0.0 | GO:0050656 | 3'-phosphoadenosine 5'-phosphosulfate binding(GO:0050656) |
| 0.0 | 0.2 | GO:0001206 | transcriptional repressor activity, RNA polymerase II distal enhancer sequence-specific binding(GO:0001206) |
| 0.0 | 0.1 | GO:0005432 | calcium:sodium antiporter activity(GO:0005432) |
| 0.0 | 0.2 | GO:0030676 | Rac guanyl-nucleotide exchange factor activity(GO:0030676) |
| 0.0 | 0.0 | GO:0005017 | platelet-derived growth factor-activated receptor activity(GO:0005017) |
| 0.0 | 0.3 | GO:0004709 | MAP kinase kinase kinase activity(GO:0004709) |
| 0.0 | 0.1 | GO:0004322 | ferroxidase activity(GO:0004322) oxidoreductase activity, oxidizing metal ions, oxygen as acceptor(GO:0016724) |
| 0.0 | 0.1 | GO:0015386 | potassium:proton antiporter activity(GO:0015386) |
| 0.0 | 0.2 | GO:0002162 | dystroglycan binding(GO:0002162) |
| 0.0 | 0.0 | GO:0072590 | N-acetyl-L-aspartate-L-glutamate ligase activity(GO:0072590) |
| 0.0 | 0.1 | GO:0031852 | mu-type opioid receptor binding(GO:0031852) |
| 0.0 | 0.1 | GO:0005025 | transforming growth factor beta receptor activity, type I(GO:0005025) |
| 0.0 | 0.0 | GO:0023030 | MHC class Ib protein complex binding(GO:0023025) MHC class Ib protein binding, via antigen binding groove(GO:0023030) |
| 0.0 | 0.1 | GO:1990239 | steroid hormone binding(GO:1990239) |
| 0.0 | 0.1 | GO:0047499 | calcium-independent phospholipase A2 activity(GO:0047499) |
Gene overrepresentation in curated gene sets: canonical pathways category:
| Log-likelihood per target | Total log-likelihood | Term | Description |
|---|---|---|---|
| 0.0 | 0.3 | SA PTEN PATHWAY | PTEN is a tumor suppressor that dephosphorylates the lipid messenger phosphatidylinositol triphosphate. |
| 0.0 | 0.1 | PID ALK2 PATHWAY | ALK2 signaling events |
| 0.0 | 0.2 | PID PDGFRA PATHWAY | PDGFR-alpha signaling pathway |
| 0.0 | 0.3 | ST GRANULE CELL SURVIVAL PATHWAY | Granule Cell Survival Pathway is a specific case of more general PAC1 Receptor Pathway. |
Gene overrepresentation in curated gene sets: REACTOME pathways category:
| Log-likelihood per target | Total log-likelihood | Term | Description |
|---|---|---|---|
| 0.0 | 0.4 | REACTOME ACTIVATION OF THE AP1 FAMILY OF TRANSCRIPTION FACTORS | Genes involved in Activation of the AP-1 family of transcription factors |
| 0.0 | 0.3 | REACTOME TRAFFICKING OF GLUR2 CONTAINING AMPA RECEPTORS | Genes involved in Trafficking of GluR2-containing AMPA receptors |
| 0.0 | 0.2 | REACTOME GABA A RECEPTOR ACTIVATION | Genes involved in GABA A receptor activation |
| 0.0 | 0.2 | REACTOME FACILITATIVE NA INDEPENDENT GLUCOSE TRANSPORTERS | Genes involved in Facilitative Na+-independent glucose transporters |
| 0.0 | 0.1 | REACTOME PECAM1 INTERACTIONS | Genes involved in PECAM1 interactions |
| 0.0 | 0.2 | REACTOME DEADENYLATION OF MRNA | Genes involved in Deadenylation of mRNA |