Project
GSE49485: Hypoxia transcriptome sequencing of rat brain.
Navigation
Downloads
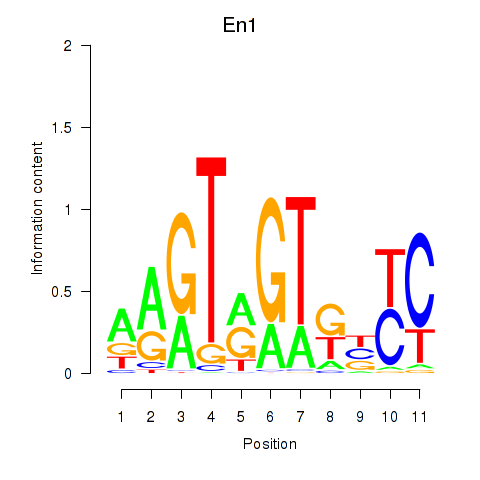
Results for En1
Z-value: 0.41
Motif logo
Transcription factors associated with En1
| Gene Symbol | Gene ID | Gene Info |
|---|---|---|
|
En1
|
ENSRNOG00000056580 | engrailed 1 |
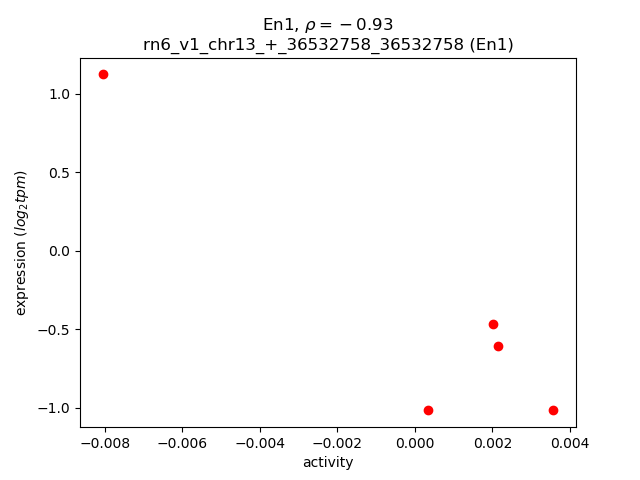
Activity-expression correlation:
| Gene | Promoter | Pearson corr. coef. | P-value | Plot |
|---|---|---|---|---|
| En1 | rn6_v1_chr13_+_36532758_36532758 | -0.93 | 2.3e-02 | Click! |
Activity profile of En1 motif
Sorted Z-values of En1 motif
| Promoter | Log-likelihood | Transcript | Gene | Gene Info |
|---|---|---|---|---|
| chr5_+_76092287 | 0.23 |
ENSRNOT00000020207
|
Zfp483
|
zinc finger protein 483 |
| chr2_+_260997497 | 0.22 |
ENSRNOT00000012638
|
Erich3
|
glutamate-rich 3 |
| chr10_+_11912543 | 0.22 |
ENSRNOT00000045192
|
Zfp597
|
zinc finger protein 597 |
| chr11_-_71108184 | 0.20 |
ENSRNOT00000051989
ENSRNOT00000073865 ENSRNOT00000063883 |
Lrch3
|
leucine rich repeats and calponin homology domain containing 3 |
| chr10_+_86337728 | 0.17 |
ENSRNOT00000085408
|
Tcap
|
titin-cap |
| chrX_-_39956841 | 0.16 |
ENSRNOT00000050708
|
Klhl34
|
kelch-like family member 34 |
| chr5_+_4393472 | 0.15 |
ENSRNOT00000082717
|
Eya1
|
EYA transcriptional coactivator and phosphatase 1 |
| chr11_-_30051103 | 0.15 |
ENSRNOT00000046486
|
Tiam1
|
T-cell lymphoma invasion and metastasis 1 |
| chr7_-_70552897 | 0.14 |
ENSRNOT00000080594
|
Kif5a
|
kinesin family member 5A |
| chr20_+_7279820 | 0.14 |
ENSRNOT00000090820
|
Pacsin1
|
protein kinase C and casein kinase substrate in neurons 1 |
| chr10_-_13558377 | 0.13 |
ENSRNOT00000084066
ENSRNOT00000081995 |
Tbc1d24
|
TBC1 domain family, member 24 |
| chr10_-_92476109 | 0.13 |
ENSRNOT00000089029
|
Kansl1
|
KAT8 regulatory NSL complex subunit 1 |
| chr4_+_168615890 | 0.13 |
ENSRNOT00000009324
|
Crebl2
|
cAMP responsive element binding protein-like 2 |
| chr6_-_76552559 | 0.13 |
ENSRNOT00000065230
|
Ralgapa1
|
Ral GTPase activating protein catalytic alpha subunit 1 |
| chr5_+_90818736 | 0.13 |
ENSRNOT00000093480
ENSRNOT00000009083 |
Kdm4c
|
lysine demethylase 4C |
| chr1_-_49844547 | 0.12 |
ENSRNOT00000086127
ENSRNOT00000077423 ENSRNOT00000089439 ENSRNOT00000090521 |
AABR07001519.1
|
|
| chr1_-_278042312 | 0.12 |
ENSRNOT00000018693
|
Ablim1
|
actin-binding LIM protein 1 |
| chr8_-_21492801 | 0.12 |
ENSRNOT00000077465
|
Zfp426
|
zinc finger protein 426 |
| chr14_+_104821215 | 0.12 |
ENSRNOT00000007162
|
Sertad2
|
SERTA domain containing 2 |
| chr5_-_105579959 | 0.12 |
ENSRNOT00000010827
|
Slc24a2
|
solute carrier family 24 member 2 |
| chr11_+_57207656 | 0.12 |
ENSRNOT00000038207
ENSRNOT00000085754 |
Plcxd2
|
phosphatidylinositol-specific phospholipase C, X domain containing 2 |
| chr15_-_52399074 | 0.12 |
ENSRNOT00000018440
|
Xpo7
|
exportin 7 |
| chr10_+_73868943 | 0.11 |
ENSRNOT00000081012
|
Tubd1
|
tubulin, delta 1 |
| chr10_+_56381813 | 0.11 |
ENSRNOT00000019687
|
Zbtb4
|
zinc finger and BTB domain containing 4 |
| chr9_-_65737538 | 0.11 |
ENSRNOT00000014939
|
Trak2
|
trafficking kinesin protein 2 |
| chr6_+_93563446 | 0.11 |
ENSRNOT00000050558
ENSRNOT00000011056 |
LOC690035
|
similar to Protein KIAA0586 |
| chr13_+_110257571 | 0.11 |
ENSRNOT00000005715
|
Ints7
|
integrator complex subunit 7 |
| chr16_-_15798974 | 0.10 |
ENSRNOT00000046842
ENSRNOT00000065946 |
Nrg3
|
neuregulin 3 |
| chr14_-_80355420 | 0.10 |
ENSRNOT00000049798
|
Acox3
|
acyl-CoA oxidase 3, pristanoyl |
| chr5_-_166116516 | 0.10 |
ENSRNOT00000079919
ENSRNOT00000080888 |
Kif1b
|
kinesin family member 1B |
| chr19_+_752151 | 0.10 |
ENSRNOT00000075978
|
Dync1li2
|
dynein, cytoplasmic 1 light intermediate chain 2 |
| chrX_+_54062935 | 0.10 |
ENSRNOT00000004854
|
Tab3
|
TGF-beta activated kinase 1/MAP3K7 binding protein 3 |
| chr1_+_190666149 | 0.10 |
ENSRNOT00000089361
|
LOC102547219
|
uncharacterized LOC102547219 |
| chr13_-_73055631 | 0.10 |
ENSRNOT00000081892
|
Xpr1
|
xenotropic and polytropic retrovirus receptor 1 |
| chr13_+_50103189 | 0.10 |
ENSRNOT00000004078
|
Atp2b4
|
ATPase plasma membrane Ca2+ transporting 4 |
| chr5_-_77294735 | 0.09 |
ENSRNOT00000018209
ENSRNOT00000056900 |
Zfp37
|
zinc finger protein 37 |
| chr16_-_70705128 | 0.09 |
ENSRNOT00000071258
|
Rnf170
|
ring finger protein 170 |
| chrX_-_152642531 | 0.09 |
ENSRNOT00000085037
|
Gabra3
|
gamma-aminobutyric acid type A receptor alpha3 subunit |
| chr4_+_179398621 | 0.09 |
ENSRNOT00000049474
ENSRNOT00000067506 |
Lrmp
|
lymphoid-restricted membrane protein |
| chr9_-_91683468 | 0.09 |
ENSRNOT00000041550
|
Pid1
|
phosphotyrosine interaction domain containing 1 |
| chr14_-_112946204 | 0.09 |
ENSRNOT00000056813
|
LOC103690141
|
coiled-coil domain-containing protein 85A-like |
| chrX_+_82710329 | 0.09 |
ENSRNOT00000074962
|
AABR07039694.1
|
|
| chr5_+_56797502 | 0.09 |
ENSRNOT00000067992
|
Tmem215
|
transmembrane protein 215 |
| chr8_+_131965134 | 0.09 |
ENSRNOT00000078308
|
Znf660
|
zinc finger protein 660 |
| chr16_-_19643236 | 0.09 |
ENSRNOT00000087597
|
Zfp709
|
zinc finger protein 709 |
| chr20_-_27208041 | 0.09 |
ENSRNOT00000084720
|
Rufy2
|
RUN and FYVE domain containing 2 |
| chr14_-_114692764 | 0.09 |
ENSRNOT00000008210
|
Sptbn1
|
spectrin, beta, non-erythrocytic 1 |
| chr1_+_276309927 | 0.09 |
ENSRNOT00000067460
ENSRNOT00000066236 |
Vti1a
|
vesicle transport through interaction with t-SNAREs 1A |
| chr2_+_219628695 | 0.09 |
ENSRNOT00000067324
|
Sass6
|
SAS-6 centriolar assembly protein |
| chr12_-_11808977 | 0.09 |
ENSRNOT00000071795
|
AABR07035375.1
|
|
| chr8_-_131899023 | 0.09 |
ENSRNOT00000034690
|
Zfp445
|
zinc finger protein 445 |
| chr10_+_5300384 | 0.08 |
ENSRNOT00000029359
|
Tvp23a
|
trans-golgi network vesicle protein 23A |
| chr10_-_90030423 | 0.08 |
ENSRNOT00000092150
|
Mpp2
|
membrane palmitoylated protein 2 |
| chr19_-_22281778 | 0.08 |
ENSRNOT00000049624
|
Phkb
|
phosphorylase kinase regulatory subunit beta |
| chr18_+_48853418 | 0.08 |
ENSRNOT00000022792
|
Csnk1g3
|
casein kinase 1, gamma 3 |
| chr3_-_72113680 | 0.08 |
ENSRNOT00000009708
|
Zdhhc5
|
zinc finger, DHHC-type containing 5 |
| chr10_-_90030639 | 0.08 |
ENSRNOT00000090456
|
Mpp2
|
membrane palmitoylated protein 2 |
| chr10_+_71546977 | 0.08 |
ENSRNOT00000041140
|
Acaca
|
acetyl-CoA carboxylase alpha |
| chr3_+_8547349 | 0.08 |
ENSRNOT00000079108
ENSRNOT00000091697 |
Sptan1
|
spectrin, alpha, non-erythrocytic 1 |
| chr6_+_9790422 | 0.08 |
ENSRNOT00000020959
|
Prkce
|
protein kinase C, epsilon |
| chr7_+_64672722 | 0.08 |
ENSRNOT00000064448
ENSRNOT00000005539 |
Grip1
|
glutamate receptor interacting protein 1 |
| chr11_+_73198522 | 0.08 |
ENSRNOT00000002356
|
Xxylt1
|
xyloside xylosyltransferase 1 |
| chr7_-_80457816 | 0.07 |
ENSRNOT00000039430
|
AABR07057617.1
|
|
| chr7_-_2961873 | 0.07 |
ENSRNOT00000067441
|
Rps15-ps2
|
ribosomal protein S15, pseudogene 2 |
| chr15_+_4209703 | 0.07 |
ENSRNOT00000082236
|
Ppp3cb
|
protein phosphatase 3 catalytic subunit beta |
| chr11_+_83868655 | 0.07 |
ENSRNOT00000072402
|
NEWGENE_621438
|
thrombopoietin |
| chr1_-_128341240 | 0.07 |
ENSRNOT00000070864
ENSRNOT00000072915 |
Mef2a
|
myocyte enhancer factor 2a |
| chr11_-_77593171 | 0.07 |
ENSRNOT00000002645
ENSRNOT00000043498 |
Il1rap
|
interleukin 1 receptor accessory protein |
| chr1_-_37741709 | 0.07 |
ENSRNOT00000079186
|
Fastkd3
|
FAST kinase domains 3 |
| chr2_-_24923128 | 0.07 |
ENSRNOT00000044087
|
Pde8b
|
phosphodiesterase 8B |
| chr8_+_52729003 | 0.07 |
ENSRNOT00000081738
|
Nxpe4
|
neurexophilin and PC-esterase domain family, member 4 |
| chr3_+_56056925 | 0.07 |
ENSRNOT00000088351
ENSRNOT00000010508 |
Klhl23
|
kelch-like family member 23 |
| chr10_+_29606748 | 0.07 |
ENSRNOT00000080720
|
AABR07029467.2
|
|
| chr5_+_147069616 | 0.07 |
ENSRNOT00000072908
|
Trim62
|
tripartite motif-containing 62 |
| chr1_-_67134827 | 0.07 |
ENSRNOT00000045214
|
Vom1r45
|
vomeronasal 1 receptor 45 |
| chr9_-_112027155 | 0.07 |
ENSRNOT00000021258
ENSRNOT00000080962 |
Pja2
|
praja ring finger ubiquitin ligase 2 |
| chr8_+_22050222 | 0.07 |
ENSRNOT00000028096
|
Icam5
|
intercellular adhesion molecule 5 |
| chr18_-_32670665 | 0.07 |
ENSRNOT00000019409
|
Nr3c1
|
nuclear receptor subfamily 3, group C, member 1 |
| chr2_-_210454737 | 0.07 |
ENSRNOT00000079993
|
Ahcyl1
|
adenosylhomocysteinase-like 1 |
| chr5_+_139007642 | 0.06 |
ENSRNOT00000066774
|
Hivep3
|
human immunodeficiency virus type I enhancer binding protein 3 |
| chr4_-_59809321 | 0.06 |
ENSRNOT00000017536
|
Plxna4
|
plexin A4 |
| chr1_-_265542276 | 0.06 |
ENSRNOT00000065172
|
Mgea5
|
meningioma expressed antigen 5 (hyaluronidase) |
| chr7_+_2795901 | 0.06 |
ENSRNOT00000047462
|
Ankrd52
|
ankyrin repeat domain 52 |
| chr4_+_157524423 | 0.06 |
ENSRNOT00000036654
|
Zfp384
|
zinc finger protein 384 |
| chr5_+_60250546 | 0.06 |
ENSRNOT00000017707
|
Zcchc7
|
zinc finger CCHC-type containing 7 |
| chr10_+_89646195 | 0.06 |
ENSRNOT00000048140
|
Dhx8
|
DEAH-box helicase 8 |
| chr5_-_147412705 | 0.06 |
ENSRNOT00000010688
|
RGD1561149
|
similar to mKIAA1522 protein |
| chr1_+_274688580 | 0.06 |
ENSRNOT00000020580
|
Shoc2
|
SHOC2 leucine-rich repeat scaffold protein |
| chr11_+_47146308 | 0.06 |
ENSRNOT00000002191
|
Cep97
|
centrosomal protein 97 |
| chr5_-_156811650 | 0.06 |
ENSRNOT00000068065
|
Fam43b
|
family with sequence similarity 43, member B |
| chr20_+_20105047 | 0.06 |
ENSRNOT00000082181
|
Ank3
|
ankyrin 3 |
| chr10_+_59360765 | 0.06 |
ENSRNOT00000036278
|
Zzef1
|
zinc finger ZZ-type and EF-hand domain containing 1 |
| chr12_+_32103198 | 0.06 |
ENSRNOT00000085464
|
Tmem132d
|
transmembrane protein 132D |
| chr13_+_75105615 | 0.06 |
ENSRNOT00000076653
|
Tp53i3
|
tumor protein p53 inducible protein 3 |
| chr17_-_45154355 | 0.06 |
ENSRNOT00000084976
|
Zkscan4
|
zinc finger with KRAB and SCAN domains 4 |
| chr14_+_34727915 | 0.06 |
ENSRNOT00000085089
|
Kdr
|
kinase insert domain receptor |
| chr4_-_150829913 | 0.06 |
ENSRNOT00000041571
|
Cacna1c
|
calcium voltage-gated channel subunit alpha1 C |
| chr10_+_46972038 | 0.06 |
ENSRNOT00000023838
|
Mief2
|
mitochondrial elongation factor 2 |
| chr2_+_186980992 | 0.06 |
ENSRNOT00000020717
|
Arhgef11
|
Rho guanine nucleotide exchange factor 11 |
| chrX_-_1952111 | 0.06 |
ENSRNOT00000061140
|
Jade3
|
jade family PHD finger 3 |
| chr6_+_134844676 | 0.06 |
ENSRNOT00000007595
|
Ppp2r5c
|
protein phosphatase 2, regulatory subunit B', gamma |
| chr7_-_141001993 | 0.06 |
ENSRNOT00000092068
|
Fmnl3
|
formin-like 3 |
| chr9_+_2202511 | 0.06 |
ENSRNOT00000017556
|
Satb1
|
SATB homeobox 1 |
| chr2_-_38110567 | 0.06 |
ENSRNOT00000072212
|
Ipo11
|
importin 11 |
| chr15_-_106678918 | 0.06 |
ENSRNOT00000034723
|
Stk24
|
serine/threonine kinase 24 |
| chr6_+_25074955 | 0.06 |
ENSRNOT00000084773
|
Ehd3
|
EH-domain containing 3 |
| chr12_-_41266430 | 0.06 |
ENSRNOT00000001853
ENSRNOT00000081108 |
Oas1b
|
2-5 oligoadenylate synthetase 1B |
| chr11_+_88699222 | 0.06 |
ENSRNOT00000084177
|
Fgd4
|
FYVE, RhoGEF and PH domain containing 4 |
| chr10_-_87248572 | 0.06 |
ENSRNOT00000066637
ENSRNOT00000085677 |
Krt26
|
keratin 26 |
| chrX_-_1786978 | 0.06 |
ENSRNOT00000011317
|
Rbm10
|
RNA binding motif protein 10 |
| chr3_-_162579201 | 0.06 |
ENSRNOT00000068328
|
Zmynd8
|
zinc finger, MYND-type containing 8 |
| chr1_-_266074181 | 0.05 |
ENSRNOT00000026378
|
Psd
|
pleckstrin and Sec7 domain containing |
| chr11_-_45510961 | 0.05 |
ENSRNOT00000002238
|
Tomm70
|
translocase of outer mitochondrial membrane 70 |
| chr5_+_119727839 | 0.05 |
ENSRNOT00000014354
|
Cachd1
|
cache domain containing 1 |
| chr1_+_142679345 | 0.05 |
ENSRNOT00000034267
|
Zscan2
|
zinc finger and SCAN domain containing 2 |
| chr15_-_93765498 | 0.05 |
ENSRNOT00000093297
|
Mycbp2
|
MYC binding protein 2, E3 ubiquitin protein ligase |
| chr2_-_33841499 | 0.05 |
ENSRNOT00000040533
|
Srek1
|
splicing regulatory glutamic acid and lysine rich protein 1 |
| chr8_-_116635851 | 0.05 |
ENSRNOT00000024939
|
Rbm6
|
RNA binding motif protein 6 |
| chr5_-_83648044 | 0.05 |
ENSRNOT00000046725
|
RGD1561195
|
similar to ribosomal protein L31 |
| chr10_+_5930298 | 0.05 |
ENSRNOT00000044626
|
Grin2a
|
glutamate ionotropic receptor NMDA type subunit 2A |
| chr1_+_7726529 | 0.05 |
ENSRNOT00000073460
|
Adat2
|
adenosine deaminase, tRNA-specific 2 |
| chr17_-_36438752 | 0.05 |
ENSRNOT00000048997
|
RGD1561310
|
similar to ribosomal protein L37 |
| chr19_-_955626 | 0.05 |
ENSRNOT00000017774
|
Bean1
|
brain expressed, associated with NEDD4, 1 |
| chr18_+_55505993 | 0.05 |
ENSRNOT00000043736
|
RGD1309362
|
similar to interferon-inducible GTPase |
| chr8_-_104155775 | 0.05 |
ENSRNOT00000042885
|
LOC102550734
|
60S ribosomal protein L31-like |
| chr1_+_197098603 | 0.05 |
ENSRNOT00000022365
|
LOC361646
|
similar to K04F10.2 |
| chr1_-_80178708 | 0.05 |
ENSRNOT00000088676
|
Vasp
|
vasodilator-stimulated phosphoprotein |
| chr8_+_96551245 | 0.05 |
ENSRNOT00000039850
|
Bcl2a1
|
BCL2-related protein A1 |
| chr20_+_7762327 | 0.05 |
ENSRNOT00000000595
|
Zfp523
|
zinc finger protein 523 |
| chrX_+_43881246 | 0.05 |
ENSRNOT00000005153
|
LOC317456
|
hypothetical LOC317456 |
| chr10_-_82399484 | 0.05 |
ENSRNOT00000082972
ENSRNOT00000055582 |
Xylt2
|
xylosyltransferase 2 |
| chr16_-_54137660 | 0.05 |
ENSRNOT00000085435
|
Pcm1
|
pericentriolar material 1 |
| chrX_-_157095274 | 0.05 |
ENSRNOT00000084088
|
Abcd1
|
ATP binding cassette subfamily D member 1 |
| chr4_-_22192474 | 0.05 |
ENSRNOT00000043822
|
Abcb1a
|
ATP binding cassette subfamily B member 1A |
| chr1_-_275876329 | 0.05 |
ENSRNOT00000047903
|
Gpam
|
glycerol-3-phosphate acyltransferase, mitochondrial |
| chr7_-_69104950 | 0.05 |
ENSRNOT00000049063
|
LOC500846
|
hypothetical protein LOC500846 |
| chr14_-_28536260 | 0.05 |
ENSRNOT00000059942
|
Adgrl3
|
adhesion G protein-coupled receptor L3 |
| chr3_+_151508361 | 0.05 |
ENSRNOT00000055251
|
Cep250
|
centrosomal protein 250 |
| chr7_-_15072703 | 0.05 |
ENSRNOT00000087294
|
Zfp799
|
zinc finger protein 799 |
| chr9_+_15309127 | 0.05 |
ENSRNOT00000019177
|
Prickle4
|
prickle planar cell polarity protein 4 |
| chr10_+_55169282 | 0.05 |
ENSRNOT00000005423
|
Ccdc42
|
coiled-coil domain containing 42 |
| chr18_-_31071371 | 0.04 |
ENSRNOT00000060432
|
Diaph1
|
diaphanous-related formin 1 |
| chr7_+_11215328 | 0.04 |
ENSRNOT00000061194
|
LOC690617
|
hypothetical protein LOC690617 |
| chr14_+_84876781 | 0.04 |
ENSRNOT00000065188
|
Ascc2
|
activating signal cointegrator 1 complex subunit 2 |
| chr11_+_73936750 | 0.04 |
ENSRNOT00000002350
|
Atp13a3
|
ATPase 13A3 |
| chr3_+_8537350 | 0.04 |
ENSRNOT00000079640
|
Sptan1
|
spectrin, alpha, non-erythrocytic 1 |
| chr14_+_12218553 | 0.04 |
ENSRNOT00000003237
|
Prkg2
|
protein kinase, cGMP-dependent, type II |
| chr16_+_7303578 | 0.04 |
ENSRNOT00000025656
|
Sema3g
|
semaphorin 3G |
| chr15_-_48284548 | 0.04 |
ENSRNOT00000038336
|
Hmbox1
|
homeobox containing 1 |
| chr14_-_59735450 | 0.04 |
ENSRNOT00000071929
|
Rbpj
|
recombination signal binding protein for immunoglobulin kappa J region |
| chr2_+_2729829 | 0.04 |
ENSRNOT00000017068
|
Spata9
|
spermatogenesis associated 9 |
| chr11_-_87158597 | 0.04 |
ENSRNOT00000002517
|
Vpreb2
|
pre-B lymphocyte gene 2 |
| chr17_+_5382034 | 0.04 |
ENSRNOT00000037597
|
Golm1
|
golgi membrane protein 1 |
| chr15_-_24056073 | 0.04 |
ENSRNOT00000015100
|
Wdhd1
|
WD repeat and HMG-box DNA binding protein 1 |
| chr13_+_109505697 | 0.04 |
ENSRNOT00000005084
|
Angel2
|
angel homolog 2 |
| chr18_+_56887722 | 0.04 |
ENSRNOT00000078783
|
Csnk1a1
|
casein kinase 1, alpha 1 |
| chr8_+_7128656 | 0.04 |
ENSRNOT00000038313
|
Pgr
|
progesterone receptor |
| chr18_+_30424814 | 0.04 |
ENSRNOT00000073425
|
Pcdhb7
|
protocadherin beta 7 |
| chr17_+_77601877 | 0.04 |
ENSRNOT00000091554
ENSRNOT00000024872 |
Prpf18
|
pre-mRNA processing factor 18 |
| chr4_+_51614676 | 0.04 |
ENSRNOT00000060494
|
Asb15
|
ankyrin repeat and SOCS box containing 15 |
| chr9_+_27343853 | 0.04 |
ENSRNOT00000072794
|
Tmem14a
|
transmembrane protein 14A |
| chr14_+_37918652 | 0.04 |
ENSRNOT00000088441
|
Tec
|
tec protein tyrosine kinase |
| chr4_-_55011415 | 0.04 |
ENSRNOT00000056996
|
Grm8
|
glutamate metabotropic receptor 8 |
| chr19_-_10826895 | 0.04 |
ENSRNOT00000090217
|
Rspry1
|
ring finger and SPRY domain containing 1 |
| chr3_+_79498179 | 0.04 |
ENSRNOT00000030750
|
Nup160
|
nucleoporin 160 |
| chr15_+_83703791 | 0.04 |
ENSRNOT00000090637
|
Klf5
|
Kruppel-like factor 5 |
| chr3_+_112428395 | 0.04 |
ENSRNOT00000079109
ENSRNOT00000048141 |
Stard9
|
StAR-related lipid transfer domain containing 9 |
| chr4_+_71652354 | 0.04 |
ENSRNOT00000022672
ENSRNOT00000022543 |
Casp2
|
caspase 2 |
| chr1_+_167539036 | 0.04 |
ENSRNOT00000093112
|
Rrm1
|
ribonucleotide reductase catalytic subunit M1 |
| chr6_-_2961510 | 0.04 |
ENSRNOT00000090688
|
Dhx57
|
DExH-box helicase 57 |
| chr5_+_104698040 | 0.04 |
ENSRNOT00000009127
|
Adamtsl1
|
ADAMTS-like 1 |
| chr4_+_157523770 | 0.04 |
ENSRNOT00000055985
ENSRNOT00000023240 |
Zfp384
|
zinc finger protein 384 |
| chr4_+_153385205 | 0.04 |
ENSRNOT00000016561
|
Bcl2l13
|
BCL2 like 13 |
| chr1_+_214534284 | 0.04 |
ENSRNOT00000064254
|
Ap2a2
|
adaptor-related protein complex 2, alpha 2 subunit |
| chr4_-_28224858 | 0.04 |
ENSRNOT00000091075
|
AABR07059632.3
|
|
| chr5_-_165083487 | 0.04 |
ENSRNOT00000036647
|
Disp3
|
dispatched RND transporter family member 3 |
| chr4_-_150829741 | 0.04 |
ENSRNOT00000051846
ENSRNOT00000052017 |
Cacna1c
|
calcium voltage-gated channel subunit alpha1 C |
| chr15_+_33271015 | 0.04 |
ENSRNOT00000073767
|
Psmb11
|
proteasome subunit beta 11 |
| chr11_+_84745904 | 0.04 |
ENSRNOT00000002617
|
Klhl6
|
kelch-like family member 6 |
| chr1_-_66254989 | 0.04 |
ENSRNOT00000025981
ENSRNOT00000079249 |
Zfp606
|
zinc finger protein 606 |
| chr5_-_120083904 | 0.04 |
ENSRNOT00000064542
|
Jak1
|
Janus kinase 1 |
| chr12_+_37709860 | 0.04 |
ENSRNOT00000086244
|
Mphosph9
|
M-phase phosphoprotein 9 |
| chr4_+_183896303 | 0.04 |
ENSRNOT00000055437
|
RGD1309621
|
similar to hypothetical protein FLJ10652 |
| chr17_-_27665266 | 0.04 |
ENSRNOT00000060218
|
Rreb1
|
ras responsive element binding protein 1 |
| chr10_+_56610051 | 0.04 |
ENSRNOT00000024348
|
Dvl2
|
dishevelled segment polarity protein 2 |
| chr4_-_34194764 | 0.04 |
ENSRNOT00000045270
|
Col28a1
|
collagen type XXVIII alpha 1 chain |
| chr4_+_115416580 | 0.04 |
ENSRNOT00000018303
|
Atp6v1b1
|
ATPase H+ transporting V1 subunit B1 |
| chr1_+_226077120 | 0.04 |
ENSRNOT00000027611
|
Rab3il1
|
RAB3A interacting protein-like 1 |
| chr10_-_52290657 | 0.04 |
ENSRNOT00000005293
|
Map2k4
|
mitogen activated protein kinase kinase 4 |
| chr9_+_94324793 | 0.04 |
ENSRNOT00000092493
|
Eif4e2
|
eukaryotic translation initiation factor 4E family member 2 |
| chr11_+_57404196 | 0.04 |
ENSRNOT00000042754
ENSRNOT00000034097 |
Phldb2
|
pleckstrin homology-like domain, family B, member 2 |
| chr2_-_2779109 | 0.04 |
ENSRNOT00000017098
|
Rfesd
|
Rieske (Fe-S) domain containing |
| chr2_-_192697800 | 0.04 |
ENSRNOT00000066614
|
NEWGENE_2324572
|
small proline rich protein 4 |
| chr6_+_106496992 | 0.04 |
ENSRNOT00000086136
ENSRNOT00000058181 |
Rgs6
|
regulator of G-protein signaling 6 |
| chr4_+_152437966 | 0.04 |
ENSRNOT00000013070
|
Rad52
|
RAD52 homolog, DNA repair protein |
| chr10_-_38985466 | 0.04 |
ENSRNOT00000010121
|
Il13
|
interleukin 13 |
| chr1_+_84612448 | 0.04 |
ENSRNOT00000032991
|
AABR07071891.1
|
|
| chr1_-_197098649 | 0.04 |
ENSRNOT00000022271
|
Gtf3c1
|
general transcription factor IIIC subunit 1 |
| chr3_-_8432593 | 0.04 |
ENSRNOT00000090574
|
AC114363.1
|
|
| chr5_-_65073012 | 0.04 |
ENSRNOT00000007957
|
Grin3a
|
glutamate ionotropic receptor NMDA type subunit 3A |
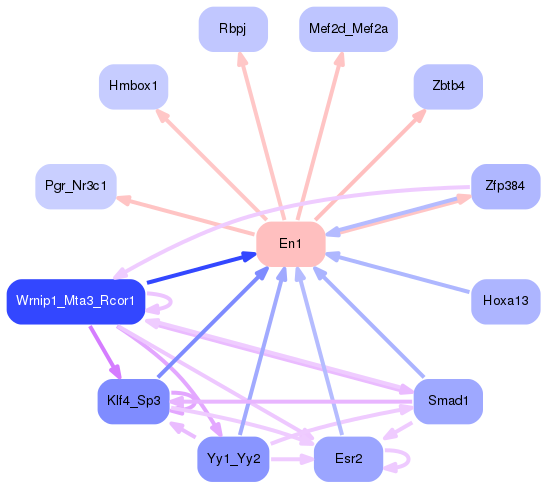
Network of associatons between targets according to the STRING database.

First level regulatory network of En1
Gene Ontology Analysis
Gene overrepresentation in biological process category:
| Log-likelihood per target | Total log-likelihood | Term | Description |
|---|---|---|---|
| 0.1 | 0.2 | GO:0035995 | detection of muscle stretch(GO:0035995) |
| 0.0 | 0.1 | GO:0098971 | anterograde dendritic transport of neurotransmitter receptor complex(GO:0098971) |
| 0.0 | 0.1 | GO:0010751 | regulation of arginine metabolic process(GO:0000821) negative regulation of nitric oxide mediated signal transduction(GO:0010751) negative regulation of cellular amino acid metabolic process(GO:0045763) |
| 0.0 | 0.1 | GO:1900147 | Schwann cell migration(GO:0036135) regulation of Schwann cell migration(GO:1900147) |
| 0.0 | 0.1 | GO:0098972 | dendritic transport of mitochondrion(GO:0098939) anterograde dendritic transport of mitochondrion(GO:0098972) |
| 0.0 | 0.1 | GO:0033540 | fatty acid beta-oxidation using acyl-CoA oxidase(GO:0033540) |
| 0.0 | 0.1 | GO:0021842 | directional guidance of interneurons involved in migration from the subpallium to the cortex(GO:0021840) chemorepulsion involved in interneuron migration from the subpallium to the cortex(GO:0021842) |
| 0.0 | 0.2 | GO:0072513 | positive regulation of secondary heart field cardioblast proliferation(GO:0072513) |
| 0.0 | 0.1 | GO:0001915 | negative regulation of T cell mediated cytotoxicity(GO:0001915) |
| 0.0 | 0.1 | GO:0038163 | thrombopoietin-mediated signaling pathway(GO:0038163) |
| 0.0 | 0.1 | GO:0055005 | ventricular cardiac myofibril assembly(GO:0055005) |
| 0.0 | 0.1 | GO:0038172 | interleukin-33-mediated signaling pathway(GO:0038172) |
| 0.0 | 0.1 | GO:2001274 | negative regulation of glucose import in response to insulin stimulus(GO:2001274) |
| 0.0 | 0.1 | GO:0021564 | vagus nerve development(GO:0021564) |
| 0.0 | 0.1 | GO:0010616 | negative regulation of cardiac muscle adaptation(GO:0010616) |
| 0.0 | 0.1 | GO:0019520 | aldonic acid metabolic process(GO:0019520) D-gluconate metabolic process(GO:0019521) |
| 0.0 | 0.1 | GO:2001295 | multicellular organismal protein metabolic process(GO:0044268) malonyl-CoA biosynthetic process(GO:2001295) |
| 0.0 | 0.1 | GO:0051562 | negative regulation of mitochondrial calcium ion concentration(GO:0051562) |
| 0.0 | 0.0 | GO:1903691 | positive regulation of wound healing, spreading of epidermal cells(GO:1903691) |
| 0.0 | 0.1 | GO:0033058 | directional locomotion(GO:0033058) |
| 0.0 | 0.1 | GO:0098912 | membrane depolarization during atrial cardiac muscle cell action potential(GO:0098912) |
| 0.0 | 0.1 | GO:1900170 | negative regulation of glucocorticoid mediated signaling pathway(GO:1900170) |
| 0.0 | 0.1 | GO:1900827 | positive regulation of cell communication by electrical coupling(GO:0010650) positive regulation of membrane depolarization during cardiac muscle cell action potential(GO:1900827) |
| 0.0 | 0.0 | GO:0030997 | regulation of centriole-centriole cohesion(GO:0030997) |
| 0.0 | 0.0 | GO:2001226 | negative regulation of chloride transport(GO:2001226) |
| 0.0 | 0.0 | GO:1901187 | epidermal cell fate specification(GO:0009957) regulation of ephrin receptor signaling pathway(GO:1901187) |
| 0.0 | 0.1 | GO:1900113 | negative regulation of histone H3-K9 trimethylation(GO:1900113) |
| 0.0 | 0.0 | GO:1904708 | granulosa cell apoptotic process(GO:1904700) regulation of granulosa cell apoptotic process(GO:1904708) |
| 0.0 | 0.0 | GO:0000350 | generation of catalytic spliceosome for second transesterification step(GO:0000350) |
| 0.0 | 0.1 | GO:1903756 | regulation of transcription from RNA polymerase II promoter by histone modification(GO:1903756) negative regulation of transcription from RNA polymerase II promoter by histone modification(GO:1903758) |
| 0.0 | 0.1 | GO:0035106 | operant conditioning(GO:0035106) |
| 0.0 | 0.1 | GO:1902083 | negative regulation of peptidyl-cysteine S-nitrosylation(GO:1902083) |
| 0.0 | 0.1 | GO:0048597 | post-embryonic camera-type eye morphogenesis(GO:0048597) |
| 0.0 | 0.0 | GO:0030210 | heparin biosynthetic process(GO:0030210) |
| 0.0 | 0.0 | GO:1990963 | carbohydrate export(GO:0033231) daunorubicin transport(GO:0043215) response to borneol(GO:1905230) cellular response to borneol(GO:1905231) response to codeine(GO:1905233) response to quercetin(GO:1905235) drug transport across blood-brain barrier(GO:1990962) establishment of blood-retinal barrier(GO:1990963) |
| 0.0 | 0.0 | GO:0033861 | negative regulation of NAD(P)H oxidase activity(GO:0033861) negative regulation of complement-dependent cytotoxicity(GO:1903660) |
| 0.0 | 0.0 | GO:0045054 | constitutive secretory pathway(GO:0045054) |
| 0.0 | 0.1 | GO:0050882 | voluntary musculoskeletal movement(GO:0050882) |
| 0.0 | 0.0 | GO:0015820 | leucine transport(GO:0015820) |
Gene overrepresentation in cellular component category:
| Log-likelihood per target | Total log-likelihood | Term | Description |
|---|---|---|---|
| 0.0 | 0.2 | GO:0032437 | cuticular plate(GO:0032437) |
| 0.0 | 0.1 | GO:0098536 | deuterosome(GO:0098536) |
| 0.0 | 0.1 | GO:0020018 | ciliary pocket(GO:0020016) ciliary pocket membrane(GO:0020018) |
| 0.0 | 0.0 | GO:0002193 | MAML1-RBP-Jkappa- ICN1 complex(GO:0002193) |
| 0.0 | 0.1 | GO:0071821 | FANCM-MHF complex(GO:0071821) |
| 0.0 | 0.1 | GO:0005955 | calcineurin complex(GO:0005955) |
| 0.0 | 0.2 | GO:0060091 | kinocilium(GO:0060091) |
| 0.0 | 0.2 | GO:0032591 | dendritic spine membrane(GO:0032591) |
| 0.0 | 0.0 | GO:0042827 | platelet dense granule(GO:0042827) |
| 0.0 | 0.0 | GO:0005594 | collagen type IX trimer(GO:0005594) |
| 0.0 | 0.1 | GO:0005964 | phosphorylase kinase complex(GO:0005964) |
Gene overrepresentation in molecular function category:
| Log-likelihood per target | Total log-likelihood | Term | Description |
|---|---|---|---|
| 0.0 | 0.2 | GO:0051373 | FATZ binding(GO:0051373) |
| 0.0 | 0.1 | GO:0000822 | inositol hexakisphosphate binding(GO:0000822) |
| 0.0 | 0.1 | GO:0002114 | interleukin-33 receptor activity(GO:0002114) |
| 0.0 | 0.1 | GO:0003997 | acyl-CoA oxidase activity(GO:0003997) |
| 0.0 | 0.1 | GO:0035252 | UDP-xylosyltransferase activity(GO:0035252) |
| 0.0 | 0.1 | GO:0008273 | calcium, potassium:sodium antiporter activity(GO:0008273) |
| 0.0 | 0.1 | GO:0003989 | acetyl-CoA carboxylase activity(GO:0003989) |
| 0.0 | 0.1 | GO:0004699 | calcium-independent protein kinase C activity(GO:0004699) |
| 0.0 | 0.2 | GO:0030346 | protein phosphatase 2B binding(GO:0030346) |
| 0.0 | 0.1 | GO:0004616 | phosphogluconate dehydrogenase (decarboxylating) activity(GO:0004616) |
| 0.0 | 0.1 | GO:0086056 | voltage-gated calcium channel activity involved in AV node cell action potential(GO:0086056) |
| 0.0 | 0.1 | GO:0004013 | adenosylhomocysteinase activity(GO:0004013) trialkylsulfonium hydrolase activity(GO:0016802) |
| 0.0 | 0.1 | GO:0045504 | dynein heavy chain binding(GO:0045504) |
| 0.0 | 0.1 | GO:0005049 | nuclear export signal receptor activity(GO:0005049) |
| 0.0 | 0.0 | GO:0000386 | second spliceosomal transesterification activity(GO:0000386) |
| 0.0 | 0.1 | GO:0004563 | beta-N-acetylhexosaminidase activity(GO:0004563) |
| 0.0 | 0.0 | GO:0005324 | long-chain fatty acid transporter activity(GO:0005324) |
| 0.0 | 0.1 | GO:0046972 | histone acetyltransferase activity (H4-K5 specific)(GO:0043995) histone acetyltransferase activity (H4-K8 specific)(GO:0043996) histone acetyltransferase activity (H4-K16 specific)(GO:0046972) |
| 0.0 | 0.0 | GO:0004743 | pyruvate kinase activity(GO:0004743) |
| 0.0 | 0.0 | GO:0001642 | group III metabotropic glutamate receptor activity(GO:0001642) |
| 0.0 | 0.1 | GO:0003960 | NADPH:quinone reductase activity(GO:0003960) |
| 0.0 | 0.1 | GO:0004689 | phosphorylase kinase activity(GO:0004689) |