Project
GSE49485: Hypoxia transcriptome sequencing of rat brain.
Navigation
Downloads
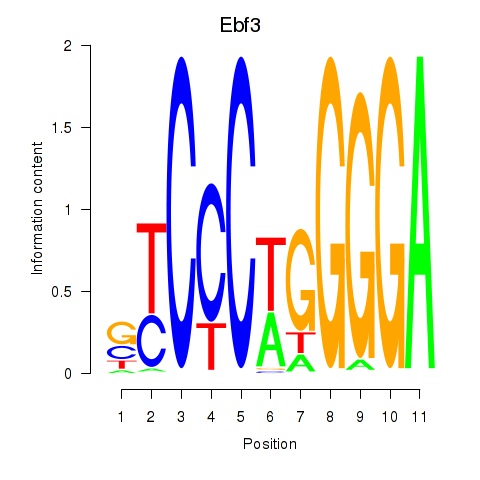
Results for Ebf3
Z-value: 0.51
Motif logo
Transcription factors associated with Ebf3
| Gene Symbol | Gene ID | Gene Info |
|---|---|---|
|
Ebf3
|
ENSRNOG00000016102 | early B-cell factor 3 |
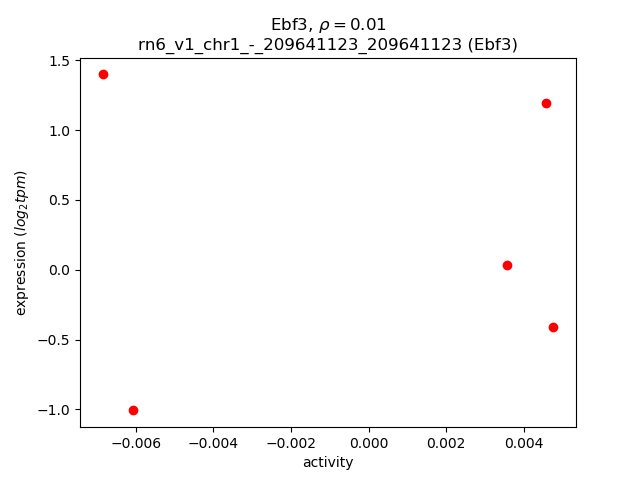
Activity-expression correlation:
| Gene | Promoter | Pearson corr. coef. | P-value | Plot |
|---|---|---|---|---|
| Ebf3 | rn6_v1_chr1_-_209641123_209641123 | 0.01 | 9.9e-01 | Click! |
Activity profile of Ebf3 motif
Sorted Z-values of Ebf3 motif
| Promoter | Log-likelihood | Transcript | Gene | Gene Info |
|---|---|---|---|---|
| chr9_-_15274917 | 0.39 |
ENSRNOT00000019650
|
Pgc
|
progastricsin |
| chr10_-_15603649 | 0.35 |
ENSRNOT00000051483
|
Hba-a2
|
hemoglobin alpha, adult chain 2 |
| chr10_+_77537340 | 0.26 |
ENSRNOT00000003297
|
Tmem100
|
transmembrane protein 100 |
| chr7_-_28715224 | 0.25 |
ENSRNOT00000065899
|
Parpbp
|
PARP1 binding protein |
| chr2_-_202816562 | 0.20 |
ENSRNOT00000020401
|
Fam46c
|
family with sequence similarity 46, member C |
| chr10_-_91047177 | 0.19 |
ENSRNOT00000003986
|
C1ql1
|
complement C1q like 1 |
| chr1_+_123015746 | 0.17 |
ENSRNOT00000013483
|
Magel2
|
MAGE family member L2 |
| chr6_+_133576568 | 0.17 |
ENSRNOT00000085933
|
Dlk1
|
delta like non-canonical Notch ligand 1 |
| chr2_+_187347602 | 0.17 |
ENSRNOT00000025384
|
Nes
|
nestin |
| chr10_-_38838272 | 0.16 |
ENSRNOT00000089495
|
Sowaha
|
sosondowah ankyrin repeat domain family member A |
| chr1_+_80321585 | 0.15 |
ENSRNOT00000022895
|
Ckm
|
creatine kinase, M-type |
| chr8_-_63092009 | 0.15 |
ENSRNOT00000034300
|
Loxl1
|
lysyl oxidase-like 1 |
| chr4_+_145427367 | 0.14 |
ENSRNOT00000037788
|
Il17rc
|
interleukin 17 receptor C |
| chr6_+_133552821 | 0.14 |
ENSRNOT00000006339
|
Dlk1
|
delta like non-canonical Notch ligand 1 |
| chr13_-_112099336 | 0.13 |
ENSRNOT00000009158
ENSRNOT00000044161 |
Camk1g
|
calcium/calmodulin-dependent protein kinase IG |
| chr12_+_24651314 | 0.12 |
ENSRNOT00000077016
ENSRNOT00000071569 |
Vps37d
|
VPS37D, ESCRT-I subunit |
| chr19_-_37819789 | 0.11 |
ENSRNOT00000036702
|
Cenpt
|
centromere protein T |
| chr3_+_168345152 | 0.11 |
ENSRNOT00000017654
|
Dok5
|
docking protein 5 |
| chr8_+_106449321 | 0.11 |
ENSRNOT00000018622
|
Rbp1
|
retinol binding protein 1 |
| chr14_+_84306466 | 0.11 |
ENSRNOT00000006116
|
Sec14l4
|
SEC14-like lipid binding 4 |
| chr5_-_156141537 | 0.10 |
ENSRNOT00000019004
|
Alpl
|
alkaline phosphatase, liver/bone/kidney |
| chr20_+_29897594 | 0.10 |
ENSRNOT00000057752
|
Vsir
|
V-set immunoregulatory receptor |
| chr1_+_81230612 | 0.10 |
ENSRNOT00000026489
|
Kcnn4
|
potassium calcium-activated channel subfamily N member 4 |
| chr7_-_71048383 | 0.10 |
ENSRNOT00000005693
|
Gpr182
|
G protein-coupled receptor 182 |
| chr4_+_98371184 | 0.10 |
ENSRNOT00000086911
|
AABR07060872.1
|
|
| chr7_+_142905758 | 0.10 |
ENSRNOT00000078663
|
Nr4a1
|
nuclear receptor subfamily 4, group A, member 1 |
| chr3_-_171342646 | 0.10 |
ENSRNOT00000071853
|
Pmepa1
|
prostate transmembrane protein, androgen induced 1 |
| chr10_-_83655182 | 0.09 |
ENSRNOT00000007897
|
Abi3
|
ABI family, member 3 |
| chr1_+_213766758 | 0.09 |
ENSRNOT00000005645
|
Ifitm1
|
interferon induced transmembrane protein 1 |
| chrX_+_15273933 | 0.09 |
ENSRNOT00000075082
|
LOC108348091
|
erythroid transcription factor |
| chr1_+_80279706 | 0.09 |
ENSRNOT00000047105
|
Ppp1r13l
|
protein phosphatase 1, regulatory subunit 13 like |
| chr6_-_132972511 | 0.09 |
ENSRNOT00000082216
|
Begain
|
brain-enriched guanylate kinase-associated |
| chr3_-_2411544 | 0.09 |
ENSRNOT00000012406
|
Tor4a
|
torsin family 4, member A |
| chr1_+_261229347 | 0.09 |
ENSRNOT00000018485
|
Ubtd1
|
ubiquitin domain containing 1 |
| chr13_+_85818427 | 0.09 |
ENSRNOT00000077227
ENSRNOT00000006117 |
Rxrg
|
retinoid X receptor gamma |
| chr3_-_123702732 | 0.08 |
ENSRNOT00000028859
|
RGD1311739
|
similar to RIKEN cDNA 1700037H04 |
| chr2_+_205160405 | 0.08 |
ENSRNOT00000035605
|
Tspan2
|
tetraspanin 2 |
| chr18_-_77579969 | 0.08 |
ENSRNOT00000034896
|
Sall3
|
spalt-like transcription factor 3 |
| chr8_-_104912959 | 0.08 |
ENSRNOT00000017363
|
Spsb4
|
splA/ryanodine receptor domain and SOCS box containing 4 |
| chr5_-_148355406 | 0.08 |
ENSRNOT00000018674
|
Hcrtr1
|
hypocretin receptor 1 |
| chr7_-_125407806 | 0.08 |
ENSRNOT00000084666
|
RGD1566029
|
similar to mKIAA1644 protein |
| chr14_+_84237520 | 0.08 |
ENSRNOT00000083580
|
Gal3st1
|
galactose-3-O-sulfotransferase 1 |
| chr1_+_257157264 | 0.08 |
ENSRNOT00000067149
ENSRNOT00000079219 |
Plce1
|
phospholipase C, epsilon 1 |
| chrX_+_82143789 | 0.08 |
ENSRNOT00000003724
|
Pou3f4
|
POU class 3 homeobox 4 |
| chr1_+_81763614 | 0.08 |
ENSRNOT00000027254
|
Cd79a
|
CD79a molecule |
| chr18_+_52550739 | 0.08 |
ENSRNOT00000037529
|
Ctxn3
|
cortexin 3 |
| chr15_-_41691518 | 0.07 |
ENSRNOT00000020036
|
Ebpl
|
emopamil binding protein-like |
| chr10_-_86004096 | 0.07 |
ENSRNOT00000091978
ENSRNOT00000066855 |
Stac2
|
SH3 and cysteine rich domain 2 |
| chr20_-_5140304 | 0.07 |
ENSRNOT00000092646
|
Prrc2a
|
proline-rich coiled-coil 2A |
| chr6_+_136185487 | 0.07 |
ENSRNOT00000015373
|
Apopt1
|
apoptogenic 1, mitochondrial |
| chr13_-_53108713 | 0.07 |
ENSRNOT00000035404
|
RGD1311892
|
similar to hypothetical protein FLJ10901 |
| chr1_-_221015929 | 0.07 |
ENSRNOT00000028137
|
Sipa1
|
signal-induced proliferation-associated 1 |
| chr17_-_43675934 | 0.07 |
ENSRNOT00000081345
|
Hist1h1t
|
histone cluster 1 H1 family member t |
| chr1_+_221735517 | 0.07 |
ENSRNOT00000028628
ENSRNOT00000044866 |
Sf1
|
splicing factor 1 |
| chr17_-_15881327 | 0.07 |
ENSRNOT00000022341
|
Ninj1
|
ninjurin 1 |
| chr12_-_21760292 | 0.07 |
ENSRNOT00000059592
|
LOC102550456
|
TSC22 domain family protein 4-like |
| chr10_-_56403188 | 0.06 |
ENSRNOT00000019947
|
Chrnb1
|
cholinergic receptor nicotinic beta 1 subunit |
| chrX_+_159158194 | 0.06 |
ENSRNOT00000043820
ENSRNOT00000001169 ENSRNOT00000083502 |
Fhl1
|
four and a half LIM domains 1 |
| chr10_+_4719713 | 0.06 |
ENSRNOT00000003412
|
Litaf
|
lipopolysaccharide-induced TNF factor |
| chr4_-_159079003 | 0.06 |
ENSRNOT00000026691
|
Kcna5
|
potassium voltage-gated channel subfamily A member 5 |
| chr1_-_72464492 | 0.06 |
ENSRNOT00000068550
|
Nat14
|
N-acetyltransferase 14 |
| chr1_+_85337805 | 0.06 |
ENSRNOT00000026839
|
Samd4b
|
sterile alpha motif domain containing 4B |
| chr12_-_47919400 | 0.06 |
ENSRNOT00000073774
|
Mvk
|
mevalonate kinase |
| chr2_-_93641497 | 0.06 |
ENSRNOT00000013720
|
Chmp4c
|
charged multivesicular body protein 4C |
| chr19_-_10653800 | 0.06 |
ENSRNOT00000022128
|
Cx3cl1
|
C-X3-C motif chemokine ligand 1 |
| chr14_-_44613904 | 0.05 |
ENSRNOT00000003811
|
Klb
|
klotho beta |
| chr1_+_225068009 | 0.05 |
ENSRNOT00000026651
|
Ubxn1
|
UBX domain protein 1 |
| chr2_+_197682000 | 0.05 |
ENSRNOT00000066821
|
Hormad1
|
HORMA domain containing 1 |
| chr1_+_219233750 | 0.05 |
ENSRNOT00000024112
|
Acy3
|
aminoacylase 3 |
| chr7_-_140770647 | 0.05 |
ENSRNOT00000081784
|
C1ql4
|
complement C1q like 4 |
| chr9_+_81566074 | 0.05 |
ENSRNOT00000074131
ENSRNOT00000046229 ENSRNOT00000090383 |
Pnkd
|
paroxysmal nonkinesigenic dyskinesia |
| chr1_-_189960073 | 0.05 |
ENSRNOT00000088482
|
Crym
|
crystallin, mu |
| chr1_+_170242846 | 0.05 |
ENSRNOT00000023751
|
Cnga4
|
cyclic nucleotide gated channel alpha 4 |
| chr5_+_157165341 | 0.05 |
ENSRNOT00000087072
|
Pla2g2c
|
phospholipase A2, group IIC |
| chr13_+_94888078 | 0.05 |
ENSRNOT00000077995
ENSRNOT00000005647 ENSRNOT00000077345 |
Sdccag8
|
serologically defined colon cancer antigen 8 |
| chr5_+_64789456 | 0.05 |
ENSRNOT00000009584
|
Zfp189
|
zinc finger protein 189 |
| chr9_+_94928489 | 0.05 |
ENSRNOT00000087366
ENSRNOT00000085770 ENSRNOT00000024733 |
Sag
|
S-antigen visual arrestin |
| chr3_-_7795758 | 0.05 |
ENSRNOT00000045919
|
Ntng2
|
netrin G2 |
| chr9_+_82596355 | 0.05 |
ENSRNOT00000065076
|
Speg
|
SPEG complex locus |
| chr7_+_126228295 | 0.05 |
ENSRNOT00000021071
|
Atxn10
|
ataxin 10 |
| chr20_+_2094931 | 0.05 |
ENSRNOT00000001013
|
Ppp1r11
|
protein phosphatase 1, regulatory (inhibitor) subunit 11 |
| chr10_+_49472460 | 0.05 |
ENSRNOT00000038276
|
Tekt3
|
tektin 3 |
| chr5_-_56576676 | 0.05 |
ENSRNOT00000029712
|
Ndufb6
|
NADH:ubiquinone oxidoreductase subunit B6 |
| chr18_+_80939875 | 0.05 |
ENSRNOT00000021729
|
Zadh2
|
zinc binding alcohol dehydrogenase, domain containing 2 |
| chr14_-_78308933 | 0.05 |
ENSRNOT00000065334
|
Crmp1
|
collapsin response mediator protein 1 |
| chr11_-_74315248 | 0.05 |
ENSRNOT00000002346
|
Hes1
|
hes family bHLH transcription factor 1 |
| chr13_+_52667969 | 0.05 |
ENSRNOT00000084986
ENSRNOT00000050284 |
Tnnt2
|
troponin T2, cardiac type |
| chr10_+_70627401 | 0.05 |
ENSRNOT00000076897
|
Rasl10b
|
RAS-like, family 10, member B |
| chr10_-_110232843 | 0.05 |
ENSRNOT00000054934
|
Cd7
|
Cd7 molecule |
| chr7_+_118507224 | 0.05 |
ENSRNOT00000075451
|
LOC108348142
|
60S ribosomal protein L8 |
| chr7_-_140356209 | 0.05 |
ENSRNOT00000077856
|
Rnd1
|
Rho family GTPase 1 |
| chr14_-_91904433 | 0.05 |
ENSRNOT00000005857
|
Fignl1
|
fidgetin-like 1 |
| chr7_+_117967818 | 0.05 |
ENSRNOT00000073724
|
LOC100360117
|
ribosomal protein L8-like |
| chr15_-_34469350 | 0.04 |
ENSRNOT00000067536
|
Adcy4
|
adenylate cyclase 4 |
| chr17_-_35037076 | 0.04 |
ENSRNOT00000090946
|
Dusp22
|
dual specificity phosphatase 22 |
| chr1_-_87937516 | 0.04 |
ENSRNOT00000087522
|
Eif3k
|
eukaryotic translation initiation factor 3, subunit K |
| chr3_+_148234193 | 0.04 |
ENSRNOT00000010418
|
Cox4i2
|
cytochrome c oxidase subunit 4i2 |
| chrX_-_116638508 | 0.04 |
ENSRNOT00000030400
|
Lhfpl1
|
lipoma HMGIC fusion partner-like 1 |
| chr3_+_152857592 | 0.04 |
ENSRNOT00000027445
|
Myl9
|
myosin light chain 9 |
| chr14_+_80248140 | 0.04 |
ENSRNOT00000010852
|
Htra3
|
HtrA serine peptidase 3 |
| chr10_+_54512983 | 0.04 |
ENSRNOT00000005204
|
Stx8
|
syntaxin 8 |
| chr5_-_150723321 | 0.04 |
ENSRNOT00000018038
|
Atpif1
|
ATPase inhibitory factor 1 |
| chr7_-_97605113 | 0.04 |
ENSRNOT00000089734
|
AABR07058000.1
|
|
| chrX_+_23146085 | 0.04 |
ENSRNOT00000068703
|
Apex2
|
apurinic/apyrimidinic endodeoxyribonuclease 2 |
| chr20_-_3438389 | 0.04 |
ENSRNOT00000001098
ENSRNOT00000090039 |
Flot1
|
flotillin 1 |
| chr2_+_189423559 | 0.04 |
ENSRNOT00000029076
|
Tpm3
|
tropomyosin 3 |
| chr5_+_64790186 | 0.04 |
ENSRNOT00000078502
|
Zfp189
|
zinc finger protein 189 |
| chr2_+_26240385 | 0.04 |
ENSRNOT00000024292
|
F2rl2
|
coagulation factor II (thrombin) receptor-like 2 |
| chr10_+_82375572 | 0.04 |
ENSRNOT00000004947
|
Mrpl27
|
mitochondrial ribosomal protein L27 |
| chrX_+_134979646 | 0.04 |
ENSRNOT00000006035
|
Sash3
|
SAM and SH3 domain containing 3 |
| chr6_-_94834908 | 0.04 |
ENSRNOT00000006284
|
L3hypdh
|
trans-L-3-hydroxyproline dehydratase |
| chr5_+_166464252 | 0.04 |
ENSRNOT00000055562
|
Ctnnbip1
|
catenin, beta-interacting protein 1 |
| chr16_+_73564243 | 0.04 |
ENSRNOT00000030960
|
Golga7
|
golgin A7 |
| chr2_+_210880777 | 0.04 |
ENSRNOT00000026237
|
Gnat2
|
G protein subunit alpha transducin 2 |
| chr19_-_19376789 | 0.04 |
ENSRNOT00000065103
|
Nod2
|
nucleotide-binding oligomerization domain containing 2 |
| chr9_-_81566096 | 0.04 |
ENSRNOT00000019497
|
Aamp
|
angio-associated, migratory cell protein |
| chr1_+_214009986 | 0.04 |
ENSRNOT00000089241
|
LOC100911730
|
CD151 antigen-like |
| chr20_+_4355175 | 0.04 |
ENSRNOT00000000510
|
Gpsm3
|
G-protein signaling modulator 3 |
| chr4_+_102351036 | 0.04 |
ENSRNOT00000079277
|
AABR07060994.1
|
|
| chr20_-_3397039 | 0.04 |
ENSRNOT00000001084
ENSRNOT00000085259 |
Ppp1r18
|
protein phosphatase 1, regulatory subunit 18 |
| chr1_-_178196294 | 0.04 |
ENSRNOT00000067170
|
Btbd10
|
BTB domain containing 10 |
| chr19_+_52347580 | 0.04 |
ENSRNOT00000074753
|
Atp2c2
|
ATPase secretory pathway Ca2+ transporting 2 |
| chr1_+_214009784 | 0.04 |
ENSRNOT00000026079
|
LOC100911730
|
CD151 antigen-like |
| chr7_+_77066955 | 0.04 |
ENSRNOT00000008700
|
Odf1
|
outer dense fiber of sperm tails 1 |
| chr2_-_187863503 | 0.04 |
ENSRNOT00000093036
ENSRNOT00000026705 ENSRNOT00000082174 |
Lmna
|
lamin A/C |
| chr1_+_264893162 | 0.04 |
ENSRNOT00000021714
|
Tlx1
|
T-cell leukemia, homeobox 1 |
| chr11_-_81444375 | 0.04 |
ENSRNOT00000058479
ENSRNOT00000078131 ENSRNOT00000080949 ENSRNOT00000080562 ENSRNOT00000084867 |
Kng1
|
kininogen 1 |
| chr13_+_44957014 | 0.03 |
ENSRNOT00000004878
|
Ubxn4
|
UBX domain protein 4 |
| chr1_+_189432604 | 0.03 |
ENSRNOT00000034610
|
Acsm4
|
acyl-CoA synthetase medium-chain family member 4 |
| chr15_+_61673560 | 0.03 |
ENSRNOT00000093661
|
Mtrf1
|
mitochondrial translation release factor 1 |
| chr13_+_78805347 | 0.03 |
ENSRNOT00000003748
|
Serpinc1
|
serpin family C member 1 |
| chr10_+_59539405 | 0.03 |
ENSRNOT00000077107
|
Itgae
|
integrin subunit alpha E |
| chr9_+_17340341 | 0.03 |
ENSRNOT00000026637
ENSRNOT00000026559 ENSRNOT00000042790 ENSRNOT00000044163 ENSRNOT00000083811 |
Vegfa
|
vascular endothelial growth factor A |
| chr19_-_26181449 | 0.03 |
ENSRNOT00000036953
|
LOC685513
|
similar to Guanine nucleotide-binding protein G(I)/G(S)/G(O) gamma-12 subunit precursor |
| chrX_+_159112880 | 0.03 |
ENSRNOT00000084594
|
Fhl1
|
four and a half LIM domains 1 |
| chr6_-_26135952 | 0.03 |
ENSRNOT00000084751
|
Mrpl33
|
mitochondrial ribosomal protein L33 |
| chr10_+_57040267 | 0.03 |
ENSRNOT00000026207
|
Arrb2
|
arrestin, beta 2 |
| chr1_+_240908483 | 0.03 |
ENSRNOT00000019367
|
Klf9
|
Kruppel-like factor 9 |
| chr4_-_31730386 | 0.03 |
ENSRNOT00000013817
|
Slc25a13
|
solute carrier family 25 member 13 |
| chr5_+_159734838 | 0.03 |
ENSRNOT00000079905
|
Rsg1
|
REM2 and RAB-like small GTPase 1 |
| chr5_+_169338097 | 0.03 |
ENSRNOT00000014035
|
Hes2
|
hes family bHLH transcription factor 2 |
| chrX_+_157095937 | 0.03 |
ENSRNOT00000091792
|
Bcap31
|
B-cell receptor-associated protein 31 |
| chr16_-_6077978 | 0.03 |
ENSRNOT00000020823
|
Il17rb
|
interleukin 17 receptor B |
| chr8_+_76977822 | 0.03 |
ENSRNOT00000090268
|
Sltm
|
SAFB-like, transcription modulator |
| chr4_+_118852062 | 0.03 |
ENSRNOT00000090827
ENSRNOT00000025070 |
Gfpt1
|
glutamine fructose-6-phosphate transaminase 1 |
| chr1_+_192025710 | 0.03 |
ENSRNOT00000077457
|
Ubfd1
|
ubiquitin family domain containing 1 |
| chr9_+_47536824 | 0.03 |
ENSRNOT00000049349
|
Tmem182
|
transmembrane protein 182 |
| chr9_+_93660680 | 0.03 |
ENSRNOT00000025779
|
Dis3l2
|
DIS3-like 3'-5' exoribonuclease 2 |
| chr13_+_90692666 | 0.03 |
ENSRNOT00000010028
|
Igsf8
|
immunoglobulin superfamily, member 8 |
| chr10_+_92289107 | 0.03 |
ENSRNOT00000050070
|
Mapt
|
microtubule-associated protein tau |
| chr7_+_141355994 | 0.03 |
ENSRNOT00000081195
|
Smarcd1
|
SWI/SNF related, matrix associated, actin dependent regulator of chromatin, subfamily d, member 1 |
| chr5_+_157165888 | 0.03 |
ENSRNOT00000043029
|
Pla2g2c
|
phospholipase A2, group IIC |
| chrX_+_34630048 | 0.03 |
ENSRNOT00000091746
|
Nhs
|
NHS actin remodeling regulator |
| chr20_-_11528332 | 0.03 |
ENSRNOT00000038419
|
Tspear
|
thrombospondin-type laminin G domain and EAR repeats |
| chr11_-_32088002 | 0.02 |
ENSRNOT00000002732
|
Atp5o
|
ATP synthase, H+ transporting, mitochondrial F1 complex, O subunit |
| chr1_+_140762758 | 0.02 |
ENSRNOT00000047848
|
Acan
|
aggrecan |
| chr5_-_63192025 | 0.02 |
ENSRNOT00000008913
|
Alg2
|
ALG2, alpha-1,3/1,6-mannosyltransferase |
| chr10_-_102576878 | 0.02 |
ENSRNOT00000091129
|
Sdk2
|
sidekick cell adhesion molecule 2 |
| chr2_+_240021152 | 0.02 |
ENSRNOT00000012473
|
Tacr3
|
tachykinin receptor 3 |
| chr3_-_79390956 | 0.02 |
ENSRNOT00000077943
|
Ptprj
|
protein tyrosine phosphatase, receptor type, J |
| chrX_+_92131209 | 0.02 |
ENSRNOT00000004462
|
Pabpc5
|
poly A binding protein, cytoplasmic 5 |
| chr1_-_82580007 | 0.02 |
ENSRNOT00000078668
|
Axl
|
Axl receptor tyrosine kinase |
| chr8_-_71055969 | 0.02 |
ENSRNOT00000075734
|
Ankdd1a
|
ankyrin repeat and death domain containing 1A |
| chr17_+_47302272 | 0.02 |
ENSRNOT00000090021
|
Nme8
|
NME/NM23 family member 8 |
| chr1_-_178195948 | 0.02 |
ENSRNOT00000081767
|
Btbd10
|
BTB domain containing 10 |
| chr1_-_88908750 | 0.02 |
ENSRNOT00000028297
|
Aplp1
|
amyloid beta precursor like protein 1 |
| chr12_-_52676608 | 0.02 |
ENSRNOT00000072507
|
Plcxd1
|
phosphatidylinositol-specific phospholipase C, X domain containing 1 |
| chr2_-_188216482 | 0.02 |
ENSRNOT00000027579
|
Msto1
|
misato 1, mitochondrial distribution and morphology regulator |
| chr12_-_22748860 | 0.02 |
ENSRNOT00000001923
|
Cldn15
|
claudin 15 |
| chr2_+_41442241 | 0.02 |
ENSRNOT00000067546
|
Pde4d
|
phosphodiesterase 4D |
| chr1_+_214446659 | 0.02 |
ENSRNOT00000072434
|
Cd151
|
CD151 molecule (Raph blood group) |
| chr14_-_83776863 | 0.02 |
ENSRNOT00000026481
|
Smtn
|
smoothelin |
| chr1_-_89360733 | 0.02 |
ENSRNOT00000028544
|
Mag
|
myelin-associated glycoprotein |
| chr15_-_51485692 | 0.02 |
ENSRNOT00000023876
|
Rhobtb2
|
Rho-related BTB domain containing 2 |
| chr7_+_140464999 | 0.02 |
ENSRNOT00000090156
|
Wnt1
|
wingless-type MMTV integration site family, member 1 |
| chr13_-_90832469 | 0.02 |
ENSRNOT00000086508
|
Igsf9
|
immunoglobulin superfamily, member 9 |
| chr20_+_40618128 | 0.02 |
ENSRNOT00000001075
ENSRNOT00000057364 |
Pkib
|
cAMP-dependent protein kinase inhibitor beta |
| chr7_-_143603803 | 0.02 |
ENSRNOT00000038480
|
Krt8
|
keratin 8 |
| chr4_+_110700403 | 0.02 |
ENSRNOT00000092379
|
Lrrtm4
|
leucine rich repeat transmembrane neuronal 4 |
| chr3_+_159995064 | 0.02 |
ENSRNOT00000012606
|
Ttpal
|
alpha tocopherol transfer protein like |
| chr10_-_75270561 | 0.02 |
ENSRNOT00000012279
|
Dynll2
|
dynein light chain LC8-type 2 |
| chr19_+_26184545 | 0.02 |
ENSRNOT00000005656
|
Dhps
|
deoxyhypusine synthase |
| chr5_+_140692779 | 0.02 |
ENSRNOT00000019101
|
Mycl
|
v-myc avian myelocytomatosis viral oncogene lung carcinoma derived homolog |
| chr3_+_175924522 | 0.02 |
ENSRNOT00000086626
|
NEWGENE_1308612
|
MRG/MORF4L binding protein |
| chr5_+_156026911 | 0.02 |
ENSRNOT00000046802
|
Rap1gap
|
Rap1 GTPase-activating protein |
| chr10_+_108095131 | 0.02 |
ENSRNOT00000073470
|
Enpp7
|
ectonucleotide pyrophosphatase/phosphodiesterase 7 |
| chr2_-_211207465 | 0.02 |
ENSRNOT00000027263
|
Celsr2
|
cadherin, EGF LAG seven-pass G-type receptor 2 |
| chr9_-_29337922 | 0.02 |
ENSRNOT00000018896
|
RGD1309049
|
similar to RIKEN cDNA 4933415F23 |
| chr1_-_252116971 | 0.02 |
ENSRNOT00000035013
|
Lipo1
|
lipase, member O1 |
| chr10_+_53595854 | 0.02 |
ENSRNOT00000044116
|
Sco1
|
SCO1 cytochrome c oxidase assembly protein |
| chr12_+_41600005 | 0.02 |
ENSRNOT00000001872
|
Plbd2
|
phospholipase B domain containing 2 |
| chr5_-_135498822 | 0.02 |
ENSRNOT00000023072
|
Akr1a1
|
aldo-keto reductase family 1 member A1 |
| chr13_-_111474411 | 0.02 |
ENSRNOT00000072729
|
Hhat
|
hedgehog acyltransferase |
| chr20_+_10334308 | 0.02 |
ENSRNOT00000001566
|
Pknox1
|
PBX/knotted 1 homeobox 1 |
| chr8_-_63533546 | 0.02 |
ENSRNOT00000012381
|
Rec114
|
REC114 meiotic recombination protein |
| chr10_+_92288910 | 0.01 |
ENSRNOT00000006947
ENSRNOT00000045127 |
Mapt
|
microtubule-associated protein tau |
| chr14_-_7863664 | 0.01 |
ENSRNOT00000061162
|
Ptpn13
|
protein tyrosine phosphatase, non-receptor type 13 |
| chr8_-_6034142 | 0.01 |
ENSRNOT00000014560
|
Birc2
|
baculoviral IAP repeat-containing 2 |
| chr6_+_3657325 | 0.01 |
ENSRNOT00000010927
|
Tmem178a
|
transmembrane protein 178A |
| chr4_+_7076759 | 0.01 |
ENSRNOT00000066598
|
Smarcd3
|
SWI/SNF related, matrix associated, actin dependent regulator of chromatin, subfamily d, member 3 |
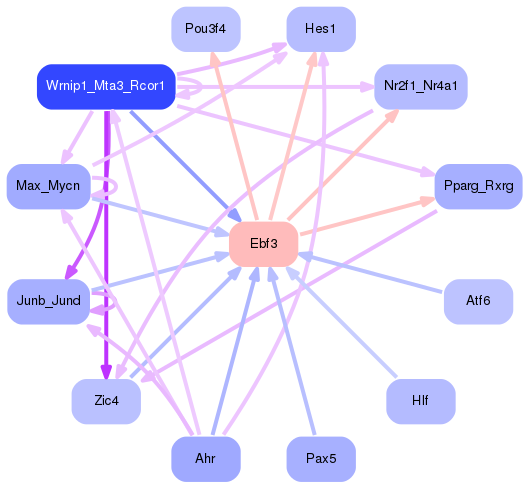
Network of associatons between targets according to the STRING database.

First level regulatory network of Ebf3
Gene Ontology Analysis
Gene overrepresentation in biological process category:
| Log-likelihood per target | Total log-likelihood | Term | Description |
|---|---|---|---|
| 0.1 | 0.4 | GO:0002803 | positive regulation of antimicrobial peptide production(GO:0002225) positive regulation of antibacterial peptide production(GO:0002803) |
| 0.0 | 0.0 | GO:0045608 | inhibition of neuroepithelial cell differentiation(GO:0002085) negative regulation of auditory receptor cell differentiation(GO:0045608) |
| 0.0 | 0.3 | GO:0060842 | arterial endothelial cell differentiation(GO:0060842) |
| 0.0 | 0.2 | GO:0045105 | intermediate filament polymerization or depolymerization(GO:0045105) |
| 0.0 | 0.2 | GO:0061743 | motor learning(GO:0061743) |
| 0.0 | 0.1 | GO:0071529 | cementum mineralization(GO:0071529) |
| 0.0 | 0.0 | GO:0060948 | cardiac vascular smooth muscle cell development(GO:0060948) |
| 0.0 | 0.3 | GO:0015671 | oxygen transport(GO:0015671) |
| 0.0 | 0.1 | GO:0019375 | galactosylceramide biosynthetic process(GO:0006682) galactolipid biosynthetic process(GO:0019375) |
| 0.0 | 0.3 | GO:2000042 | negative regulation of double-strand break repair via homologous recombination(GO:2000042) |
| 0.0 | 0.1 | GO:0042631 | cellular response to water deprivation(GO:0042631) |
| 0.0 | 0.1 | GO:0030221 | basophil differentiation(GO:0030221) |
| 0.0 | 0.1 | GO:0098749 | cerebellar neuron development(GO:0098749) |
| 0.0 | 0.1 | GO:0019287 | isopentenyl diphosphate biosynthetic process, mevalonate pathway(GO:0019287) |
| 0.0 | 0.2 | GO:1900017 | positive regulation of cytokine production involved in inflammatory response(GO:1900017) |
| 0.0 | 0.1 | GO:0006776 | vitamin A metabolic process(GO:0006776) |
| 0.0 | 0.1 | GO:2000562 | negative regulation of CD4-positive, alpha-beta T cell proliferation(GO:2000562) |
| 0.0 | 0.1 | GO:0043435 | response to corticotropin-releasing hormone(GO:0043435) cellular response to corticotropin-releasing hormone stimulus(GO:0071376) |
| 0.0 | 0.1 | GO:0010991 | negative regulation of SMAD protein complex assembly(GO:0010991) |
| 0.0 | 0.0 | GO:0032972 | regulation of muscle filament sliding speed(GO:0032972) |
| 0.0 | 0.0 | GO:0003050 | regulation of systemic arterial blood pressure by atrial natriuretic peptide(GO:0003050) |
| 0.0 | 0.1 | GO:0090611 | ubiquitin-independent protein catabolic process via the multivesicular body sorting pathway(GO:0090611) |
| 0.0 | 0.0 | GO:2000049 | positive regulation of cell-cell adhesion mediated by cadherin(GO:2000049) |
| 0.0 | 0.1 | GO:1903094 | regulation of protein K48-linked deubiquitination(GO:1903093) negative regulation of protein K48-linked deubiquitination(GO:1903094) negative regulation of ubiquitin-specific protease activity(GO:2000157) |
| 0.0 | 0.0 | GO:1904529 | regulation of actin filament binding(GO:1904529) regulation of actin binding(GO:1904616) |
| 0.0 | 0.0 | GO:0035105 | sterol regulatory element binding protein import into nucleus(GO:0035105) negative regulation of adipose tissue development(GO:1904178) |
| 0.0 | 0.2 | GO:0051127 | positive regulation of actin nucleation(GO:0051127) |
| 0.0 | 0.1 | GO:0032914 | positive regulation of transforming growth factor beta1 production(GO:0032914) |
| 0.0 | 0.0 | GO:0007597 | blood coagulation, intrinsic pathway(GO:0007597) |
| 0.0 | 0.1 | GO:0061727 | methylglyoxal catabolic process to D-lactate via S-lactoyl-glutathione(GO:0019243) methylglyoxal catabolic process(GO:0051596) methylglyoxal catabolic process to lactate(GO:0061727) |
| 0.0 | 0.0 | GO:1904925 | positive regulation of macromitophagy(GO:1901526) positive regulation of mitophagy in response to mitochondrial depolarization(GO:1904925) |
| 0.0 | 0.1 | GO:0098914 | membrane repolarization during atrial cardiac muscle cell action potential(GO:0098914) |
| 0.0 | 0.0 | GO:0071387 | cellular response to cortisol stimulus(GO:0071387) |
| 0.0 | 0.1 | GO:0080154 | regulation of fertilization(GO:0080154) |
| 0.0 | 0.3 | GO:0045746 | negative regulation of Notch signaling pathway(GO:0045746) |
Gene overrepresentation in cellular component category:
| Log-likelihood per target | Total log-likelihood | Term | Description |
|---|---|---|---|
| 0.1 | 0.3 | GO:0031838 | haptoglobin-hemoglobin complex(GO:0031838) |
| 0.0 | 0.2 | GO:0044301 | climbing fiber(GO:0044301) |
| 0.0 | 0.1 | GO:0046691 | intracellular canaliculus(GO:0046691) |
| 0.0 | 0.1 | GO:0019815 | B cell receptor complex(GO:0019815) |
| 0.0 | 0.1 | GO:0000813 | ESCRT I complex(GO:0000813) |
| 0.0 | 0.1 | GO:0065010 | extracellular membrane-bounded organelle(GO:0065010) |
| 0.0 | 0.0 | GO:1990584 | cardiac Troponin complex(GO:1990584) |
| 0.0 | 0.0 | GO:0045298 | tubulin complex(GO:0045298) |
Gene overrepresentation in molecular function category:
| Log-likelihood per target | Total log-likelihood | Term | Description |
|---|---|---|---|
| 0.1 | 0.3 | GO:0031720 | haptoglobin binding(GO:0031720) |
| 0.0 | 0.1 | GO:0001605 | adrenomedullin receptor activity(GO:0001605) |
| 0.0 | 0.2 | GO:0030368 | interleukin-17 receptor activity(GO:0030368) |
| 0.0 | 0.2 | GO:0004111 | creatine kinase activity(GO:0004111) |
| 0.0 | 0.1 | GO:0001733 | galactosylceramide sulfotransferase activity(GO:0001733) |
| 0.0 | 0.1 | GO:0004046 | aminoacylase activity(GO:0004046) |
| 0.0 | 0.1 | GO:0086089 | voltage-gated potassium channel activity involved in atrial cardiac muscle cell action potential repolarization(GO:0086089) |
| 0.0 | 0.1 | GO:0004886 | 9-cis retinoic acid receptor activity(GO:0004886) |
| 0.0 | 0.0 | GO:0016882 | cyclo-ligase activity(GO:0016882) |
| 0.0 | 0.0 | GO:0008311 | double-stranded DNA 3'-5' exodeoxyribonuclease activity(GO:0008311) |
| 0.0 | 0.2 | GO:0031730 | CCR5 chemokine receptor binding(GO:0031730) |
| 0.0 | 0.1 | GO:0004035 | alkaline phosphatase activity(GO:0004035) |
| 0.0 | 0.1 | GO:0002046 | opsin binding(GO:0002046) |
| 0.0 | 0.0 | GO:0036132 | 13-prostaglandin reductase activity(GO:0036132) |
| 0.0 | 0.0 | GO:0030172 | troponin C binding(GO:0030172) |
| 0.0 | 0.1 | GO:0016286 | small conductance calcium-activated potassium channel activity(GO:0016286) |
| 0.0 | 0.1 | GO:0036435 | K48-linked polyubiquitin binding(GO:0036435) |
| 0.0 | 0.1 | GO:0004416 | hydroxyacylglutathione hydrolase activity(GO:0004416) |
| 0.0 | 0.3 | GO:0004190 | aspartic-type endopeptidase activity(GO:0004190) |
| 0.0 | 0.0 | GO:0099609 | microtubule lateral binding(GO:0099609) |
| 0.0 | 0.0 | GO:0031762 | follicle-stimulating hormone receptor binding(GO:0031762) type 2A serotonin receptor binding(GO:0031826) |
| 0.0 | 0.0 | GO:0015057 | thrombin receptor activity(GO:0015057) |
Gene overrepresentation in curated gene sets: REACTOME pathways category:
| Log-likelihood per target | Total log-likelihood | Term | Description |
|---|---|---|---|
| 0.0 | 0.1 | REACTOME MEMBRANE BINDING AND TARGETTING OF GAG PROTEINS | Genes involved in Membrane binding and targetting of GAG proteins |
| 0.0 | 0.3 | REACTOME ACTIVATED NOTCH1 TRANSMITS SIGNAL TO THE NUCLEUS | Genes involved in Activated NOTCH1 Transmits Signal to the Nucleus |