Project
GSE49485: Hypoxia transcriptome sequencing of rat brain.
Navigation
Downloads
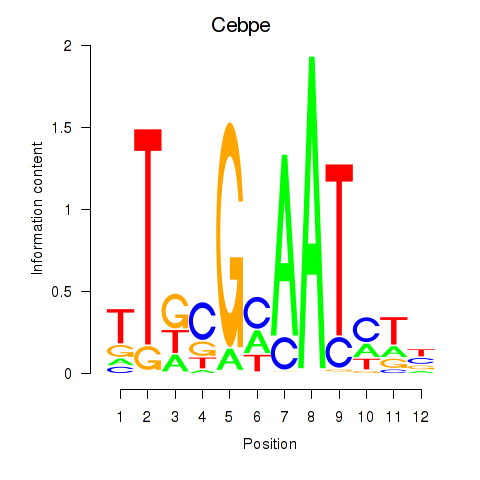
Results for Cebpe
Z-value: 1.11
Motif logo
Transcription factors associated with Cebpe
| Gene Symbol | Gene ID | Gene Info |
|---|---|---|
|
Cebpe
|
ENSRNOG00000014282 | CCAAT/enhancer binding protein epsilon |
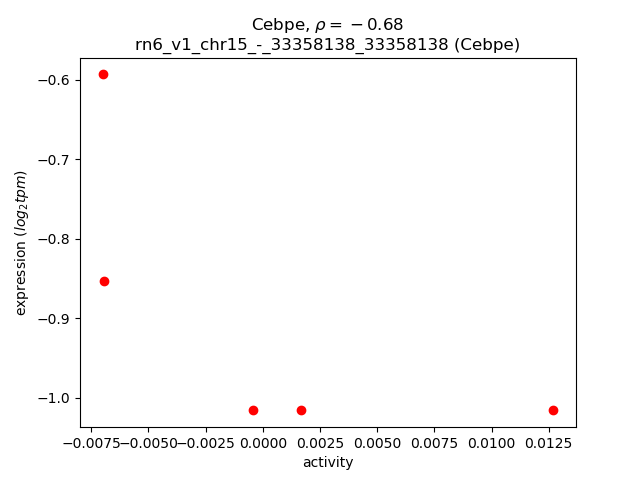
Activity-expression correlation:
| Gene | Promoter | Pearson corr. coef. | P-value | Plot |
|---|---|---|---|---|
| Cebpe | rn6_v1_chr15_-_33358138_33358138 | -0.68 | 2.0e-01 | Click! |
Activity profile of Cebpe motif
Sorted Z-values of Cebpe motif
| Promoter | Log-likelihood | Transcript | Gene | Gene Info |
|---|---|---|---|---|
| chr15_-_44442875 | 0.49 |
ENSRNOT00000017939
|
Gnrh1
|
gonadotropin releasing hormone 1 |
| chr20_-_4070721 | 0.33 |
ENSRNOT00000000523
|
RT1-Ba
|
RT1 class II, locus Ba |
| chr10_+_64737022 | 0.32 |
ENSRNOT00000017071
ENSRNOT00000093232 ENSRNOT00000017042 ENSRNOT00000093244 |
Lgals9
|
galectin 9 |
| chr4_-_23135354 | 0.31 |
ENSRNOT00000011432
|
Steap4
|
STEAP4 metalloreductase |
| chr18_+_55505993 | 0.31 |
ENSRNOT00000043736
|
RGD1309362
|
similar to interferon-inducible GTPase |
| chr5_+_74649765 | 0.30 |
ENSRNOT00000075952
|
Palm2
|
paralemmin 2 |
| chr14_-_33031282 | 0.30 |
ENSRNOT00000043244
|
LOC103693375
|
60S ribosomal protein L39 |
| chr18_-_36513317 | 0.28 |
ENSRNOT00000025453
|
Plac8l1
|
PLAC8-like 1 |
| chr2_+_243550627 | 0.28 |
ENSRNOT00000085067
ENSRNOT00000083682 |
Adh1
|
alcohol dehydrogenase 1 (class I) |
| chr1_+_252409268 | 0.27 |
ENSRNOT00000026219
|
Lipm
|
lipase, family member M |
| chr4_+_102147211 | 0.25 |
ENSRNOT00000083239
|
AABR07060980.1
|
|
| chr8_+_2604962 | 0.25 |
ENSRNOT00000009993
|
Casp1
|
caspase 1 |
| chr7_-_123630045 | 0.25 |
ENSRNOT00000050002
|
Cyp2d1
|
cytochrome P450, family 2, subfamily d, polypeptide 1 |
| chr10_+_31647898 | 0.24 |
ENSRNOT00000066536
|
LOC689968
|
similar to kidney injury molecule 1 |
| chr13_+_50103189 | 0.24 |
ENSRNOT00000004078
|
Atp2b4
|
ATPase plasma membrane Ca2+ transporting 4 |
| chr3_+_112519808 | 0.23 |
ENSRNOT00000014129
|
Rpusd2
|
RNA pseudouridylate synthase domain containing 2 |
| chr4_-_170740274 | 0.23 |
ENSRNOT00000012212
|
Gucy2c
|
guanylate cyclase 2C |
| chr2_-_189573280 | 0.23 |
ENSRNOT00000022897
|
Rps27
|
ribosomal protein S27 |
| chr7_-_140090922 | 0.23 |
ENSRNOT00000014456
|
Lalba
|
lactalbumin, alpha |
| chr3_+_55886695 | 0.23 |
ENSRNOT00000009396
|
Bbs5
|
Bardet-Biedl syndrome 5 |
| chr1_-_169513537 | 0.22 |
ENSRNOT00000078058
|
Trim30c
|
tripartite motif-containing 30C |
| chr1_-_219168177 | 0.22 |
ENSRNOT00000023789
|
Aldh3b1
|
aldehyde dehydrogenase 3 family, member B1 |
| chr5_-_133067245 | 0.22 |
ENSRNOT00000033163
|
Skint10
|
selection and upkeep of intraepithelial T cells 10 |
| chr14_+_63405408 | 0.22 |
ENSRNOT00000086658
|
AABR07015559.1
|
|
| chr2_+_92549479 | 0.22 |
ENSRNOT00000082912
|
tGap1
|
GTPase activating protein testicular GAP1 |
| chr1_-_48891130 | 0.22 |
ENSRNOT00000083884
|
AC135026.1
|
|
| chrX_+_31984612 | 0.21 |
ENSRNOT00000005181
|
Bmx
|
BMX non-receptor tyrosine kinase |
| chr20_-_3793985 | 0.21 |
ENSRNOT00000049540
ENSRNOT00000086293 |
RT1-CE16
|
RT1 class I, locus CE16 |
| chr1_+_169145445 | 0.21 |
ENSRNOT00000034019
|
LOC499219
|
hypothetical protein LOC499219 |
| chr2_-_195678848 | 0.20 |
ENSRNOT00000028303
ENSRNOT00000075569 |
Oaz3
|
ornithine decarboxylase antizyme 3 |
| chr14_+_17210733 | 0.20 |
ENSRNOT00000003075
|
Cxcl10
|
C-X-C motif chemokine ligand 10 |
| chrX_+_14019961 | 0.20 |
ENSRNOT00000004785
|
Sytl5
|
synaptotagmin-like 5 |
| chr14_+_42007312 | 0.20 |
ENSRNOT00000063985
|
Atp8a1
|
ATPase phospholipid transporting 8A1 |
| chr1_-_48565711 | 0.19 |
ENSRNOT00000023387
|
AABR07001512.1
|
|
| chr2_-_220838905 | 0.19 |
ENSRNOT00000078914
|
AABR07013065.1
|
|
| chrM_+_7006 | 0.19 |
ENSRNOT00000043693
|
Mt-co2
|
mitochondrially encoded cytochrome c oxidase II |
| chr16_+_39909270 | 0.19 |
ENSRNOT00000081994
|
Wdr17
|
WD repeat domain 17 |
| chr2_-_157066781 | 0.19 |
ENSRNOT00000001187
|
LOC304239
|
similar to RalA binding protein 1 |
| chr9_-_44024876 | 0.19 |
ENSRNOT00000024366
|
Coa5
|
cytochrome C oxidase assembly factor 5 |
| chr20_-_5227620 | 0.19 |
ENSRNOT00000086240
|
RT1-DMb
|
RT1 class II, locus DMb |
| chr6_-_115513354 | 0.19 |
ENSRNOT00000005881
|
Ston2
|
stonin 2 |
| chr4_+_170347410 | 0.18 |
ENSRNOT00000040508
|
LOC500350
|
LRRGT00139 |
| chr2_+_248276709 | 0.18 |
ENSRNOT00000068683
|
Gbp2
|
guanylate binding protein 2 |
| chr1_+_42170583 | 0.18 |
ENSRNOT00000093104
|
Vip
|
vasoactive intestinal peptide |
| chr1_+_66898946 | 0.18 |
ENSRNOT00000074063
|
Zfp551
|
zinc finger protein 551 |
| chr5_-_79899054 | 0.18 |
ENSRNOT00000074379
|
AC229945.1
|
|
| chr15_-_18096039 | 0.17 |
ENSRNOT00000042545
|
Ptgdr
|
prostaglandin D2 receptor |
| chr1_-_78686952 | 0.17 |
ENSRNOT00000047079
|
LOC679748
|
similar to Macrophage migration inhibitory factor (MIF) (Phenylpyruvate tautomerase) (Glycosylation-inhibiting factor) (GIF) (Delayed early response protein 6) (DER6) |
| chr7_-_123621102 | 0.17 |
ENSRNOT00000046024
|
Cyp2d5
|
cytochrome P450, family 2, subfamily d, polypeptide 5 |
| chr9_+_12420368 | 0.17 |
ENSRNOT00000071620
|
AABR07066693.1
|
|
| chr14_-_19159923 | 0.17 |
ENSRNOT00000003879
|
Afp
|
alpha-fetoprotein |
| chr5_-_50068706 | 0.17 |
ENSRNOT00000084643
|
Orc3
|
origin recognition complex, subunit 3 |
| chr1_-_169456098 | 0.17 |
ENSRNOT00000030827
|
Trim30c
|
tripartite motif-containing 30C |
| chr19_-_23554594 | 0.17 |
ENSRNOT00000004590
|
Il15
|
interleukin 15 |
| chr3_+_108544931 | 0.17 |
ENSRNOT00000006809
|
Tmco5a
|
transmembrane and coiled-coil domains 5A |
| chr11_-_61748768 | 0.17 |
ENSRNOT00000078879
|
Ccdc191
|
coiled-coil domain containing 191 |
| chr3_+_59819157 | 0.17 |
ENSRNOT00000040114
|
LOC103695172
|
uncharacterized LOC103695172 |
| chr6_-_111477090 | 0.17 |
ENSRNOT00000016389
|
Alkbh1
|
alkB homolog 1, histone H2A dioxygenase |
| chr16_+_61954590 | 0.16 |
ENSRNOT00000017883
|
Rbpms
|
RNA binding protein with multiple splicing |
| chr2_-_30340103 | 0.16 |
ENSRNOT00000024023
ENSRNOT00000067722 |
Bdp1
|
B double prime 1, subunit of RNA polymerase III transcription initiation factor IIIB |
| chr1_-_80716143 | 0.16 |
ENSRNOT00000092048
ENSRNOT00000025829 |
Cblc
|
Cbl proto-oncogene C |
| chr9_-_9143189 | 0.16 |
ENSRNOT00000089904
|
MGC116197
|
similar to RIKEN cDNA 1700001E04 |
| chr1_+_147713892 | 0.16 |
ENSRNOT00000092985
ENSRNOT00000054742 ENSRNOT00000074103 |
Cyp2c6v1
|
cytochrome P450, family 2, subfamily C, polypeptide 6, variant 1 |
| chr5_+_173447784 | 0.16 |
ENSRNOT00000027251
|
Tnfrsf4
|
TNF receptor superfamily member 4 |
| chr9_-_14599594 | 0.16 |
ENSRNOT00000018138
|
Treml1
|
triggering receptor expressed on myeloid cells-like 1 |
| chr2_+_58448917 | 0.16 |
ENSRNOT00000082562
|
Ranbp3l
|
RAN binding protein 3-like |
| chr15_+_10462749 | 0.16 |
ENSRNOT00000008035
|
Oxsm
|
3-oxoacyl-ACP synthase, mitochondrial |
| chr2_-_164684985 | 0.16 |
ENSRNOT00000057504
|
Rarres1
|
retinoic acid receptor responder 1 |
| chr5_+_27312928 | 0.16 |
ENSRNOT00000078102
|
Runx1t1
|
RUNX1 translocation partner 1 |
| chr5_-_16782647 | 0.16 |
ENSRNOT00000072844
|
LOC100364265
|
ribosomal protein L19-like |
| chr3_-_16537433 | 0.16 |
ENSRNOT00000048523
|
AABR07051533.2
|
|
| chr6_+_96007805 | 0.15 |
ENSRNOT00000010163
|
Mnat1
|
MNAT CDK-activating kinase assembly factor 1 |
| chr3_-_57270036 | 0.15 |
ENSRNOT00000075860
|
Mettl8
|
methyltransferase like 8 |
| chr4_-_155923079 | 0.15 |
ENSRNOT00000013308
|
Clec4a3
|
C-type lectin domain family 4, member A3 |
| chr7_-_118840634 | 0.15 |
ENSRNOT00000031568
|
Apol11a
|
apolipoprotein L 11a |
| chr1_+_29915443 | 0.15 |
ENSRNOT00000065677
|
Cenpw
|
centromere protein W |
| chrX_+_65040775 | 0.15 |
ENSRNOT00000081354
|
Zc3h12b
|
zinc finger CCCH-type containing 12B |
| chr4_-_15859132 | 0.15 |
ENSRNOT00000082161
|
Cacna2d1
|
calcium voltage-gated channel auxiliary subunit alpha2delta 1 |
| chr2_-_230273709 | 0.15 |
ENSRNOT00000012587
|
Mcub
|
mitochondrial calcium uniporter dominant negative beta subunit |
| chr2_-_179704629 | 0.15 |
ENSRNOT00000083361
ENSRNOT00000077941 |
Gria2
|
glutamate ionotropic receptor AMPA type subunit 2 |
| chr18_-_57114545 | 0.15 |
ENSRNOT00000026495
|
Afap1l1
|
actin filament associated protein 1-like 1 |
| chrM_+_9870 | 0.15 |
ENSRNOT00000044582
|
Mt-nd4l
|
mitochondrially encoded NADH 4L dehydrogenase |
| chr2_+_248178389 | 0.15 |
ENSRNOT00000037339
|
Gbp5
|
guanylate binding protein 5 |
| chr1_-_67284864 | 0.15 |
ENSRNOT00000082908
|
LOC691661
|
similar to zinc finger and SCAN domain containing 4 |
| chr5_-_142933526 | 0.15 |
ENSRNOT00000048293
|
Cdca8
|
cell division cycle associated 8 |
| chr8_+_48657795 | 0.15 |
ENSRNOT00000013134
|
Dpagt1
|
dolichyl-phosphate N-acetylglucosaminephosphotransferase 1 |
| chr17_+_22619891 | 0.15 |
ENSRNOT00000060403
|
Adtrp
|
androgen-dependent TFPI-regulating protein |
| chr14_+_108415068 | 0.15 |
ENSRNOT00000083763
|
Pus10
|
pseudouridylate synthase 10 |
| chr5_-_12172009 | 0.15 |
ENSRNOT00000061903
|
Pcmtd1
|
protein-L-isoaspartate (D-aspartate) O-methyltransferase domain containing 1 |
| chr13_-_111972603 | 0.15 |
ENSRNOT00000007870
|
Hsd11b1
|
hydroxysteroid 11-beta dehydrogenase 1 |
| chr2_-_102919567 | 0.15 |
ENSRNOT00000072162
|
LOC100361143
|
ribosomal protein L30-like |
| chr2_+_149899836 | 0.15 |
ENSRNOT00000086481
|
RGD1560324
|
similar to hypothetical protein C130079G13 |
| chr12_-_51965779 | 0.15 |
ENSRNOT00000056733
|
LOC100362927
|
replication protein A3-like |
| chr1_+_91746486 | 0.14 |
ENSRNOT00000047772
|
AC136661.1
|
|
| chr14_-_46153212 | 0.14 |
ENSRNOT00000079269
|
Nwd2
|
NACHT and WD repeat domain containing 2 |
| chr5_+_6373583 | 0.14 |
ENSRNOT00000084749
|
AABR07046778.1
|
|
| chr7_-_74735650 | 0.14 |
ENSRNOT00000014407
|
Cox6c
|
cytochrome c oxidase subunit 6C |
| chr9_-_52912293 | 0.14 |
ENSRNOT00000005228
|
Slc40a1
|
solute carrier family 40 member 1 |
| chr7_+_70445366 | 0.14 |
ENSRNOT00000045687
|
RGD1565117
|
similar to 40S ribosomal protein S26 |
| chr14_-_67170361 | 0.14 |
ENSRNOT00000005477
|
Slit2
|
slit guidance ligand 2 |
| chr20_+_7718282 | 0.14 |
ENSRNOT00000000593
|
Scube3
|
signal peptide, CUB domain and EGF like domain containing 3 |
| chr17_-_78735324 | 0.14 |
ENSRNOT00000036299
|
Cdnf
|
cerebral dopamine neurotrophic factor |
| chr18_+_81821127 | 0.14 |
ENSRNOT00000058199
|
Fbxo15
|
F-box protein 15 |
| chr17_-_32783427 | 0.14 |
ENSRNOT00000059921
|
Serpinb6b
|
serine (or cysteine) peptidase inhibitor, clade B, member 6b |
| chr9_+_121831716 | 0.14 |
ENSRNOT00000056250
ENSRNOT00000056251 |
Yes1
|
YES proto-oncogene 1, Src family tyrosine kinase |
| chr2_+_204932159 | 0.14 |
ENSRNOT00000078376
|
Ngf
|
nerve growth factor |
| chr1_+_221558093 | 0.14 |
ENSRNOT00000077274
|
Majin
|
membrane anchored junction protein |
| chr7_-_116063078 | 0.14 |
ENSRNOT00000076932
ENSRNOT00000035496 |
Gml
|
glycosylphosphatidylinositol anchored molecule like |
| chr4_+_27365376 | 0.14 |
ENSRNOT00000010425
|
Mterf1
|
mitochondrial transcription termination factor 1 |
| chr8_-_132790778 | 0.14 |
ENSRNOT00000008255
ENSRNOT00000091431 |
Lztfl1
|
leucine zipper transcription factor-like 1 |
| chr13_-_111948753 | 0.14 |
ENSRNOT00000048074
|
Hsd11b1
|
hydroxysteroid 11-beta dehydrogenase 1 |
| chr13_+_83996080 | 0.14 |
ENSRNOT00000004403
ENSRNOT00000070958 |
Cd247
|
Cd247 molecule |
| chr7_-_3386522 | 0.14 |
ENSRNOT00000010760
|
Mettl7b
|
methyltransferase like 7B |
| chr1_-_103014388 | 0.13 |
ENSRNOT00000045719
|
Uevld
|
UEV and lactate/malate dehyrogenase domains |
| chr2_-_149432106 | 0.13 |
ENSRNOT00000051027
|
P2ry13
|
purinergic receptor P2Y13 |
| chr2_+_55835151 | 0.13 |
ENSRNOT00000018634
|
Fyb
|
FYN binding protein |
| chrX_+_908044 | 0.13 |
ENSRNOT00000072087
|
Zfp300
|
zinc finger protein 300 |
| chrM_+_7919 | 0.13 |
ENSRNOT00000046108
|
Mt-atp6
|
mitochondrially encoded ATP synthase 6 |
| chr8_-_63291966 | 0.13 |
ENSRNOT00000077762
|
AABR07070278.1
|
|
| chr1_-_169463760 | 0.13 |
ENSRNOT00000023100
|
Trim30c
|
tripartite motif-containing 30C |
| chr6_-_127534247 | 0.13 |
ENSRNOT00000012500
|
Serpina6
|
serpin family A member 6 |
| chr1_-_225830300 | 0.13 |
ENSRNOT00000072584
ENSRNOT00000027502 |
Scgb2a2
|
secretoglobin, family 2A, member 2 |
| chr2_-_34452895 | 0.13 |
ENSRNOT00000079385
|
AABR07007905.2
|
|
| chrX_+_152885246 | 0.13 |
ENSRNOT00000087074
|
AABR07042326.3
|
|
| chr5_-_75057752 | 0.13 |
ENSRNOT00000016447
|
Txn1
|
thioredoxin 1 |
| chr17_+_45078556 | 0.13 |
ENSRNOT00000088280
|
Zfp192
|
zinc finger protein 192 |
| chr1_+_221596148 | 0.13 |
ENSRNOT00000028536
|
Gpha2
|
glycoprotein hormone alpha 2 |
| chr8_+_55037750 | 0.13 |
ENSRNOT00000013188
|
Timm8b
|
translocase of inner mitochondrial membrane 8 homolog B |
| chr1_-_78180216 | 0.13 |
ENSRNOT00000071576
|
C5ar2
|
complement component 5a receptor 2 |
| chr1_-_266830976 | 0.13 |
ENSRNOT00000027450
|
Pcgf6
|
polycomb group ring finger 6 |
| chr6_+_86862790 | 0.13 |
ENSRNOT00000093492
|
Fancm
|
Fanconi anemia, complementation group M |
| chr1_-_233214758 | 0.13 |
ENSRNOT00000018951
|
Cep78
|
centrosomal protein 78 |
| chr3_+_110835683 | 0.13 |
ENSRNOT00000072130
|
LOC100911166
|
RNA pseudouridylate synthase domain-containing protein 2-like |
| chr17_+_66446569 | 0.13 |
ENSRNOT00000070825
|
Heatr1
|
HEAT repeat containing 1 |
| chr6_-_26685235 | 0.13 |
ENSRNOT00000066743
|
Atraid
|
all-trans retinoic acid-induced differentiation factor |
| chr1_+_48433079 | 0.13 |
ENSRNOT00000037369
|
Slc22a3
|
solute carrier family 22 member 3 |
| chr6_+_10533151 | 0.13 |
ENSRNOT00000020822
|
Rhoq
|
ras homolog family member Q |
| chr11_+_53081025 | 0.13 |
ENSRNOT00000002700
|
Bbx
|
BBX, HMG-box containing |
| chr6_+_30038777 | 0.13 |
ENSRNOT00000072340
|
Fam228b
|
family with sequence similarity 228, member B |
| chr9_+_81656116 | 0.13 |
ENSRNOT00000083421
|
Slc11a1
|
solute carrier family 11 member 1 |
| chr1_-_91663467 | 0.12 |
ENSRNOT00000033396
|
Faap24
|
Fanconi anemia core complex associated protein 24 |
| chr9_+_12346117 | 0.12 |
ENSRNOT00000074599
|
AABR07066677.1
|
|
| chr12_-_13462038 | 0.12 |
ENSRNOT00000043110
|
LOC100360439
|
ribosomal protein L36-like |
| chr1_+_211205903 | 0.12 |
ENSRNOT00000023139
|
Ppp2r2d
|
protein phosphatase 2, regulatory subunit B, delta |
| chr2_+_208749996 | 0.12 |
ENSRNOT00000086321
|
Chia
|
chitinase, acidic |
| chr1_-_233140237 | 0.12 |
ENSRNOT00000083372
|
Psat1
|
phosphoserine aminotransferase 1 |
| chrX_-_38196060 | 0.12 |
ENSRNOT00000006741
ENSRNOT00000006438 |
Sh3kbp1
|
SH3 domain-containing kinase-binding protein 1 |
| chr9_-_73948583 | 0.12 |
ENSRNOT00000018097
|
Myl1
|
myosin, light chain 1 |
| chr3_+_114918648 | 0.12 |
ENSRNOT00000089204
|
Sqrdl
|
sulfide quinone reductase-like (yeast) |
| chr14_-_15258207 | 0.12 |
ENSRNOT00000039383
|
Cxcl13
|
C-X-C motif chemokine ligand 13 |
| chrX_+_63542191 | 0.12 |
ENSRNOT00000073955
|
Apoo
|
apolipoprotein O |
| chr4_-_30380119 | 0.12 |
ENSRNOT00000036460
|
Pon2
|
paraoxonase 2 |
| chr10_+_64952119 | 0.12 |
ENSRNOT00000012154
|
Pipox
|
pipecolic acid and sarcosine oxidase |
| chr9_+_8349033 | 0.12 |
ENSRNOT00000073775
|
LOC100360856
|
hypothetical protein LOC100360856 |
| chr13_+_70157522 | 0.12 |
ENSRNOT00000036906
|
Apobec4
|
apolipoprotein B mRNA editing enzyme catalytic polypeptide like 4 |
| chr18_+_30004565 | 0.12 |
ENSRNOT00000027393
|
Pcdha4
|
protocadherin alpha 4 |
| chr17_-_21677477 | 0.12 |
ENSRNOT00000035448
|
Gcnt2
|
glucosaminyl (N-acetyl) transferase 2, I-branching enzyme |
| chr1_+_213766758 | 0.12 |
ENSRNOT00000005645
|
Ifitm1
|
interferon induced transmembrane protein 1 |
| chr3_+_5519990 | 0.12 |
ENSRNOT00000070873
ENSRNOT00000007640 |
Adamts13
|
ADAM metallopeptidase with thrombospondin type 1 motif, 13 |
| chr2_+_92559929 | 0.12 |
ENSRNOT00000033404
|
tGap1
|
GTPase activating protein testicular GAP1 |
| chr13_-_47916877 | 0.12 |
ENSRNOT00000006502
|
Dyrk3
|
dual specificity tyrosine phosphorylation regulated kinase 3 |
| chr19_+_33130303 | 0.12 |
ENSRNOT00000048673
|
LOC102550668
|
60S ribosomal protein L21-like |
| chr14_+_17228856 | 0.12 |
ENSRNOT00000003082
|
Cxcl9
|
C-X-C motif chemokine ligand 9 |
| chr2_+_227657983 | 0.12 |
ENSRNOT00000021116
|
Prss12
|
protease, serine 12 |
| chr1_-_252808380 | 0.12 |
ENSRNOT00000025856
|
Ch25h
|
cholesterol 25-hydroxylase |
| chr19_+_52086325 | 0.12 |
ENSRNOT00000020341
|
Necab2
|
N-terminal EF-hand calcium binding protein 2 |
| chr14_+_69800156 | 0.12 |
ENSRNOT00000072746
|
Lcorl
|
ligand dependent nuclear receptor corepressor-like |
| chr9_+_95161157 | 0.12 |
ENSRNOT00000071200
|
Ugt1a5
|
UDP glucuronosyltransferase family 1 member A5 |
| chr9_+_47281961 | 0.11 |
ENSRNOT00000065234
|
Slc9a4
|
solute carrier family 9 member A4 |
| chr2_+_211546560 | 0.11 |
ENSRNOT00000033443
|
Aknad1
|
AKNA domain containing 1 |
| chrM_+_10160 | 0.11 |
ENSRNOT00000042928
|
Mt-nd4
|
mitochondrially encoded NADH dehydrogenase 4 |
| chr15_+_27875911 | 0.11 |
ENSRNOT00000013582
|
Pnp
|
purine nucleoside phosphorylase |
| chr15_-_34342373 | 0.11 |
ENSRNOT00000080232
|
Nedd8
|
neural precursor cell expressed, developmentally down-regulated 8 |
| chr1_+_61374379 | 0.11 |
ENSRNOT00000015343
|
Zfp53
|
zinc finger protein 53 |
| chr7_+_74350479 | 0.11 |
ENSRNOT00000089034
|
AABR07057495.1
|
|
| chr11_+_77239098 | 0.11 |
ENSRNOT00000058701
|
Gmnc
|
geminin coiled-coil domain containing |
| chr18_-_24312950 | 0.11 |
ENSRNOT00000051911
|
LOC686074
|
similar to 60S ribosomal protein L35 |
| chrX_+_14994016 | 0.11 |
ENSRNOT00000006365
|
Ftsj1
|
FtsJ RNA methyltransferase homolog 1 (E. coli) |
| chr16_-_23156962 | 0.11 |
ENSRNOT00000018543
|
Sh2d4a
|
SH2 domain containing 4A |
| chr14_+_24129592 | 0.11 |
ENSRNOT00000040647
|
LOC689899
|
similar to 60S ribosomal protein L23a |
| chr10_-_98294522 | 0.11 |
ENSRNOT00000005489
|
Abca8
|
ATP binding cassette subfamily A member 8 |
| chr6_-_108329464 | 0.11 |
ENSRNOT00000016040
|
Abcd4
|
ATP binding cassette subfamily D member 4 |
| chr20_+_3979035 | 0.11 |
ENSRNOT00000000529
|
Tap1
|
transporter 1, ATP binding cassette subfamily B member |
| chr15_-_60752106 | 0.11 |
ENSRNOT00000058148
|
Akap11
|
A-kinase anchoring protein 11 |
| chr8_-_45137893 | 0.11 |
ENSRNOT00000010743
|
RGD1309108
|
similar to hypothetical protein FLJ23554 |
| chr5_+_118574801 | 0.11 |
ENSRNOT00000035949
|
Ube2u
|
ubiquitin-conjugating enzyme E2U (putative) |
| chr1_-_246110218 | 0.11 |
ENSRNOT00000077544
|
Rfx3
|
regulatory factor X3 |
| chr2_+_243425007 | 0.11 |
ENSRNOT00000082894
|
Trmt10a
|
tRNA methyltransferase 10A |
| chr2_+_27005863 | 0.11 |
ENSRNOT00000080864
|
Poc5
|
POC5 centriolar protein |
| chr2_+_30360100 | 0.11 |
ENSRNOT00000024456
|
Smn1
|
survival of motor neuron 1, telomeric |
| chr8_-_116531784 | 0.11 |
ENSRNOT00000024529
|
Rbm5
|
RNA binding motif protein 5 |
| chr8_-_39830306 | 0.11 |
ENSRNOT00000040901
|
Ccdc15
|
coiled-coil domain containing 15 |
| chr8_+_5768811 | 0.11 |
ENSRNOT00000013936
|
Mmp8
|
matrix metallopeptidase 8 |
| chr17_-_81187739 | 0.11 |
ENSRNOT00000063911
|
Hacd1
|
3-hydroxyacyl-CoA dehydratase 1 |
| chr4_-_163762434 | 0.11 |
ENSRNOT00000081854
|
Ly49si1
|
immunoreceptor Ly49si1 |
| chr12_-_5490935 | 0.11 |
ENSRNOT00000050885
|
Zfp958
|
zinc finger protein 958 |
| chr9_+_72933304 | 0.11 |
ENSRNOT00000041632
|
Crygf
|
crystallin, gamma F |
| chr12_-_24724997 | 0.11 |
ENSRNOT00000025560
|
Abhd11
|
abhydrolase domain containing 11 |
| chr8_-_90984224 | 0.11 |
ENSRNOT00000044931
|
Lca5
|
LCA5, lebercilin |
| chr17_-_10622226 | 0.11 |
ENSRNOT00000044559
|
Simc1
|
SUMO-interacting motifs containing 1 |
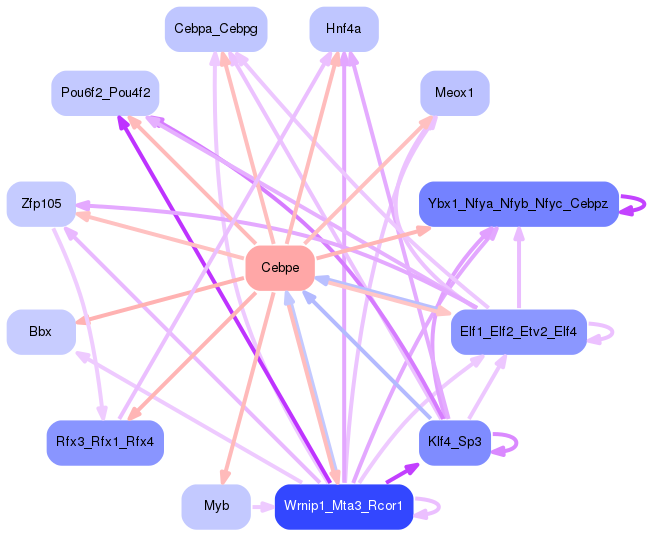
Network of associatons between targets according to the STRING database.

First level regulatory network of Cebpe
Gene Ontology Analysis
Gene overrepresentation in biological process category:
| Log-likelihood per target | Total log-likelihood | Term | Description |
|---|---|---|---|
| 0.1 | 0.5 | GO:2001190 | positive regulation of T cell activation via T cell receptor contact with antigen bound to MHC molecule on antigen presenting cell(GO:2001190) |
| 0.1 | 0.3 | GO:0071623 | negative regulation of granulocyte chemotaxis(GO:0071623) negative regulation of neutrophil chemotaxis(GO:0090024) |
| 0.1 | 0.5 | GO:2000354 | regulation of ovarian follicle development(GO:2000354) |
| 0.1 | 0.3 | GO:0006713 | glucocorticoid catabolic process(GO:0006713) |
| 0.1 | 0.3 | GO:0006117 | acetaldehyde metabolic process(GO:0006117) |
| 0.1 | 0.2 | GO:0000821 | regulation of arginine metabolic process(GO:0000821) negative regulation of nitric oxide mediated signal transduction(GO:0010751) negative regulation of cellular amino acid metabolic process(GO:0045763) |
| 0.1 | 0.3 | GO:0070839 | divalent metal ion export(GO:0070839) |
| 0.1 | 0.2 | GO:1902268 | negative regulation of polyamine transmembrane transport(GO:1902268) |
| 0.1 | 0.2 | GO:0061092 | regulation of phospholipid translocation(GO:0061091) positive regulation of phospholipid translocation(GO:0061092) |
| 0.1 | 0.2 | GO:2000078 | glandular epithelial cell maturation(GO:0002071) positive regulation of type B pancreatic cell development(GO:2000078) |
| 0.1 | 0.2 | GO:0050717 | positive regulation of interleukin-1 alpha secretion(GO:0050717) |
| 0.1 | 0.1 | GO:2001027 | negative regulation of endothelial cell chemotaxis(GO:2001027) |
| 0.1 | 0.2 | GO:0046351 | disaccharide biosynthetic process(GO:0046351) |
| 0.1 | 0.2 | GO:0036388 | pre-replicative complex assembly involved in nuclear cell cycle DNA replication(GO:0006267) pre-replicative complex assembly(GO:0036388) pre-replicative complex assembly involved in cell cycle DNA replication(GO:1902299) |
| 0.1 | 0.2 | GO:1904098 | interleukin-15-mediated signaling pathway(GO:0035723) cellular response to interleukin-15(GO:0071350) regulation of protein O-linked glycosylation(GO:1904098) positive regulation of protein O-linked glycosylation(GO:1904100) |
| 0.1 | 0.2 | GO:0042245 | RNA repair(GO:0042245) |
| 0.1 | 0.2 | GO:0032197 | transposition, RNA-mediated(GO:0032197) |
| 0.0 | 0.1 | GO:0001546 | preantral ovarian follicle growth(GO:0001546) multi-layer follicle stage(GO:0048162) |
| 0.0 | 0.5 | GO:0042738 | exogenous drug catabolic process(GO:0042738) |
| 0.0 | 0.2 | GO:0071799 | response to prostaglandin D(GO:0071798) cellular response to prostaglandin D stimulus(GO:0071799) |
| 0.0 | 0.2 | GO:0031119 | tRNA pseudouridine synthesis(GO:0031119) |
| 0.0 | 0.2 | GO:0051792 | medium-chain fatty acid biosynthetic process(GO:0051792) |
| 0.0 | 0.2 | GO:1901509 | regulation of endothelial tube morphogenesis(GO:1901509) |
| 0.0 | 0.1 | GO:0072209 | mesangial cell-matrix adhesion(GO:0035759) positive regulation of granulocyte colony-stimulating factor production(GO:0071657) metanephric mesangial cell differentiation(GO:0072209) metanephric glomerular mesangial cell differentiation(GO:0072254) positive regulation of macrophage colony-stimulating factor production(GO:1901258) |
| 0.0 | 0.3 | GO:0098706 | ferric iron import into cell(GO:0097461) ferric iron import across plasma membrane(GO:0098706) |
| 0.0 | 0.1 | GO:0046495 | nicotinamide riboside catabolic process(GO:0006738) urate biosynthetic process(GO:0034418) nicotinamide riboside metabolic process(GO:0046495) pyridine nucleoside metabolic process(GO:0070637) pyridine nucleoside catabolic process(GO:0070638) |
| 0.0 | 0.1 | GO:0046968 | cytosol to ER transport(GO:0046967) peptide antigen transport(GO:0046968) |
| 0.0 | 0.3 | GO:0070459 | prolactin secretion(GO:0070459) |
| 0.0 | 0.1 | GO:0071529 | cementum mineralization(GO:0071529) |
| 0.0 | 0.1 | GO:0009822 | lipid hydroxylation(GO:0002933) alkaloid catabolic process(GO:0009822) |
| 0.0 | 0.1 | GO:1902569 | regulation of activation of JAK2 kinase activity(GO:0010534) activation of JAK2 kinase activity(GO:0042977) negative regulation of activation of JAK2 kinase activity(GO:1902569) |
| 0.0 | 0.2 | GO:0045590 | negative regulation of regulatory T cell differentiation(GO:0045590) |
| 0.0 | 0.1 | GO:1903564 | regulation of protein localization to cilium(GO:1903564) |
| 0.0 | 0.1 | GO:0006121 | mitochondrial electron transport, succinate to ubiquinone(GO:0006121) |
| 0.0 | 0.1 | GO:0006554 | lysine catabolic process(GO:0006554) L-lysine catabolic process to acetyl-CoA(GO:0019474) L-lysine catabolic process(GO:0019477) L-lysine metabolic process(GO:0046440) |
| 0.0 | 0.2 | GO:0019348 | dolichol metabolic process(GO:0019348) |
| 0.0 | 0.3 | GO:0052697 | xenobiotic glucuronidation(GO:0052697) |
| 0.0 | 0.2 | GO:0006068 | ethanol catabolic process(GO:0006068) |
| 0.0 | 0.1 | GO:0051037 | regulation of transcription involved in meiotic cell cycle(GO:0051037) |
| 0.0 | 0.2 | GO:0086048 | membrane depolarization during bundle of His cell action potential(GO:0086048) |
| 0.0 | 0.1 | GO:0071492 | cellular response to UV-A(GO:0071492) |
| 0.0 | 0.1 | GO:1900039 | positive regulation of cellular response to hypoxia(GO:1900039) |
| 0.0 | 0.1 | GO:2000845 | positive regulation of testosterone secretion(GO:2000845) |
| 0.0 | 0.1 | GO:1904569 | regulation of selenocysteine incorporation(GO:1904569) |
| 0.0 | 0.2 | GO:0009235 | cobalamin metabolic process(GO:0009235) |
| 0.0 | 0.1 | GO:0045356 | positive regulation of interferon-alpha biosynthetic process(GO:0045356) |
| 0.0 | 0.1 | GO:0001574 | ganglioside biosynthetic process(GO:0001574) |
| 0.0 | 0.1 | GO:0090038 | negative regulation of protein kinase C signaling(GO:0090038) |
| 0.0 | 0.2 | GO:0002759 | regulation of antimicrobial humoral response(GO:0002759) |
| 0.0 | 0.1 | GO:2000978 | gastrin-induced gastric acid secretion(GO:0001698) positive regulation of actin filament-based movement(GO:1903116) negative regulation of forebrain neuron differentiation(GO:2000978) |
| 0.0 | 0.1 | GO:0045079 | negative regulation of chemokine biosynthetic process(GO:0045079) |
| 0.0 | 0.2 | GO:0034625 | fatty acid elongation, monounsaturated fatty acid(GO:0034625) |
| 0.0 | 0.1 | GO:0042496 | detection of diacyl bacterial lipopeptide(GO:0042496) detection of bacterial lipopeptide(GO:0070340) |
| 0.0 | 0.1 | GO:0033076 | isoquinoline alkaloid metabolic process(GO:0033076) phytoalexin metabolic process(GO:0052314) |
| 0.0 | 0.8 | GO:0035458 | cellular response to interferon-beta(GO:0035458) |
| 0.0 | 0.1 | GO:2000814 | positive regulation of barbed-end actin filament capping(GO:2000814) |
| 0.0 | 0.1 | GO:0032621 | interleukin-18 production(GO:0032621) |
| 0.0 | 0.1 | GO:0006032 | chitin metabolic process(GO:0006030) chitin catabolic process(GO:0006032) |
| 0.0 | 0.1 | GO:0006564 | L-serine biosynthetic process(GO:0006564) |
| 0.0 | 0.1 | GO:0060382 | regulation of DNA strand elongation(GO:0060382) |
| 0.0 | 0.0 | GO:0071613 | granzyme B production(GO:0071613) regulation of granzyme B production(GO:0071661) positive regulation of granzyme B production(GO:0071663) |
| 0.0 | 0.1 | GO:0035617 | stress granule disassembly(GO:0035617) |
| 0.0 | 0.1 | GO:0034421 | post-translational protein acetylation(GO:0034421) |
| 0.0 | 0.2 | GO:0006384 | transcription initiation from RNA polymerase III promoter(GO:0006384) |
| 0.0 | 0.1 | GO:0060369 | positive regulation of Fc receptor mediated stimulatory signaling pathway(GO:0060369) |
| 0.0 | 0.3 | GO:0006353 | DNA-templated transcription, termination(GO:0006353) |
| 0.0 | 0.1 | GO:0002462 | tolerance induction to nonself antigen(GO:0002462) |
| 0.0 | 0.3 | GO:0001865 | NK T cell differentiation(GO:0001865) |
| 0.0 | 0.1 | GO:0002125 | maternal aggressive behavior(GO:0002125) |
| 0.0 | 0.1 | GO:0034310 | primary alcohol catabolic process(GO:0034310) |
| 0.0 | 0.1 | GO:0040032 | post-embryonic body morphogenesis(GO:0040032) |
| 0.0 | 0.2 | GO:0043983 | histone H4-K12 acetylation(GO:0043983) |
| 0.0 | 0.1 | GO:0034626 | fatty acid elongation, polyunsaturated fatty acid(GO:0034626) |
| 0.0 | 0.1 | GO:0019516 | lactate oxidation(GO:0019516) |
| 0.0 | 0.1 | GO:0001757 | somite specification(GO:0001757) |
| 0.0 | 0.1 | GO:0035627 | ceramide transport(GO:0035627) |
| 0.0 | 0.1 | GO:2000539 | positive regulation of synaptic growth at neuromuscular junction(GO:0045887) regulation of protein geranylgeranylation(GO:2000539) positive regulation of protein geranylgeranylation(GO:2000541) |
| 0.0 | 0.0 | GO:0072716 | response to actinomycin D(GO:0072716) cellular response to actinomycin D(GO:0072717) |
| 0.0 | 0.1 | GO:0048254 | snoRNA localization(GO:0048254) |
| 0.0 | 0.0 | GO:0018364 | peptidyl-glutamine methylation(GO:0018364) |
| 0.0 | 0.2 | GO:0007021 | tubulin complex assembly(GO:0007021) |
| 0.0 | 0.1 | GO:0070782 | phosphatidylserine exposure on apoptotic cell surface(GO:0070782) |
| 0.0 | 0.1 | GO:1902988 | regulation of neuronal signal transduction(GO:1902847) positive regulation of tau-protein kinase activity(GO:1902949) neurofibrillary tangle assembly(GO:1902988) regulation of neurofibrillary tangle assembly(GO:1902996) positive regulation of neurofibrillary tangle assembly(GO:1902998) |
| 0.0 | 0.4 | GO:0001522 | pseudouridine synthesis(GO:0001522) |
| 0.0 | 0.1 | GO:0016480 | negative regulation of transcription from RNA polymerase III promoter(GO:0016480) |
| 0.0 | 0.1 | GO:0010070 | zygote asymmetric cell division(GO:0010070) |
| 0.0 | 0.1 | GO:0036438 | maintenance of lens transparency(GO:0036438) |
| 0.0 | 0.1 | GO:0061589 | calcium activated phosphatidylserine scrambling(GO:0061589) |
| 0.0 | 0.2 | GO:0046618 | drug export(GO:0046618) |
| 0.0 | 0.1 | GO:1990918 | double-strand break repair involved in meiotic recombination(GO:1990918) |
| 0.0 | 0.1 | GO:0071226 | positive regulation of type I hypersensitivity(GO:0001812) cellular response to molecule of fungal origin(GO:0071226) |
| 0.0 | 0.0 | GO:0035338 | long-chain fatty-acyl-CoA biosynthetic process(GO:0035338) |
| 0.0 | 0.1 | GO:0060830 | ciliary receptor clustering involved in smoothened signaling pathway(GO:0060830) |
| 0.0 | 0.1 | GO:0009826 | unidimensional cell growth(GO:0009826) |
| 0.0 | 0.1 | GO:0019086 | late viral transcription(GO:0019086) |
| 0.0 | 0.2 | GO:0006735 | NADH regeneration(GO:0006735) canonical glycolysis(GO:0061621) glucose catabolic process to pyruvate(GO:0061718) |
| 0.0 | 0.1 | GO:0009804 | coumarin metabolic process(GO:0009804) |
| 0.0 | 0.3 | GO:0019886 | antigen processing and presentation of exogenous peptide antigen via MHC class II(GO:0019886) |
| 0.0 | 0.1 | GO:0039020 | pronephric nephron tubule development(GO:0039020) |
| 0.0 | 0.1 | GO:0044571 | [2Fe-2S] cluster assembly(GO:0044571) |
| 0.0 | 0.1 | GO:0051388 | positive regulation of neurotrophin TRK receptor signaling pathway(GO:0051388) |
| 0.0 | 0.1 | GO:0045039 | protein import into mitochondrial inner membrane(GO:0045039) |
| 0.0 | 0.1 | GO:0030497 | fatty acid elongation(GO:0030497) |
| 0.0 | 0.1 | GO:0006203 | dGTP catabolic process(GO:0006203) |
| 0.0 | 0.1 | GO:0001682 | tRNA 5'-leader removal(GO:0001682) |
| 0.0 | 0.2 | GO:0035754 | B cell chemotaxis(GO:0035754) |
| 0.0 | 0.0 | GO:0045799 | positive regulation of chromatin assembly or disassembly(GO:0045799) |
| 0.0 | 0.1 | GO:1905168 | positive regulation of double-strand break repair via homologous recombination(GO:1905168) |
| 0.0 | 0.0 | GO:0033385 | geranylgeranyl diphosphate metabolic process(GO:0033385) geranylgeranyl diphosphate biosynthetic process(GO:0033386) |
| 0.0 | 0.1 | GO:2000857 | positive regulation of mineralocorticoid secretion(GO:2000857) positive regulation of aldosterone secretion(GO:2000860) |
| 0.0 | 0.1 | GO:0006041 | glucosamine metabolic process(GO:0006041) |
| 0.0 | 0.1 | GO:1900454 | positive regulation of long term synaptic depression(GO:1900454) |
| 0.0 | 0.1 | GO:0044004 | killing by symbiont of host cells(GO:0001907) disruption by symbiont of host cell(GO:0044004) |
| 0.0 | 0.1 | GO:0018406 | protein C-linked glycosylation(GO:0018103) peptidyl-tryptophan modification(GO:0018211) protein C-linked glycosylation via tryptophan(GO:0018317) protein C-linked glycosylation via 2'-alpha-mannosyl-L-tryptophan(GO:0018406) |
| 0.0 | 0.1 | GO:0000957 | mitochondrial RNA catabolic process(GO:0000957) regulation of mitochondrial RNA catabolic process(GO:0000960) |
| 0.0 | 0.1 | GO:0071787 | endoplasmic reticulum tubular network assembly(GO:0071787) |
| 0.0 | 0.0 | GO:0003249 | cell proliferation involved in heart valve morphogenesis(GO:0003249) regulation of cell proliferation involved in heart valve morphogenesis(GO:0003250) negative regulation of cell proliferation involved in heart morphogenesis(GO:2000137) |
| 0.0 | 0.1 | GO:1903361 | protein localization to basolateral plasma membrane(GO:1903361) |
| 0.0 | 0.1 | GO:0018242 | protein O-linked glycosylation via serine(GO:0018242) |
| 0.0 | 0.1 | GO:2000848 | positive regulation of saliva secretion(GO:0046878) positive regulation of corticosteroid hormone secretion(GO:2000848) positive regulation of glucocorticoid secretion(GO:2000851) |
| 0.0 | 0.1 | GO:0070245 | positive regulation of thymocyte apoptotic process(GO:0070245) |
| 0.0 | 0.0 | GO:0060474 | positive regulation of sperm motility involved in capacitation(GO:0060474) |
| 0.0 | 0.2 | GO:0070197 | meiotic telomere tethering at nuclear periphery(GO:0044821) meiotic attachment of telomere to nuclear envelope(GO:0070197) chromosome attachment to the nuclear envelope(GO:0097240) |
| 0.0 | 0.1 | GO:0006362 | transcription elongation from RNA polymerase I promoter(GO:0006362) |
| 0.0 | 0.1 | GO:0015697 | quaternary ammonium group transport(GO:0015697) |
| 0.0 | 0.1 | GO:0021914 | negative regulation of smoothened signaling pathway involved in ventral spinal cord patterning(GO:0021914) |
| 0.0 | 0.2 | GO:0007175 | negative regulation of epidermal growth factor-activated receptor activity(GO:0007175) |
| 0.0 | 0.1 | GO:1903593 | regulation of histamine secretion by mast cell(GO:1903593) |
| 0.0 | 0.1 | GO:0006269 | DNA replication, synthesis of RNA primer(GO:0006269) |
| 0.0 | 0.2 | GO:0051024 | positive regulation of immunoglobulin secretion(GO:0051024) |
| 0.0 | 0.0 | GO:0000973 | posttranscriptional tethering of RNA polymerase II gene DNA at nuclear periphery(GO:0000973) |
| 0.0 | 0.1 | GO:0009115 | xanthine catabolic process(GO:0009115) |
| 0.0 | 0.2 | GO:0001580 | detection of chemical stimulus involved in sensory perception of bitter taste(GO:0001580) |
| 0.0 | 0.0 | GO:0002277 | myeloid dendritic cell activation involved in immune response(GO:0002277) |
| 0.0 | 0.1 | GO:0031860 | telomeric 3' overhang formation(GO:0031860) |
| 0.0 | 0.1 | GO:0000395 | mRNA 5'-splice site recognition(GO:0000395) |
| 0.0 | 0.0 | GO:0051594 | detection of carbohydrate stimulus(GO:0009730) detection of hexose stimulus(GO:0009732) detection of monosaccharide stimulus(GO:0034287) detection of glucose(GO:0051594) |
| 0.0 | 0.0 | GO:1901668 | regulation of superoxide dismutase activity(GO:1901668) |
| 0.0 | 0.4 | GO:0015985 | energy coupled proton transport, down electrochemical gradient(GO:0015985) ATP synthesis coupled proton transport(GO:0015986) |
| 0.0 | 0.2 | GO:0007512 | adult heart development(GO:0007512) |
| 0.0 | 0.0 | GO:0046864 | isoprenoid transport(GO:0046864) terpenoid transport(GO:0046865) |
| 0.0 | 0.1 | GO:0015705 | iodide transport(GO:0015705) |
| 0.0 | 0.1 | GO:0038169 | somatostatin receptor signaling pathway(GO:0038169) somatostatin signaling pathway(GO:0038170) |
| 0.0 | 0.2 | GO:0033617 | mitochondrial respiratory chain complex IV assembly(GO:0033617) |
| 0.0 | 0.1 | GO:0001561 | fatty acid alpha-oxidation(GO:0001561) |
| 0.0 | 0.1 | GO:0038044 | transforming growth factor-beta secretion(GO:0038044) |
| 0.0 | 0.0 | GO:0070084 | protein initiator methionine removal(GO:0070084) |
| 0.0 | 0.1 | GO:0038095 | Fc-epsilon receptor signaling pathway(GO:0038095) |
| 0.0 | 0.0 | GO:0021508 | floor plate formation(GO:0021508) floor plate morphogenesis(GO:0033505) |
| 0.0 | 0.0 | GO:0042726 | flavin-containing compound metabolic process(GO:0042726) |
| 0.0 | 0.2 | GO:0000712 | resolution of meiotic recombination intermediates(GO:0000712) |
| 0.0 | 0.1 | GO:0002091 | negative regulation of receptor internalization(GO:0002091) |
| 0.0 | 0.0 | GO:0030043 | actin filament fragmentation(GO:0030043) |
| 0.0 | 0.1 | GO:0048478 | replication fork protection(GO:0048478) |
| 0.0 | 0.0 | GO:1902626 | assembly of large subunit precursor of preribosome(GO:1902626) |
| 0.0 | 0.2 | GO:1901741 | positive regulation of myoblast fusion(GO:1901741) |
| 0.0 | 0.1 | GO:0036444 | calcium ion transmembrane import into mitochondrion(GO:0036444) |
| 0.0 | 0.1 | GO:0051182 | coenzyme transport(GO:0051182) |
| 0.0 | 0.3 | GO:0006120 | mitochondrial electron transport, NADH to ubiquinone(GO:0006120) |
| 0.0 | 0.1 | GO:0006490 | oligosaccharide-lipid intermediate biosynthetic process(GO:0006490) |
| 0.0 | 0.1 | GO:0060287 | epithelial cilium movement involved in determination of left/right asymmetry(GO:0060287) |
| 0.0 | 0.1 | GO:0030259 | lipid glycosylation(GO:0030259) |
| 0.0 | 0.1 | GO:0097068 | response to thyroxine(GO:0097068) |
| 0.0 | 0.1 | GO:0009758 | carbohydrate utilization(GO:0009758) |
| 0.0 | 0.1 | GO:0016191 | synaptic vesicle uncoating(GO:0016191) |
| 0.0 | 0.1 | GO:0046598 | positive regulation of viral entry into host cell(GO:0046598) |
| 0.0 | 0.0 | GO:0007499 | ectoderm and mesoderm interaction(GO:0007499) |
| 0.0 | 0.0 | GO:0002296 | T-helper 1 cell lineage commitment(GO:0002296) |
| 0.0 | 0.2 | GO:0042448 | progesterone metabolic process(GO:0042448) |
| 0.0 | 0.1 | GO:0043031 | negative regulation of macrophage activation(GO:0043031) |
| 0.0 | 0.3 | GO:0031571 | mitotic G1 DNA damage checkpoint(GO:0031571) |
| 0.0 | 0.0 | GO:0030578 | PML body organization(GO:0030578) positive regulation of calcium-transporting ATPase activity(GO:1901896) |
| 0.0 | 0.1 | GO:0009438 | methylglyoxal metabolic process(GO:0009438) |
| 0.0 | 0.1 | GO:0034627 | 'de novo' NAD biosynthetic process(GO:0034627) |
| 0.0 | 0.1 | GO:0036123 | histone H3-K9 dimethylation(GO:0036123) |
| 0.0 | 0.0 | GO:0021698 | cerebellar cortex structural organization(GO:0021698) |
| 0.0 | 0.0 | GO:1904879 | positive regulation of calcium ion transmembrane transport via high voltage-gated calcium channel(GO:1904879) |
| 0.0 | 0.1 | GO:0045078 | positive regulation of interferon-gamma biosynthetic process(GO:0045078) |
| 0.0 | 0.0 | GO:0022605 | oogenesis stage(GO:0022605) |
| 0.0 | 0.2 | GO:0051383 | kinetochore organization(GO:0051383) |
| 0.0 | 0.0 | GO:0035720 | intraciliary anterograde transport(GO:0035720) |
| 0.0 | 0.0 | GO:0045409 | negative regulation of interleukin-6 biosynthetic process(GO:0045409) |
| 0.0 | 0.1 | GO:2000234 | positive regulation of ribosome biogenesis(GO:0090070) positive regulation of rRNA processing(GO:2000234) |
| 0.0 | 0.1 | GO:0060391 | positive regulation of SMAD protein import into nucleus(GO:0060391) |
| 0.0 | 0.1 | GO:2000348 | regulation of CD40 signaling pathway(GO:2000348) |
| 0.0 | 0.0 | GO:1902856 | negative regulation of nonmotile primary cilium assembly(GO:1902856) |
| 0.0 | 0.1 | GO:0098719 | sodium ion import across plasma membrane(GO:0098719) sodium ion import into cell(GO:1990118) |
| 0.0 | 0.1 | GO:2000483 | negative regulation of interleukin-8 secretion(GO:2000483) |
| 0.0 | 0.2 | GO:0060736 | prostate gland growth(GO:0060736) |
| 0.0 | 0.1 | GO:0060449 | bud elongation involved in lung branching(GO:0060449) |
| 0.0 | 0.1 | GO:0071684 | blastocyst hatching(GO:0001835) hatching(GO:0035188) organism emergence from protective structure(GO:0071684) |
| 0.0 | 0.0 | GO:0016332 | establishment or maintenance of polarity of embryonic epithelium(GO:0016332) |
| 0.0 | 0.0 | GO:0021502 | neural fold elevation formation(GO:0021502) |
| 0.0 | 0.0 | GO:0040009 | regulation of growth rate(GO:0040009) |
Gene overrepresentation in cellular component category:
| Log-likelihood per target | Total log-likelihood | Term | Description |
|---|---|---|---|
| 0.1 | 0.5 | GO:1990005 | granular vesicle(GO:1990005) |
| 0.1 | 0.1 | GO:0000439 | core TFIIH complex(GO:0000439) |
| 0.1 | 0.3 | GO:0020005 | symbiont-containing vacuole membrane(GO:0020005) |
| 0.1 | 0.2 | GO:0005656 | nuclear pre-replicative complex(GO:0005656) pre-replicative complex(GO:0036387) |
| 0.1 | 0.2 | GO:0070821 | tertiary granule membrane(GO:0070821) |
| 0.1 | 0.3 | GO:0072557 | IPAF inflammasome complex(GO:0072557) |
| 0.0 | 0.1 | GO:0045283 | mitochondrial respiratory chain complex II, succinate dehydrogenase complex (ubiquinone)(GO:0005749) succinate dehydrogenase complex (ubiquinone)(GO:0045257) fumarate reductase complex(GO:0045283) |
| 0.0 | 0.1 | GO:0035692 | macrophage migration inhibitory factor receptor complex(GO:0035692) |
| 0.0 | 0.4 | GO:0042613 | MHC class II protein complex(GO:0042613) |
| 0.0 | 0.1 | GO:0034455 | t-UTP complex(GO:0034455) |
| 0.0 | 0.1 | GO:0097209 | epidermal lamellar body(GO:0097209) |
| 0.0 | 0.4 | GO:0043240 | Fanconi anaemia nuclear complex(GO:0043240) |
| 0.0 | 0.1 | GO:0033503 | HULC complex(GO:0033503) |
| 0.0 | 0.1 | GO:0005896 | interleukin-6 receptor complex(GO:0005896) |
| 0.0 | 0.1 | GO:0035355 | Toll-like receptor 2-Toll-like receptor 6 protein complex(GO:0035355) |
| 0.0 | 0.2 | GO:0034464 | BBSome(GO:0034464) |
| 0.0 | 0.1 | GO:0005607 | laminin-2 complex(GO:0005607) |
| 0.0 | 0.2 | GO:0097504 | Gemini of coiled bodies(GO:0097504) |
| 0.0 | 0.1 | GO:0032133 | chromosome passenger complex(GO:0032133) |
| 0.0 | 0.1 | GO:0070761 | pre-snoRNP complex(GO:0070761) |
| 0.0 | 0.1 | GO:0000220 | vacuolar proton-transporting V-type ATPase, V0 domain(GO:0000220) |
| 0.0 | 0.1 | GO:0000221 | vacuolar proton-transporting V-type ATPase, V1 domain(GO:0000221) |
| 0.0 | 0.1 | GO:1990246 | uniplex complex(GO:1990246) |
| 0.0 | 0.2 | GO:0000124 | SAGA complex(GO:0000124) |
| 0.0 | 0.3 | GO:0045263 | proton-transporting ATP synthase complex, coupling factor F(o)(GO:0045263) |
| 0.0 | 0.1 | GO:0045025 | mitochondrial degradosome(GO:0045025) |
| 0.0 | 0.2 | GO:0005796 | Golgi lumen(GO:0005796) |
| 0.0 | 0.3 | GO:0045277 | respiratory chain complex IV(GO:0045277) |
| 0.0 | 0.2 | GO:0090576 | RNA polymerase III transcription factor complex(GO:0090576) |
| 0.0 | 0.1 | GO:0070939 | Dsl1p complex(GO:0070939) |
| 0.0 | 0.1 | GO:0043541 | UDP-N-acetylglucosamine transferase complex(GO:0043541) |
| 0.0 | 0.2 | GO:0031313 | extrinsic component of endosome membrane(GO:0031313) |
| 0.0 | 0.1 | GO:0036194 | muscle cell projection(GO:0036194) muscle cell projection membrane(GO:0036195) |
| 0.0 | 0.0 | GO:0033165 | interphotoreceptor matrix(GO:0033165) |
| 0.0 | 0.1 | GO:1990769 | proximal neuron projection(GO:1990769) |
| 0.0 | 0.1 | GO:0008024 | cyclin/CDK positive transcription elongation factor complex(GO:0008024) |
| 0.0 | 0.1 | GO:0097451 | glial limiting end-foot(GO:0097451) |
| 0.0 | 0.1 | GO:0061617 | MICOS complex(GO:0061617) |
| 0.0 | 0.1 | GO:0031262 | Ndc80 complex(GO:0031262) |
| 0.0 | 0.0 | GO:0030690 | Noc1p-Noc2p complex(GO:0030690) |
| 0.0 | 0.1 | GO:0042719 | mitochondrial intermembrane space protein transporter complex(GO:0042719) |
| 0.0 | 0.1 | GO:0070032 | synaptobrevin 2-SNAP-25-syntaxin-1a-complexin I complex(GO:0070032) |
| 0.0 | 0.1 | GO:0005658 | alpha DNA polymerase:primase complex(GO:0005658) |
| 0.0 | 0.0 | GO:0071942 | XPC complex(GO:0071942) |
| 0.0 | 0.2 | GO:0005675 | holo TFIIH complex(GO:0005675) |
| 0.0 | 0.2 | GO:1990454 | L-type voltage-gated calcium channel complex(GO:1990454) |
| 0.0 | 0.2 | GO:0098839 | postsynaptic density membrane(GO:0098839) |
| 0.0 | 0.3 | GO:0008074 | guanylate cyclase complex, soluble(GO:0008074) |
| 0.0 | 0.1 | GO:0016471 | vacuolar proton-transporting V-type ATPase complex(GO:0016471) |
| 0.0 | 0.0 | GO:0036156 | inner dynein arm(GO:0036156) |
| 0.0 | 0.1 | GO:0005579 | membrane attack complex(GO:0005579) |
| 0.0 | 0.1 | GO:0002142 | stereocilia ankle link complex(GO:0002142) USH2 complex(GO:1990696) |
| 0.0 | 0.1 | GO:0097542 | ciliary tip(GO:0097542) |
| 0.0 | 0.0 | GO:0031510 | SUMO activating enzyme complex(GO:0031510) |
| 0.0 | 0.1 | GO:0005683 | U7 snRNP(GO:0005683) |
| 0.0 | 0.1 | GO:0044305 | calyx of Held(GO:0044305) |
| 0.0 | 0.3 | GO:0097228 | sperm principal piece(GO:0097228) |
| 0.0 | 0.8 | GO:0022627 | cytosolic small ribosomal subunit(GO:0022627) |
| 0.0 | 0.1 | GO:0071797 | LUBAC complex(GO:0071797) |
| 0.0 | 0.1 | GO:0031390 | Ctf18 RFC-like complex(GO:0031390) |
| 0.0 | 0.1 | GO:0046581 | intercellular canaliculus(GO:0046581) |
| 0.0 | 0.1 | GO:0009331 | glycerol-3-phosphate dehydrogenase complex(GO:0009331) |
| 0.0 | 0.2 | GO:0005753 | mitochondrial proton-transporting ATP synthase complex(GO:0005753) proton-transporting ATP synthase complex(GO:0045259) |
| 0.0 | 0.2 | GO:0005685 | U1 snRNP(GO:0005685) |
| 0.0 | 0.2 | GO:0071437 | invadopodium(GO:0071437) |
Gene overrepresentation in molecular function category:
| Log-likelihood per target | Total log-likelihood | Term | Description |
|---|---|---|---|
| 0.1 | 0.3 | GO:0003845 | 11-beta-hydroxysteroid dehydrogenase [NAD(P)] activity(GO:0003845) |
| 0.1 | 0.4 | GO:0048248 | CXCR3 chemokine receptor binding(GO:0048248) |
| 0.1 | 0.2 | GO:0008073 | ornithine decarboxylase inhibitor activity(GO:0008073) polyamine transmembrane transporter activity(GO:0015203) putrescine transmembrane transporter activity(GO:0015489) |
| 0.1 | 0.2 | GO:0004956 | prostaglandin D receptor activity(GO:0004956) |
| 0.1 | 0.2 | GO:0003976 | UDP-N-acetylglucosamine-lysosomal-enzyme N-acetylglucosaminephosphotransferase activity(GO:0003976) |
| 0.1 | 0.2 | GO:0004315 | 3-oxoacyl-[acyl-carrier-protein] synthase activity(GO:0004315) |
| 0.1 | 0.2 | GO:0004963 | follicle-stimulating hormone receptor activity(GO:0004963) |
| 0.1 | 0.3 | GO:0008823 | cupric reductase activity(GO:0008823) ferric-chelate reductase (NADPH) activity(GO:0052851) |
| 0.1 | 0.2 | GO:0001847 | opsonin receptor activity(GO:0001847) |
| 0.1 | 0.2 | GO:0086057 | voltage-gated calcium channel activity involved in bundle of His cell action potential(GO:0086057) |
| 0.1 | 0.2 | GO:0015292 | uniporter activity(GO:0015292) |
| 0.0 | 0.3 | GO:0048030 | disaccharide binding(GO:0048030) |
| 0.0 | 0.3 | GO:0004024 | alcohol dehydrogenase activity, zinc-dependent(GO:0004024) |
| 0.0 | 0.1 | GO:0032427 | GBD domain binding(GO:0032427) |
| 0.0 | 0.2 | GO:0070579 | methylcytosine dioxygenase activity(GO:0070579) |
| 0.0 | 0.2 | GO:0000995 | transcription factor activity, core RNA polymerase III binding(GO:0000995) TFIIIC-class transcription factor binding(GO:0001156) |
| 0.0 | 0.1 | GO:0046573 | lactonohydrolase activity(GO:0046573) acyl-L-homoserine-lactone lactonohydrolase activity(GO:0102007) |
| 0.0 | 0.2 | GO:0061575 | cyclin-dependent protein serine/threonine kinase activator activity(GO:0061575) |
| 0.0 | 0.1 | GO:0004731 | purine nucleobase binding(GO:0002060) purine-nucleoside phosphorylase activity(GO:0004731) |
| 0.0 | 0.6 | GO:0009982 | pseudouridine synthase activity(GO:0009982) |
| 0.0 | 0.1 | GO:0019863 | IgE binding(GO:0019863) |
| 0.0 | 0.1 | GO:0015433 | peptide antigen-transporting ATPase activity(GO:0015433) tapasin binding(GO:0046980) |
| 0.0 | 0.1 | GO:0004719 | protein-L-isoaspartate (D-aspartate) O-methyltransferase activity(GO:0004719) |
| 0.0 | 0.1 | GO:0102344 | 3-hydroxy-behenoyl-CoA dehydratase activity(GO:0102344) 3-hydroxy-lignoceroyl-CoA dehydratase activity(GO:0102345) |
| 0.0 | 0.1 | GO:0005163 | nerve growth factor receptor binding(GO:0005163) |
| 0.0 | 0.1 | GO:0035614 | snRNA stem-loop binding(GO:0035614) |
| 0.0 | 0.1 | GO:0018812 | 3-hydroxyacyl-CoA dehydratase activity(GO:0018812) |
| 0.0 | 0.1 | GO:0008177 | succinate dehydrogenase (ubiquinone) activity(GO:0008177) |
| 0.0 | 0.1 | GO:0004058 | aromatic-L-amino-acid decarboxylase activity(GO:0004058) L-dopa decarboxylase activity(GO:0036468) |
| 0.0 | 0.1 | GO:0016899 | oxidoreductase activity, acting on the CH-OH group of donors, oxygen as acceptor(GO:0016899) |
| 0.0 | 0.1 | GO:0047023 | androsterone dehydrogenase activity(GO:0047023) |
| 0.0 | 0.1 | GO:0019767 | IgE receptor activity(GO:0019767) |
| 0.0 | 0.2 | GO:0001075 | transcription factor activity, RNA polymerase II core promoter sequence-specific binding involved in preinitiation complex assembly(GO:0001075) |
| 0.0 | 0.1 | GO:0016716 | oxidoreductase activity, acting on paired donors, with incorporation or reduction of molecular oxygen, another compound as one donor, and incorporation of one atom of oxygen(GO:0016716) |
| 0.0 | 0.9 | GO:0070330 | aromatase activity(GO:0070330) |
| 0.0 | 0.2 | GO:0004971 | AMPA glutamate receptor activity(GO:0004971) |
| 0.0 | 0.1 | GO:0016647 | oxidoreductase activity, acting on the CH-NH group of donors, oxygen as acceptor(GO:0016647) |
| 0.0 | 0.1 | GO:0008109 | N-acetyllactosaminide beta-1,6-N-acetylglucosaminyltransferase activity(GO:0008109) |
| 0.0 | 0.1 | GO:0034211 | GTP-dependent protein kinase activity(GO:0034211) |
| 0.0 | 0.1 | GO:0015093 | ferrous iron transmembrane transporter activity(GO:0015093) |
| 0.0 | 0.1 | GO:0008413 | 8-oxo-7,8-dihydroguanosine triphosphate pyrophosphatase activity(GO:0008413) 8-oxo-7,8-dihydrodeoxyguanosine triphosphate pyrophosphatase activity(GO:0035539) |
| 0.0 | 0.1 | GO:0071791 | chemokine (C-C motif) ligand 5 binding(GO:0071791) |
| 0.0 | 0.1 | GO:0071208 | histone pre-mRNA DCP binding(GO:0071208) U7 snRNA binding(GO:0071209) |
| 0.0 | 0.1 | GO:0035663 | Toll-like receptor 2 binding(GO:0035663) diacyl lipopeptide binding(GO:0042498) |
| 0.0 | 0.3 | GO:0102338 | fatty acid elongase activity(GO:0009922) 3-oxo-arachidoyl-CoA synthase activity(GO:0102336) 3-oxo-cerotoyl-CoA synthase activity(GO:0102337) 3-oxo-lignoceronyl-CoA synthase activity(GO:0102338) |
| 0.0 | 0.2 | GO:0004030 | aldehyde dehydrogenase [NAD(P)+] activity(GO:0004030) |
| 0.0 | 0.1 | GO:0030158 | protein xylosyltransferase activity(GO:0030158) |
| 0.0 | 0.2 | GO:0030235 | nitric-oxide synthase regulator activity(GO:0030235) |
| 0.0 | 0.1 | GO:0004594 | pantothenate kinase activity(GO:0004594) |
| 0.0 | 0.1 | GO:0003865 | 3-oxo-5-alpha-steroid 4-dehydrogenase activity(GO:0003865) cholestenone 5-alpha-reductase activity(GO:0047751) |
| 0.0 | 0.1 | GO:0016427 | tRNA (cytosine) methyltransferase activity(GO:0016427) |
| 0.0 | 0.1 | GO:0003828 | alpha-N-acetylneuraminate alpha-2,8-sialyltransferase activity(GO:0003828) |
| 0.0 | 0.1 | GO:0019002 | GMP binding(GO:0019002) |
| 0.0 | 0.1 | GO:0035375 | zymogen binding(GO:0035375) |
| 0.0 | 0.1 | GO:0009019 | tRNA (guanine-N1-)-methyltransferase activity(GO:0009019) |
| 0.0 | 0.1 | GO:0051990 | (R)-2-hydroxyglutarate dehydrogenase activity(GO:0051990) |
| 0.0 | 0.1 | GO:0004568 | chitinase activity(GO:0004568) |
| 0.0 | 0.3 | GO:0097200 | cysteine-type endopeptidase activity involved in execution phase of apoptosis(GO:0097200) |
| 0.0 | 0.1 | GO:0008396 | oxysterol 7-alpha-hydroxylase activity(GO:0008396) |
| 0.0 | 0.1 | GO:0004859 | phospholipase inhibitor activity(GO:0004859) |
| 0.0 | 0.1 | GO:0070180 | large ribosomal subunit rRNA binding(GO:0070180) |
| 0.0 | 0.1 | GO:0034191 | apolipoprotein A-I receptor binding(GO:0034191) |
| 0.0 | 0.1 | GO:0008379 | thioredoxin peroxidase activity(GO:0008379) |
| 0.0 | 0.1 | GO:0001594 | trace-amine receptor activity(GO:0001594) |
| 0.0 | 0.1 | GO:0008499 | UDP-galactose:beta-N-acetylglucosamine beta-1,3-galactosyltransferase activity(GO:0008499) |
| 0.0 | 0.1 | GO:0005329 | dopamine transmembrane transporter activity(GO:0005329) |
| 0.0 | 0.1 | GO:0004724 | magnesium-dependent protein serine/threonine phosphatase activity(GO:0004724) |
| 0.0 | 0.0 | GO:0004312 | fatty acid synthase activity(GO:0004312) |
| 0.0 | 0.1 | GO:0051185 | coenzyme transporter activity(GO:0051185) |
| 0.0 | 0.1 | GO:1990955 | G-rich single-stranded DNA binding(GO:1990955) |
| 0.0 | 0.2 | GO:0005384 | manganese ion transmembrane transporter activity(GO:0005384) |
| 0.0 | 0.1 | GO:0033149 | FFAT motif binding(GO:0033149) |
| 0.0 | 0.1 | GO:0005294 | neutral L-amino acid secondary active transmembrane transporter activity(GO:0005294) |
| 0.0 | 0.1 | GO:0022841 | potassium ion leak channel activity(GO:0022841) |
| 0.0 | 0.1 | GO:0071987 | WD40-repeat domain binding(GO:0071987) |
| 0.0 | 0.1 | GO:0016723 | oxidoreductase activity, oxidizing metal ions, NAD or NADP as acceptor(GO:0016723) |
| 0.0 | 0.4 | GO:0015020 | glucuronosyltransferase activity(GO:0015020) |
| 0.0 | 0.1 | GO:0004957 | prostaglandin E receptor activity(GO:0004957) |
| 0.0 | 0.1 | GO:0047134 | protein-disulfide reductase activity(GO:0047134) |
| 0.0 | 0.2 | GO:0004571 | mannosyl-oligosaccharide 1,2-alpha-mannosidase activity(GO:0004571) |
| 0.0 | 0.4 | GO:0050136 | NADH dehydrogenase (ubiquinone) activity(GO:0008137) NADH dehydrogenase (quinone) activity(GO:0050136) |
| 0.0 | 0.1 | GO:0003896 | DNA primase activity(GO:0003896) |
| 0.0 | 0.2 | GO:0035250 | UDP-galactosyltransferase activity(GO:0035250) |
| 0.0 | 0.1 | GO:0097100 | supercoiled DNA binding(GO:0097100) |
| 0.0 | 0.0 | GO:0001605 | adrenomedullin receptor activity(GO:0001605) |
| 0.0 | 0.1 | GO:0043199 | sulfate binding(GO:0043199) |
| 0.0 | 0.1 | GO:0035368 | selenocysteine insertion sequence binding(GO:0035368) |
| 0.0 | 0.3 | GO:0046933 | proton-transporting ATP synthase activity, rotational mechanism(GO:0046933) |
| 0.0 | 0.0 | GO:0070653 | high-density lipoprotein particle receptor binding(GO:0070653) |
| 0.0 | 0.0 | GO:0000253 | 3-keto sterol reductase activity(GO:0000253) prolactin receptor binding(GO:0005148) |
| 0.0 | 0.1 | GO:0016726 | xanthine dehydrogenase activity(GO:0004854) oxidoreductase activity, acting on CH or CH2 groups, NAD or NADP as acceptor(GO:0016726) |
| 0.0 | 0.4 | GO:0016676 | cytochrome-c oxidase activity(GO:0004129) heme-copper terminal oxidase activity(GO:0015002) oxidoreductase activity, acting on a heme group of donors, oxygen as acceptor(GO:0016676) |
| 0.0 | 0.2 | GO:0015643 | toxic substance binding(GO:0015643) |
| 0.0 | 0.0 | GO:0004911 | interleukin-2 receptor activity(GO:0004911) |
| 0.0 | 0.1 | GO:0015386 | potassium:proton antiporter activity(GO:0015386) |
| 0.0 | 0.1 | GO:0032184 | SUMO polymer binding(GO:0032184) |
| 0.0 | 0.1 | GO:0004994 | somatostatin receptor activity(GO:0004994) |
| 0.0 | 0.1 | GO:0008395 | steroid hydroxylase activity(GO:0008395) |
| 0.0 | 0.0 | GO:0008265 | Mo-molybdopterin cofactor sulfurase activity(GO:0008265) |
| 0.0 | 0.2 | GO:0003688 | DNA replication origin binding(GO:0003688) |
| 0.0 | 0.0 | GO:0045174 | oxidoreductase activity, acting on a sulfur group of donors, quinone or similar compound as acceptor(GO:0016672) oxidoreductase activity, acting on phosphorus or arsenic in donors(GO:0030613) oxidoreductase activity, acting on phosphorus or arsenic in donors, disulfide as acceptor(GO:0030614) glutathione dehydrogenase (ascorbate) activity(GO:0045174) methylarsonate reductase activity(GO:0050610) |
| 0.0 | 0.1 | GO:0001094 | TFIID-class transcription factor binding(GO:0001094) |
| 0.0 | 0.0 | GO:0016508 | long-chain-enoyl-CoA hydratase activity(GO:0016508) |
| 0.0 | 0.1 | GO:0008553 | hydrogen-exporting ATPase activity, phosphorylative mechanism(GO:0008553) |
| 0.0 | 0.0 | GO:0031849 | olfactory receptor binding(GO:0031849) |
| 0.0 | 0.0 | GO:0016433 | rRNA (adenine) methyltransferase activity(GO:0016433) |
| 0.0 | 0.1 | GO:0005138 | interleukin-6 receptor binding(GO:0005138) |
| 0.0 | 0.1 | GO:0051430 | corticotropin-releasing hormone receptor 1 binding(GO:0051430) |
| 0.0 | 0.1 | GO:0004105 | choline-phosphate cytidylyltransferase activity(GO:0004105) |
| 0.0 | 0.1 | GO:0008525 | phosphatidylcholine transporter activity(GO:0008525) |
| 0.0 | 0.2 | GO:0004012 | phospholipid-translocating ATPase activity(GO:0004012) |
| 0.0 | 0.1 | GO:0045236 | CXCR chemokine receptor binding(GO:0045236) |
| 0.0 | 0.0 | GO:0016712 | oxidoreductase activity, acting on paired donors, with incorporation or reduction of molecular oxygen, reduced flavin or flavoprotein as one donor, and incorporation of one atom of oxygen(GO:0016712) |
| 0.0 | 0.1 | GO:0035612 | AP-2 adaptor complex binding(GO:0035612) |
| 0.0 | 0.1 | GO:0004367 | glycerol-3-phosphate dehydrogenase [NAD+] activity(GO:0004367) |
| 0.0 | 0.0 | GO:0004301 | epoxide hydrolase activity(GO:0004301) |
| 0.0 | 0.1 | GO:0001758 | retinal dehydrogenase activity(GO:0001758) |
Gene overrepresentation in curated gene sets: canonical pathways category:
| Log-likelihood per target | Total log-likelihood | Term | Description |
|---|---|---|---|
| 0.0 | 0.4 | PID CXCR3 PATHWAY | CXCR3-mediated signaling events |
| 0.0 | 0.5 | PID AR NONGENOMIC PATHWAY | Nongenotropic Androgen signaling |
| 0.0 | 0.2 | PID ANTHRAX PATHWAY | Cellular roles of Anthrax toxin |
| 0.0 | 0.5 | PID HNF3B PATHWAY | FOXA2 and FOXA3 transcription factor networks |
Gene overrepresentation in curated gene sets: REACTOME pathways category:
| Log-likelihood per target | Total log-likelihood | Term | Description |
|---|---|---|---|
| 0.0 | 0.3 | REACTOME PROSTANOID LIGAND RECEPTORS | Genes involved in Prostanoid ligand receptors |
| 0.0 | 0.3 | REACTOME HORMONE LIGAND BINDING RECEPTORS | Genes involved in Hormone ligand-binding receptors |
| 0.0 | 0.4 | REACTOME GLUCURONIDATION | Genes involved in Glucuronidation |
| 0.0 | 0.1 | REACTOME APOBEC3G MEDIATED RESISTANCE TO HIV1 INFECTION | Genes involved in APOBEC3G mediated resistance to HIV-1 infection |
| 0.0 | 0.2 | REACTOME THE NLRP3 INFLAMMASOME | Genes involved in The NLRP3 inflammasome |
| 0.0 | 0.1 | REACTOME ABACAVIR TRANSPORT AND METABOLISM | Genes involved in Abacavir transport and metabolism |
| 0.0 | 0.1 | REACTOME NFKB IS ACTIVATED AND SIGNALS SURVIVAL | Genes involved in NF-kB is activated and signals survival |
| 0.0 | 0.1 | REACTOME PURINE CATABOLISM | Genes involved in Purine catabolism |
| 0.0 | 0.0 | REACTOME BETA DEFENSINS | Genes involved in Beta defensins |
| 0.0 | 0.2 | REACTOME E2F ENABLED INHIBITION OF PRE REPLICATION COMPLEX FORMATION | Genes involved in E2F-enabled inhibition of pre-replication complex formation |
| 0.0 | 0.3 | REACTOME SYNTHESIS OF BILE ACIDS AND BILE SALTS | Genes involved in Synthesis of bile acids and bile salts |
| 0.0 | 0.4 | REACTOME FANCONI ANEMIA PATHWAY | Genes involved in Fanconi Anemia pathway |
| 0.0 | 0.1 | REACTOME IL 6 SIGNALING | Genes involved in Interleukin-6 signaling |
| 0.0 | 0.1 | REACTOME PECAM1 INTERACTIONS | Genes involved in PECAM1 interactions |
| 0.0 | 0.1 | REACTOME SPRY REGULATION OF FGF SIGNALING | Genes involved in Spry regulation of FGF signaling |
| 0.0 | 0.1 | REACTOME CYCLIN A B1 ASSOCIATED EVENTS DURING G2 M TRANSITION | Genes involved in Cyclin A/B1 associated events during G2/M transition |
| 0.0 | 0.4 | REACTOME LATENT INFECTION OF HOMO SAPIENS WITH MYCOBACTERIUM TUBERCULOSIS | Genes involved in Latent infection of Homo sapiens with Mycobacterium tuberculosis |
| 0.0 | 0.1 | REACTOME SIGNAL REGULATORY PROTEIN SIRP FAMILY INTERACTIONS | Genes involved in Signal regulatory protein (SIRP) family interactions |
| 0.0 | 0.1 | REACTOME TRAF6 MEDIATED IRF7 ACTIVATION IN TLR7 8 OR 9 SIGNALING | Genes involved in TRAF6 mediated IRF7 activation in TLR7/8 or 9 signaling |
| 0.0 | 0.1 | REACTOME AMINE DERIVED HORMONES | Genes involved in Amine-derived hormones |
| 0.0 | 0.6 | REACTOME INTERFERON GAMMA SIGNALING | Genes involved in Interferon gamma signaling |