Project
GSE49485: Hypoxia transcriptome sequencing of rat brain.
Navigation
Downloads
Results for Cebpb
Z-value: 0.41
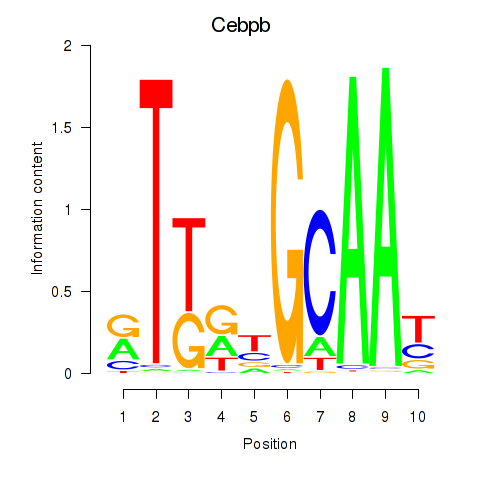
Motif logo
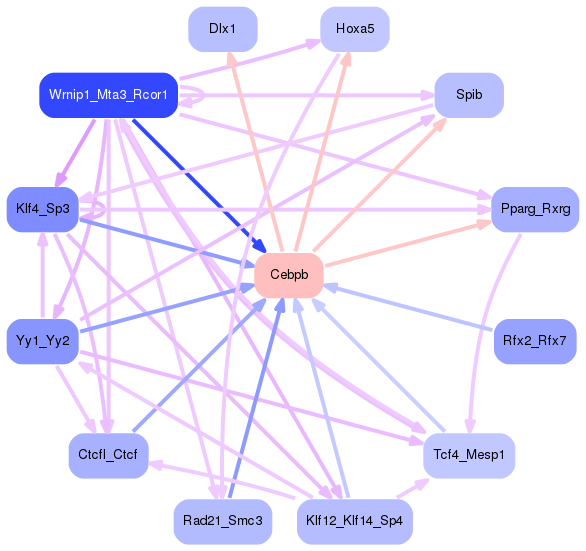
Transcription factors associated with Cebpb
| Gene Symbol | Gene ID | Gene Info |
|---|---|---|
|
Cebpb
|
ENSRNOG00000057347 | CCAAT/enhancer binding protein beta |
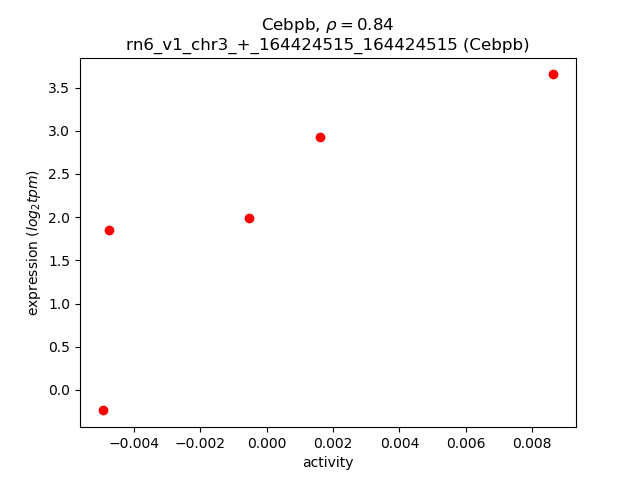
Activity-expression correlation:
| Gene | Promoter | Pearson corr. coef. | P-value | Plot |
|---|---|---|---|---|
| Cebpb | rn6_v1_chr3_+_164424515_164424515 | 0.84 | 7.5e-02 | Click! |
Activity profile of Cebpb motif
Sorted Z-values of Cebpb motif
| Promoter | Log-likelihood | Transcript | Gene | Gene Info |
|---|---|---|---|---|
| chr10_-_70871066 | 0.32 |
ENSRNOT00000015139
|
Ccl3
|
C-C motif chemokine ligand 3 |
| chr11_+_30904733 | 0.20 |
ENSRNOT00000036027
|
Mrap
|
melanocortin 2 receptor accessory protein |
| chr16_-_6675746 | 0.20 |
ENSRNOT00000025858
|
Prkcd
|
protein kinase C, delta |
| chr3_-_11417546 | 0.18 |
ENSRNOT00000018776
|
Lcn2
|
lipocalin 2 |
| chrX_+_33443186 | 0.18 |
ENSRNOT00000005622
|
S100g
|
S100 calcium binding protein G |
| chr19_+_14508616 | 0.18 |
ENSRNOT00000019192
|
Hmox1
|
heme oxygenase 1 |
| chr3_-_147819571 | 0.17 |
ENSRNOT00000009840
|
Trib3
|
tribbles pseudokinase 3 |
| chr8_-_117932518 | 0.16 |
ENSRNOT00000028130
|
Camp
|
cathelicidin antimicrobial peptide |
| chr16_-_75309176 | 0.16 |
ENSRNOT00000018427
|
Defb1
|
defensin beta 1 |
| chr16_-_14300951 | 0.15 |
ENSRNOT00000017038
|
Rgr
|
retinal G protein coupled receptor |
| chr16_+_61954809 | 0.13 |
ENSRNOT00000068011
|
Rbpms
|
RNA binding protein with multiple splicing |
| chr2_+_227657983 | 0.12 |
ENSRNOT00000021116
|
Prss12
|
protease, serine 12 |
| chr1_+_91152635 | 0.12 |
ENSRNOT00000073438
|
LOC100912070
|
dermokine-like |
| chr14_-_44375804 | 0.12 |
ENSRNOT00000042825
|
LOC100362751
|
ribosomal protein P2-like |
| chr11_-_34142753 | 0.11 |
ENSRNOT00000002297
|
Cldn14
|
claudin 14 |
| chr9_-_78969013 | 0.11 |
ENSRNOT00000019772
ENSRNOT00000057585 |
Fn1
|
fibronectin 1 |
| chr12_+_38160464 | 0.11 |
ENSRNOT00000032249
|
Hcar2
|
hydroxycarboxylic acid receptor 2 |
| chr16_+_61954590 | 0.11 |
ENSRNOT00000017883
|
Rbpms
|
RNA binding protein with multiple splicing |
| chr18_+_32594958 | 0.10 |
ENSRNOT00000018511
|
Spry4
|
sprouty RTK signaling antagonist 4 |
| chr2_-_190100276 | 0.10 |
ENSRNOT00000015351
|
S100a9
|
S100 calcium binding protein A9 |
| chr20_-_45260119 | 0.10 |
ENSRNOT00000000718
|
Slc16a10
|
solute carrier family 16 member 10 |
| chr4_+_33638709 | 0.09 |
ENSRNOT00000009888
ENSRNOT00000034719 ENSRNOT00000052333 |
Tac1
|
tachykinin, precursor 1 |
| chr9_+_74124016 | 0.09 |
ENSRNOT00000019023
|
Cps1
|
carbamoyl-phosphate synthase 1 |
| chr10_-_108196217 | 0.08 |
ENSRNOT00000075440
|
Cbx4
|
chromobox 4 |
| chr4_-_28953067 | 0.08 |
ENSRNOT00000013989
|
Tfpi2
|
tissue factor pathway inhibitor 2 |
| chr4_-_82173207 | 0.08 |
ENSRNOT00000074167
|
Hoxa5
|
homeo box A5 |
| chr10_-_59112788 | 0.08 |
ENSRNOT00000041886
|
Spns3
|
SPNS sphingolipid transporter 3 |
| chr19_-_52499433 | 0.07 |
ENSRNOT00000021954
|
Cotl1
|
coactosin-like F-actin binding protein 1 |
| chr18_-_29562153 | 0.07 |
ENSRNOT00000023977
|
Cd14
|
CD14 molecule |
| chr20_+_6102277 | 0.07 |
ENSRNOT00000033064
|
Pnpla1
|
patatin-like phospholipase domain containing 1 |
| chr3_+_151285249 | 0.07 |
ENSRNOT00000055254
|
Procr
|
protein C receptor |
| chr6_-_125723944 | 0.07 |
ENSRNOT00000007004
|
Fbln5
|
fibulin 5 |
| chr10_-_90049112 | 0.07 |
ENSRNOT00000028323
|
Pyy
|
peptide YY (mapped) |
| chr7_-_12326392 | 0.07 |
ENSRNOT00000039728
|
Ndufs7
|
NADH dehydrogenase (ubiquinone) Fe-S protein 7 |
| chr10_-_20622600 | 0.07 |
ENSRNOT00000020554
|
Fbll1
|
fibrillarin-like 1 |
| chrX_+_111396995 | 0.07 |
ENSRNOT00000087634
|
Pih1d3
|
PIH1 domain containing 3 |
| chr10_-_87407634 | 0.07 |
ENSRNOT00000016657
|
Krt23
|
keratin 23 |
| chr8_-_111721303 | 0.06 |
ENSRNOT00000045628
ENSRNOT00000012725 |
Tf
|
transferrin |
| chr14_-_8548310 | 0.06 |
ENSRNOT00000092436
|
Arhgap24
|
Rho GTPase activating protein 24 |
| chr4_-_38240848 | 0.06 |
ENSRNOT00000007567
|
Ndufa4
|
NADH:ubiquinone oxidoreductase subunit A4 |
| chr6_+_24163026 | 0.06 |
ENSRNOT00000061284
|
Lbh
|
limb bud and heart development |
| chr19_-_11057254 | 0.06 |
ENSRNOT00000025559
|
Herpud1
|
homocysteine inducible ER protein with ubiquitin like domain 1 |
| chr10_+_55940533 | 0.06 |
ENSRNOT00000012061
|
RGD1563441
|
similar to RIKEN cDNA A030009H04 |
| chr8_+_22856539 | 0.06 |
ENSRNOT00000015381
|
Angptl8
|
angiopoietin-like 8 |
| chr6_-_125723732 | 0.06 |
ENSRNOT00000084815
|
Fbln5
|
fibulin 5 |
| chr7_-_12640232 | 0.06 |
ENSRNOT00000014981
|
Elane
|
elastase, neutrophil expressed |
| chr8_+_116857684 | 0.06 |
ENSRNOT00000026711
|
Mst1
|
macrophage stimulating 1 |
| chr6_+_56846789 | 0.06 |
ENSRNOT00000032108
|
Agmo
|
alkylglycerol monooxygenase |
| chr4_+_147333056 | 0.05 |
ENSRNOT00000012137
|
Pparg
|
peroxisome proliferator-activated receptor gamma |
| chr5_+_145079803 | 0.05 |
ENSRNOT00000084202
|
Sfpq
|
splicing factor proline and glutamine rich |
| chr1_+_256786124 | 0.05 |
ENSRNOT00000034563
|
Ffar4
|
free fatty acid receptor 4 |
| chr4_+_38240728 | 0.05 |
ENSRNOT00000047029
|
Phf14
|
PHD finger protein 14 |
| chr4_-_35730599 | 0.05 |
ENSRNOT00000051149
|
Rps4x
|
ribosomal protein S4, X-linked |
| chr9_+_61655963 | 0.05 |
ENSRNOT00000040461
|
Coq10b
|
coenzyme Q10B |
| chr5_-_137372993 | 0.05 |
ENSRNOT00000092823
|
Tmem125
|
transmembrane protein 125 |
| chr5_+_168078748 | 0.05 |
ENSRNOT00000024798
|
Uts2
|
urotensin 2 |
| chr20_+_3176107 | 0.05 |
ENSRNOT00000001036
|
RT1-S3
|
RT1 class Ib, locus S3 |
| chr3_+_58164931 | 0.05 |
ENSRNOT00000002078
|
Dlx1
|
distal-less homeobox 1 |
| chr7_+_114997103 | 0.05 |
ENSRNOT00000010224
|
Ptp4a3
|
protein tyrosine phosphatase type IVA, member 3 |
| chr3_+_111160205 | 0.05 |
ENSRNOT00000019392
|
Chac1
|
ChaC glutathione-specific gamma-glutamylcyclotransferase 1 |
| chr5_+_128450680 | 0.05 |
ENSRNOT00000010700
|
Txndc12
|
thioredoxin domain containing 12 |
| chr10_-_62254287 | 0.05 |
ENSRNOT00000004313
|
Serpinf1
|
serpin family F member 1 |
| chr1_-_225014538 | 0.04 |
ENSRNOT00000026376
|
Ttc9c
|
tetratricopeptide repeat domain 9C |
| chr1_+_84256159 | 0.04 |
ENSRNOT00000031026
|
Blvrb
|
biliverdin reductase B |
| chr7_-_27240528 | 0.04 |
ENSRNOT00000029435
ENSRNOT00000079731 |
Hsp90b1
|
heat shock protein 90 beta family member 1 |
| chr1_-_156327352 | 0.04 |
ENSRNOT00000074282
|
LOC100911776
|
coiled-coil domain-containing protein 89-like |
| chr14_+_84306466 | 0.04 |
ENSRNOT00000006116
|
Sec14l4
|
SEC14-like lipid binding 4 |
| chr1_-_100537377 | 0.04 |
ENSRNOT00000026599
|
Spib
|
Spi-B transcription factor |
| chr2_+_187275120 | 0.04 |
ENSRNOT00000017234
|
Hdgf
|
hepatoma-derived growth factor |
| chr20_+_7908304 | 0.04 |
ENSRNOT00000000603
|
Rpl10a
|
ribosomal protein L10A |
| chr1_-_101596822 | 0.04 |
ENSRNOT00000028490
|
Fgf21
|
fibroblast growth factor 21 |
| chr7_+_70580198 | 0.04 |
ENSRNOT00000083472
ENSRNOT00000008941 |
Ddit3
|
DNA-damage inducible transcript 3 |
| chrX_+_143097525 | 0.04 |
ENSRNOT00000004559
|
F9
|
coagulation factor IX |
| chr9_-_45558993 | 0.04 |
ENSRNOT00000087866
ENSRNOT00000017714 |
Chst10
|
carbohydrate sulfotransferase 10 |
| chr20_+_7821755 | 0.04 |
ENSRNOT00000083109
|
Ppard
|
peroxisome proliferator-activated receptor delta |
| chr7_-_116936674 | 0.04 |
ENSRNOT00000029456
|
Eef1d
|
eukaryotic translation elongation factor 1 delta |
| chrX_-_138118696 | 0.04 |
ENSRNOT00000084130
|
Frmd7
|
FERM domain containing 7 |
| chr18_+_16590197 | 0.04 |
ENSRNOT00000066583
|
Mocos
|
molybdenum cofactor sulfurase |
| chr4_+_100166863 | 0.04 |
ENSRNOT00000014505
|
Sftpb
|
surfactant protein B |
| chr20_-_25826658 | 0.04 |
ENSRNOT00000057950
ENSRNOT00000084660 |
Ctnna3
|
catenin alpha 3 |
| chr3_+_11921715 | 0.04 |
ENSRNOT00000021689
|
Fam129b
|
family with sequence similarity 129, member B |
| chr20_-_32133431 | 0.04 |
ENSRNOT00000000443
|
Srgn
|
serglycin |
| chr3_+_117421604 | 0.04 |
ENSRNOT00000008860
ENSRNOT00000008857 |
Slc12a1
|
solute carrier family 12 member 1 |
| chr2_+_181987217 | 0.04 |
ENSRNOT00000034521
|
Fgg
|
fibrinogen gamma chain |
| chr10_+_98706960 | 0.03 |
ENSRNOT00000006217
|
Map2k6
|
mitogen-activated protein kinase kinase 6 |
| chr1_-_22661377 | 0.03 |
ENSRNOT00000021896
|
Vnn3
|
vanin 3 |
| chr5_+_144031402 | 0.03 |
ENSRNOT00000011694
|
Csf3r
|
colony stimulating factor 3 receptor |
| chr11_-_60546997 | 0.03 |
ENSRNOT00000083124
ENSRNOT00000050092 |
Btla
|
B and T lymphocyte associated |
| chr15_-_49467174 | 0.03 |
ENSRNOT00000019209
|
Adam7
|
ADAM metallopeptidase domain 7 |
| chr20_+_4517307 | 0.03 |
ENSRNOT00000000483
|
Dxo
|
decapping exoribonuclease |
| chr13_+_48427038 | 0.03 |
ENSRNOT00000009241
|
Ctse
|
cathepsin E |
| chr8_-_53816447 | 0.03 |
ENSRNOT00000011454
|
Ttc12
|
tetratricopeptide repeat domain 12 |
| chr3_+_102925471 | 0.03 |
ENSRNOT00000040364
|
Olr772
|
olfactory receptor 772 |
| chr14_+_45062662 | 0.03 |
ENSRNOT00000059124
|
Tlr10
|
toll-like receptor 10 |
| chr16_+_85305493 | 0.03 |
ENSRNOT00000088012
|
AABR07026596.2
|
|
| chr1_-_101426852 | 0.03 |
ENSRNOT00000028217
|
Ruvbl2
|
RuvB-like AAA ATPase 2 |
| chr2_-_139528162 | 0.03 |
ENSRNOT00000014317
|
Slc7a11
|
solute carrier family 7 member 11 |
| chr18_-_60002529 | 0.03 |
ENSRNOT00000081014
ENSRNOT00000024264 ENSRNOT00000059162 |
Nars
|
asparaginyl-tRNA synthetase |
| chr1_+_99718907 | 0.03 |
ENSRNOT00000048240
|
Klk10
|
kallikrein related-peptidase 10 |
| chr8_-_133002201 | 0.03 |
ENSRNOT00000008772
|
Ccr1
|
C-C motif chemokine receptor 1 |
| chr7_+_2504695 | 0.03 |
ENSRNOT00000003965
|
Atp5b
|
ATP synthase, H+ transporting, mitochondrial F1 complex, beta polypeptide |
| chr19_-_17045349 | 0.03 |
ENSRNOT00000086829
|
Fto
|
FTO, alpha-ketoglutarate dependent dioxygenase |
| chr7_-_14303055 | 0.03 |
ENSRNOT00000008963
|
Brd4
|
bromodomain containing 4 |
| chr2_+_55775274 | 0.03 |
ENSRNOT00000018545
|
C9
|
complement C9 |
| chr17_+_15762030 | 0.02 |
ENSRNOT00000089310
|
Fgd3
|
FYVE, RhoGEF and PH domain containing 3 |
| chr20_+_22913694 | 0.02 |
ENSRNOT00000067920
|
Reep3
|
receptor accessory protein 3 |
| chr7_-_14302552 | 0.02 |
ENSRNOT00000091368
|
Brd4
|
bromodomain containing 4 |
| chr1_-_93949187 | 0.02 |
ENSRNOT00000018956
|
Zfp536
|
zinc finger protein 536 |
| chr1_-_256813711 | 0.02 |
ENSRNOT00000021055
|
Rbp4
|
retinol binding protein 4 |
| chr15_-_33527031 | 0.02 |
ENSRNOT00000019979
|
Homez
|
homeobox and leucine zipper encoding |
| chr10_+_56710464 | 0.02 |
ENSRNOT00000065370
ENSRNOT00000064064 |
Asgr2
|
asialoglycoprotein receptor 2 |
| chr5_+_151181559 | 0.02 |
ENSRNOT00000085674
|
Fgr
|
FGR proto-oncogene, Src family tyrosine kinase |
| chr3_+_97349454 | 0.02 |
ENSRNOT00000089524
|
Dcdc5
|
doublecortin domain containing 5 |
| chr4_-_82258765 | 0.02 |
ENSRNOT00000008523
|
Hoxa5
|
homeo box A5 |
| chr1_+_154606490 | 0.02 |
ENSRNOT00000024095
|
Ccdc89
|
coiled-coil domain containing 89 |
| chr1_+_101427195 | 0.02 |
ENSRNOT00000028271
|
Gys1
|
glycogen synthase 1 |
| chr7_-_101140308 | 0.02 |
ENSRNOT00000006279
|
Fam84b
|
family with sequence similarity 84, member B |
| chr16_+_18690246 | 0.02 |
ENSRNOT00000081484
|
Mat1a
|
methionine adenosyltransferase 1A |
| chr15_+_28018040 | 0.02 |
ENSRNOT00000041495
|
Rnase4
|
ribonuclease A family member 4 |
| chr1_+_89215266 | 0.02 |
ENSRNOT00000093612
ENSRNOT00000084799 |
Dmkn
|
dermokine |
| chr3_-_35797804 | 0.02 |
ENSRNOT00000083776
|
Mmadhc
|
methylmalonic aciduria and homocystinuria, cblD type |
| chr2_-_147693082 | 0.02 |
ENSRNOT00000022507
|
Wwtr1
|
WW domain containing transcription regulator 1 |
| chr14_-_35581031 | 0.02 |
ENSRNOT00000003077
|
Pdgfra
|
platelet derived growth factor receptor alpha |
| chr3_+_112531703 | 0.02 |
ENSRNOT00000041727
|
LOC100911204
|
protein CASC5-like |
| chr3_+_170399302 | 0.02 |
ENSRNOT00000035245
|
Cass4
|
Cas scaffolding protein family member 4 |
| chr12_-_47095438 | 0.02 |
ENSRNOT00000001546
|
Coq5
|
coenzyme Q5, methyltransferase |
| chr9_+_95233957 | 0.02 |
ENSRNOT00000071003
|
Ugt1a5
|
UDP glucuronosyltransferase family 1 member A5 |
| chr19_+_25239674 | 0.02 |
ENSRNOT00000037453
|
Podnl1
|
podocan-like 1 |
| chr19_-_43215281 | 0.02 |
ENSRNOT00000025052
|
Aars
|
alanyl-tRNA synthetase |
| chr3_-_101474890 | 0.02 |
ENSRNOT00000091869
|
Bbox1
|
gamma-butyrobetaine hydroxylase 1 |
| chr14_-_100184192 | 0.01 |
ENSRNOT00000007044
|
Plek
|
pleckstrin |
| chr7_-_70829815 | 0.01 |
ENSRNOT00000011082
|
Shmt2
|
serine hydroxymethyltransferase 2 |
| chr13_+_52887649 | 0.01 |
ENSRNOT00000048033
|
Ascl5
|
achaete-scute family bHLH transcription factor 5 |
| chr1_+_137799185 | 0.01 |
ENSRNOT00000083590
ENSRNOT00000092778 |
Agbl1
|
ATP/GTP binding protein-like 1 |
| chr20_-_45259928 | 0.01 |
ENSRNOT00000087226
|
Slc16a10
|
solute carrier family 16 member 10 |
| chr8_+_118013612 | 0.01 |
ENSRNOT00000056166
|
Map4
|
microtubule-associated protein 4 |
| chr10_-_109821807 | 0.01 |
ENSRNOT00000054949
|
Pycr1
|
pyrroline-5-carboxylate reductase 1 |
| chr11_-_60547201 | 0.01 |
ENSRNOT00000093151
|
Btla
|
B and T lymphocyte associated |
| chr18_+_16590408 | 0.01 |
ENSRNOT00000093715
|
Mocos
|
molybdenum cofactor sulfurase |
| chr1_+_89202527 | 0.01 |
ENSRNOT00000028526
|
Sbsn
|
suprabasin |
| chr7_-_76294663 | 0.01 |
ENSRNOT00000064513
|
Ncald
|
neurocalcin delta |
| chr4_+_114776797 | 0.01 |
ENSRNOT00000089635
|
LOC103692167
|
polycomb group RING finger protein 1 |
| chr3_+_154786215 | 0.01 |
ENSRNOT00000019787
|
Lbp
|
lipopolysaccharide binding protein |
| chr19_-_43215077 | 0.01 |
ENSRNOT00000082151
|
Aars
|
alanyl-tRNA synthetase |
| chr6_+_10533151 | 0.01 |
ENSRNOT00000020822
|
Rhoq
|
ras homolog family member Q |
| chr8_+_116657371 | 0.01 |
ENSRNOT00000024966
|
Mon1a
|
MON1 homolog A, secretory trafficking associated |
| chr19_+_15081158 | 0.01 |
ENSRNOT00000074070
|
Ces1f
|
carboxylesterase 1F |
| chr19_+_15081590 | 0.01 |
ENSRNOT00000024187
|
Ces1f
|
carboxylesterase 1F |
| chr10_-_107386072 | 0.01 |
ENSRNOT00000004290
|
Timp2
|
TIMP metallopeptidase inhibitor 2 |
| chr13_-_111972603 | 0.01 |
ENSRNOT00000007870
|
Hsd11b1
|
hydroxysteroid 11-beta dehydrogenase 1 |
| chr1_-_263269762 | 0.01 |
ENSRNOT00000022309
|
Got1
|
glutamic-oxaloacetic transaminase 1 |
| chr1_+_276240703 | 0.01 |
ENSRNOT00000022126
|
Acsl5
|
acyl-CoA synthetase long-chain family member 5 |
| chr15_+_2734068 | 0.01 |
ENSRNOT00000017663
|
Dusp13
|
dual specificity phosphatase 13 |
| chr20_-_2103864 | 0.01 |
ENSRNOT00000001014
|
Rnf39
|
ring finger protein 39 |
| chr1_-_219168177 | 0.00 |
ENSRNOT00000023789
|
Aldh3b1
|
aldehyde dehydrogenase 3 family, member B1 |
| chr15_+_2527343 | 0.00 |
ENSRNOT00000089013
|
Dusp13
|
dual specificity phosphatase 13 |
| chr9_+_46962288 | 0.00 |
ENSRNOT00000082146
|
Il1r1
|
interleukin 1 receptor type 1 |
| chr8_+_5768811 | 0.00 |
ENSRNOT00000013936
|
Mmp8
|
matrix metallopeptidase 8 |
| chr7_+_83113672 | 0.00 |
ENSRNOT00000006783
|
Trhr
|
thyrotropin releasing hormone receptor |
| chr3_-_168111920 | 0.00 |
ENSRNOT00000046011
|
Cyp24a1
|
cytochrome P450, family 24, subfamily a, polypeptide 1 |
| chr10_-_82117109 | 0.00 |
ENSRNOT00000079711
|
Abcc3
|
ATP binding cassette subfamily C member 3 |
| chr18_-_15688284 | 0.00 |
ENSRNOT00000091816
|
Dsg3
|
desmoglein 3 |
| chr10_-_82116621 | 0.00 |
ENSRNOT00000003977
ENSRNOT00000051497 ENSRNOT00000085451 |
Abcc3
|
ATP binding cassette subfamily C member 3 |
| chr10_-_72188164 | 0.00 |
ENSRNOT00000085728
ENSRNOT00000042506 |
Ggnbp2
|
gametogenetin binding protein 2 |
Network of associatons between targets according to the STRING database.

First level regulatory network of Cebpb
Gene Ontology Analysis
Gene overrepresentation in biological process category:
| Log-likelihood per target | Total log-likelihood | Term | Description |
|---|---|---|---|
| 0.1 | 0.2 | GO:0060697 | positive regulation of phospholipid catabolic process(GO:0060697) |
| 0.1 | 0.2 | GO:0015891 | iron chelate transport(GO:0015688) siderophore transport(GO:0015891) |
| 0.1 | 0.2 | GO:0034395 | heme oxidation(GO:0006788) regulation of transcription from RNA polymerase II promoter in response to iron(GO:0034395) |
| 0.1 | 0.3 | GO:2000503 | positive regulation of natural killer cell chemotaxis(GO:2000503) |
| 0.1 | 0.2 | GO:0060474 | positive regulation of sperm motility involved in capacitation(GO:0060474) |
| 0.0 | 0.1 | GO:2001201 | calcium-independent cell-matrix adhesion(GO:0007161) interaction with other organism via secreted substance involved in symbiotic interaction(GO:0052047) regulation of transforming growth factor-beta secretion(GO:2001201) |
| 0.0 | 0.1 | GO:1903575 | cornified envelope assembly(GO:1903575) |
| 0.0 | 0.1 | GO:0060764 | cell-cell signaling involved in mammary gland development(GO:0060764) |
| 0.0 | 0.1 | GO:0035606 | peptidyl-cysteine S-trans-nitrosylation(GO:0035606) |
| 0.0 | 0.2 | GO:0071224 | cellular response to peptidoglycan(GO:0071224) |
| 0.0 | 0.1 | GO:0018364 | peptidyl-glutamine methylation(GO:0018364) |
| 0.0 | 0.0 | GO:0042167 | porphyrin-containing compound catabolic process(GO:0006787) tetrapyrrole catabolic process(GO:0033015) heme catabolic process(GO:0042167) pigment catabolic process(GO:0046149) |
| 0.0 | 0.1 | GO:0015801 | aromatic amino acid transport(GO:0015801) |
| 0.0 | 0.1 | GO:0045079 | negative regulation of chemokine biosynthetic process(GO:0045079) |
| 0.0 | 0.1 | GO:0046878 | positive regulation of saliva secretion(GO:0046878) positive regulation of glucocorticoid secretion(GO:2000851) |
| 0.0 | 0.1 | GO:2000230 | negative regulation of pancreatic stellate cell proliferation(GO:2000230) |
| 0.0 | 0.1 | GO:0033031 | positive regulation of neutrophil apoptotic process(GO:0033031) |
| 0.0 | 0.1 | GO:0032639 | antigen processing and presentation of endogenous peptide antigen via MHC class Ib via ER pathway(GO:0002488) antigen processing and presentation of endogenous peptide antigen via MHC class Ib via ER pathway, TAP-dependent(GO:0002489) TRAIL production(GO:0032639) regulation of TRAIL production(GO:0032679) positive regulation of TRAIL production(GO:0032759) |
| 0.0 | 0.1 | GO:0071400 | cellular response to oleic acid(GO:0071400) |
| 0.0 | 0.1 | GO:0021882 | regulation of transcription from RNA polymerase II promoter involved in forebrain neuron fate commitment(GO:0021882) commitment of multipotent stem cells to neuronal lineage in forebrain(GO:0021898) |
| 0.0 | 0.1 | GO:0070447 | positive regulation of oligodendrocyte progenitor proliferation(GO:0070447) ferrous iron import into cell(GO:0097460) ferrous iron import across plasma membrane(GO:0098707) |
| 0.0 | 0.2 | GO:0060391 | positive regulation of SMAD protein import into nucleus(GO:0060391) |
| 0.0 | 0.0 | GO:0050828 | regulation of liquid surface tension(GO:0050828) |
| 0.0 | 0.1 | GO:0048251 | elastic fiber assembly(GO:0048251) |
| 0.0 | 0.0 | GO:0033364 | mast cell secretory granule organization(GO:0033364) |
| 0.0 | 0.0 | GO:0032978 | protein insertion into membrane from inner side(GO:0032978) |
| 0.0 | 0.1 | GO:0035790 | platelet-derived growth factor receptor-alpha signaling pathway(GO:0035790) |
| 0.0 | 0.1 | GO:1903071 | positive regulation of ER-associated ubiquitin-dependent protein catabolic process(GO:1903071) |
| 0.0 | 0.2 | GO:0045717 | negative regulation of fatty acid biosynthetic process(GO:0045717) |
| 0.0 | 0.1 | GO:0010841 | positive regulation of circadian sleep/wake cycle, wakefulness(GO:0010841) |
Gene overrepresentation in cellular component category:
| Log-likelihood per target | Total log-likelihood | Term | Description |
|---|---|---|---|
| 0.0 | 0.1 | GO:0071953 | elastic fiber(GO:0071953) |
| 0.0 | 0.1 | GO:1990037 | Lewy body core(GO:1990037) |
| 0.0 | 0.1 | GO:0005577 | fibrinogen complex(GO:0005577) |
| 0.0 | 0.1 | GO:0032398 | MHC class Ib protein complex(GO:0032398) |
| 0.0 | 0.1 | GO:0046696 | lipopolysaccharide receptor complex(GO:0046696) |
| 0.0 | 0.0 | GO:1990622 | CHOP-C/EBP complex(GO:0036488) CHOP-ATF3 complex(GO:1990622) |
| 0.0 | 0.0 | GO:0005853 | eukaryotic translation elongation factor 1 complex(GO:0005853) |
| 0.0 | 0.1 | GO:1990712 | HFE-transferrin receptor complex(GO:1990712) |
| 0.0 | 0.2 | GO:0005685 | U1 snRNP(GO:0005685) |
| 0.0 | 0.2 | GO:0042581 | specific granule(GO:0042581) |
Gene overrepresentation in molecular function category:
| Log-likelihood per target | Total log-likelihood | Term | Description |
|---|---|---|---|
| 0.1 | 0.3 | GO:0004698 | calcium-dependent protein kinase C activity(GO:0004698) |
| 0.1 | 0.2 | GO:0031783 | corticotropin hormone receptor binding(GO:0031780) type 5 melanocortin receptor binding(GO:0031783) |
| 0.1 | 0.2 | GO:0070976 | TIR domain binding(GO:0070976) |
| 0.1 | 0.2 | GO:0004392 | heme oxygenase (decyclizing) activity(GO:0004392) |
| 0.1 | 0.2 | GO:0035614 | snRNA stem-loop binding(GO:0035614) |
| 0.0 | 0.2 | GO:0005499 | vitamin D binding(GO:0005499) |
| 0.0 | 0.1 | GO:0015173 | aromatic amino acid transmembrane transporter activity(GO:0015173) thyroid hormone transmembrane transporter activity(GO:0015349) |
| 0.0 | 0.2 | GO:0050544 | arachidonic acid binding(GO:0050544) |
| 0.0 | 0.0 | GO:0034211 | GTP-dependent protein kinase activity(GO:0034211) |
| 0.0 | 0.1 | GO:0070891 | lipoteichoic acid binding(GO:0070891) |
| 0.0 | 0.1 | GO:0045340 | mercury ion binding(GO:0045340) |
| 0.0 | 0.1 | GO:0046624 | sphingolipid transporter activity(GO:0046624) |
| 0.0 | 0.0 | GO:0008265 | Mo-molybdopterin cofactor sulfurase activity(GO:0008265) |
| 0.0 | 0.0 | GO:0008511 | sodium:potassium:chloride symporter activity(GO:0008511) |
| 0.0 | 0.0 | GO:0003839 | gamma-glutamylcyclotransferase activity(GO:0003839) |
| 0.0 | 0.0 | GO:0051916 | granulocyte colony-stimulating factor binding(GO:0051916) |
Gene overrepresentation in curated gene sets: canonical pathways category:
| Log-likelihood per target | Total log-likelihood | Term | Description |
|---|---|---|---|
| 0.0 | 0.2 | ST PAC1 RECEPTOR PATHWAY | PAC1 Receptor Pathway |
Gene overrepresentation in curated gene sets: REACTOME pathways category:
| Log-likelihood per target | Total log-likelihood | Term | Description |
|---|---|---|---|
| 0.1 | 0.2 | REACTOME BETA DEFENSINS | Genes involved in Beta defensins |
| 0.0 | 0.2 | REACTOME NEGATIVE REGULATION OF THE PI3K AKT NETWORK | Genes involved in Negative regulation of the PI3K/AKT network |
| 0.0 | 0.2 | REACTOME OPSINS | Genes involved in Opsins |
| 0.0 | 0.1 | REACTOME TRANSFERRIN ENDOCYTOSIS AND RECYCLING | Genes involved in Transferrin endocytosis and recycling |
| 0.0 | 0.2 | REACTOME METABOLISM OF PORPHYRINS | Genes involved in Metabolism of porphyrins |