Project
GSE49485: Hypoxia transcriptome sequencing of rat brain.
Navigation
Downloads
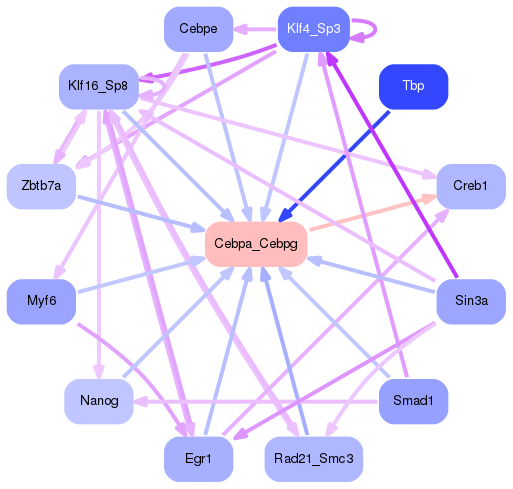
Results for Cebpa_Cebpg
Z-value: 0.39
Motif logo
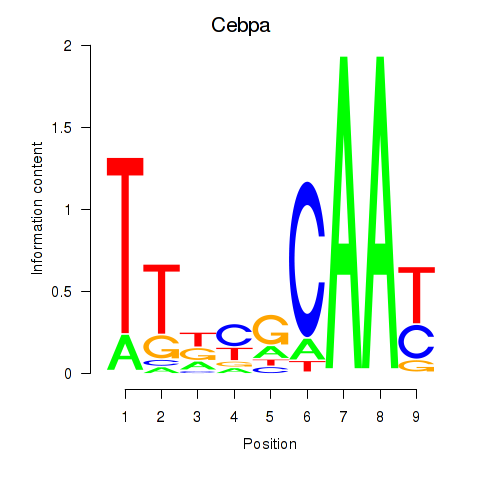
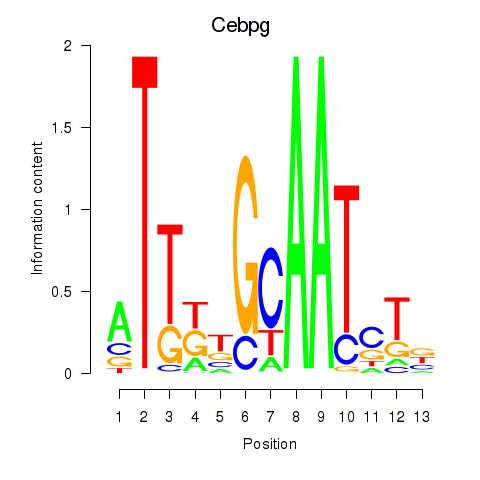
Transcription factors associated with Cebpa_Cebpg
| Gene Symbol | Gene ID | Gene Info |
|---|---|---|
|
Cebpa
|
ENSRNOG00000010918 | CCAAT/enhancer binding protein alpha |
|
Cebpg
|
ENSRNOG00000021144 | CCAAT/enhancer binding protein gamma |
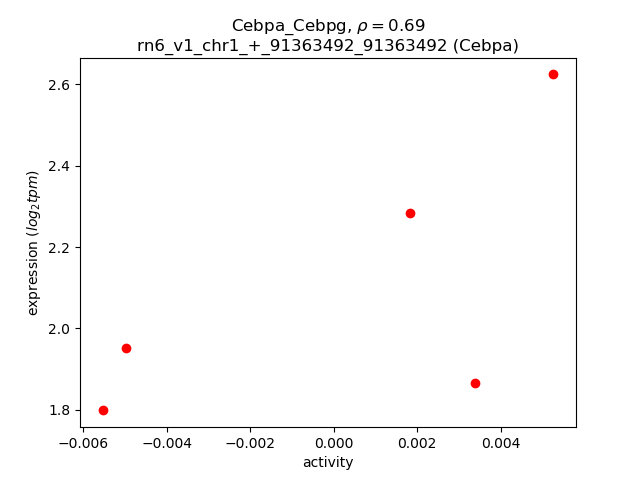
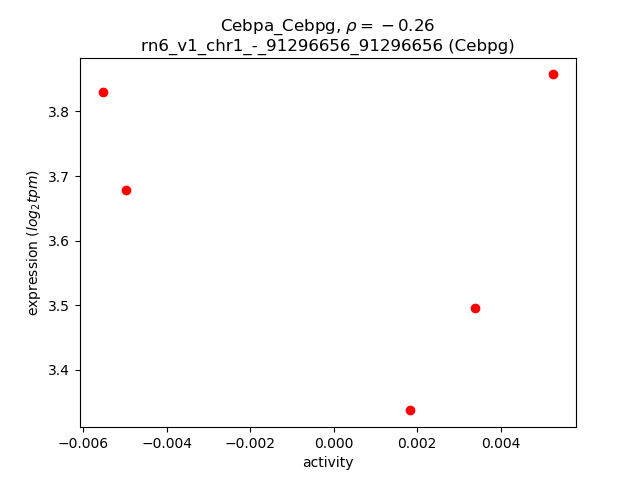
Activity-expression correlation:
| Gene | Promoter | Pearson corr. coef. | P-value | Plot |
|---|---|---|---|---|
| Cebpa | rn6_v1_chr1_+_91363492_91363492 | 0.69 | 2.0e-01 | Click! |
| Cebpg | rn6_v1_chr1_-_91296656_91296656 | -0.26 | 6.7e-01 | Click! |
Activity profile of Cebpa_Cebpg motif
Sorted Z-values of Cebpa_Cebpg motif
| Promoter | Log-likelihood | Transcript | Gene | Gene Info |
|---|---|---|---|---|
| chr2_+_227657983 | 0.20 |
ENSRNOT00000021116
|
Prss12
|
protease, serine 12 |
| chr2_+_158097843 | 0.18 |
ENSRNOT00000016541
|
Ptx3
|
pentraxin 3 |
| chr1_-_168972725 | 0.17 |
ENSRNOT00000090422
|
Hbb
|
hemoglobin subunit beta |
| chr1_+_91152635 | 0.17 |
ENSRNOT00000073438
|
LOC100912070
|
dermokine-like |
| chr1_+_168964202 | 0.15 |
ENSRNOT00000089102
|
LOC103694855
|
hemoglobin subunit beta-2-like |
| chr9_+_23354770 | 0.10 |
ENSRNOT00000081459
|
Cenpq
|
centromere protein Q |
| chr11_-_81444375 | 0.10 |
ENSRNOT00000058479
ENSRNOT00000078131 ENSRNOT00000080949 ENSRNOT00000080562 ENSRNOT00000084867 |
Kng1
|
kininogen 1 |
| chr10_+_55940533 | 0.09 |
ENSRNOT00000012061
|
RGD1563441
|
similar to RIKEN cDNA A030009H04 |
| chr5_+_64294321 | 0.08 |
ENSRNOT00000083796
|
Msantd3
|
Myb/SANT DNA binding domain containing 3 |
| chrX_-_138118696 | 0.08 |
ENSRNOT00000084130
|
Frmd7
|
FERM domain containing 7 |
| chr1_-_82279145 | 0.08 |
ENSRNOT00000057433
|
Cxcl17
|
C-X-C motif chemokine ligand 17 |
| chr16_-_14300951 | 0.08 |
ENSRNOT00000017038
|
Rgr
|
retinal G protein coupled receptor |
| chr9_+_9721105 | 0.08 |
ENSRNOT00000073042
ENSRNOT00000075494 |
C3
|
complement C3 |
| chr7_-_27240528 | 0.07 |
ENSRNOT00000029435
ENSRNOT00000079731 |
Hsp90b1
|
heat shock protein 90 beta family member 1 |
| chr13_+_52887649 | 0.07 |
ENSRNOT00000048033
|
Ascl5
|
achaete-scute family bHLH transcription factor 5 |
| chr4_+_84478839 | 0.06 |
ENSRNOT00000012668
|
Prr15
|
proline rich 15 |
| chr1_-_82468064 | 0.06 |
ENSRNOT00000038300
|
Tmem91
|
transmembrane protein 91 |
| chr10_-_62254287 | 0.06 |
ENSRNOT00000004313
|
Serpinf1
|
serpin family F member 1 |
| chr14_+_84306466 | 0.05 |
ENSRNOT00000006116
|
Sec14l4
|
SEC14-like lipid binding 4 |
| chr14_-_19072677 | 0.05 |
ENSRNOT00000060548
|
LOC360919
|
similar to alpha-fetoprotein |
| chr15_+_41643541 | 0.05 |
ENSRNOT00000019646
|
Arl11
|
ADP-ribosylation factor like GTPase 11 |
| chr7_-_121232741 | 0.04 |
ENSRNOT00000023196
|
Pdgfb
|
platelet derived growth factor subunit B |
| chr16_+_61954809 | 0.04 |
ENSRNOT00000068011
|
Rbpms
|
RNA binding protein with multiple splicing |
| chr10_-_70871066 | 0.04 |
ENSRNOT00000015139
|
Ccl3
|
C-C motif chemokine ligand 3 |
| chr16_+_61954590 | 0.04 |
ENSRNOT00000017883
|
Rbpms
|
RNA binding protein with multiple splicing |
| chr9_+_71247781 | 0.04 |
ENSRNOT00000049654
|
Creb1
|
cAMP responsive element binding protein 1 |
| chr12_-_20486276 | 0.04 |
ENSRNOT00000074057
|
LOC680910
|
similar to paired immunoglobin-like type 2 receptor beta |
| chr5_-_135677432 | 0.04 |
ENSRNOT00000024393
|
Hpdl
|
4-hydroxyphenylpyruvate dioxygenase-like |
| chr8_+_116754178 | 0.04 |
ENSRNOT00000068295
ENSRNOT00000084429 |
Uba7
|
ubiquitin-like modifier activating enzyme 7 |
| chr7_-_144936803 | 0.04 |
ENSRNOT00000055279
|
Gpr84
|
G protein-coupled receptor 84 |
| chr12_+_38160464 | 0.04 |
ENSRNOT00000032249
|
Hcar2
|
hydroxycarboxylic acid receptor 2 |
| chr15_+_108956448 | 0.04 |
ENSRNOT00000046324
|
AC123185.1
|
|
| chr20_-_10013190 | 0.04 |
ENSRNOT00000084726
ENSRNOT00000089112 |
Rsph1
|
radial spoke head 1 homolog |
| chr2_-_139528162 | 0.04 |
ENSRNOT00000014317
|
Slc7a11
|
solute carrier family 7 member 11 |
| chr2_-_210782746 | 0.03 |
ENSRNOT00000025939
ENSRNOT00000081501 |
Gstm7
|
glutathione S-transferase, mu 7 |
| chr20_-_32133431 | 0.03 |
ENSRNOT00000000443
|
Srgn
|
serglycin |
| chrX_+_15988604 | 0.03 |
ENSRNOT00000003800
|
Usp27x
|
ubiquitin specific peptidase 27, X-linked |
| chr3_+_11921715 | 0.03 |
ENSRNOT00000021689
|
Fam129b
|
family with sequence similarity 129, member B |
| chr13_+_85818427 | 0.03 |
ENSRNOT00000077227
ENSRNOT00000006117 |
Rxrg
|
retinoid X receptor gamma |
| chr9_+_61655963 | 0.03 |
ENSRNOT00000040461
|
Coq10b
|
coenzyme Q10B |
| chr2_+_204932159 | 0.03 |
ENSRNOT00000078376
|
Ngf
|
nerve growth factor |
| chr7_+_58814805 | 0.03 |
ENSRNOT00000005909
|
Tspan8
|
tetraspanin 8 |
| chr10_-_109821807 | 0.03 |
ENSRNOT00000054949
|
Pycr1
|
pyrroline-5-carboxylate reductase 1 |
| chr17_+_15749978 | 0.03 |
ENSRNOT00000067311
|
Fgd3
|
FYVE, RhoGEF and PH domain containing 3 |
| chr13_+_67351087 | 0.03 |
ENSRNOT00000003567
|
Ptgs2
|
prostaglandin-endoperoxide synthase 2 |
| chr14_-_8548310 | 0.03 |
ENSRNOT00000092436
|
Arhgap24
|
Rho GTPase activating protein 24 |
| chr17_-_77527894 | 0.03 |
ENSRNOT00000032173
|
Bend7
|
BEN domain containing 7 |
| chr1_+_162320730 | 0.03 |
ENSRNOT00000035743
|
Kctd21
|
potassium channel tetramerization domain containing 21 |
| chr6_+_128750795 | 0.03 |
ENSRNOT00000005781
|
Glrx5
|
glutaredoxin 5 |
| chr13_-_88497901 | 0.03 |
ENSRNOT00000058560
|
Uap1
|
UDP-N-acetylglucosamine pyrophosphorylase 1 |
| chr3_+_58084606 | 0.03 |
ENSRNOT00000084797
|
Metap1d
|
methionyl aminopeptidase type 1D (mitochondrial) |
| chr9_+_74124016 | 0.03 |
ENSRNOT00000019023
|
Cps1
|
carbamoyl-phosphate synthase 1 |
| chr20_-_10013559 | 0.03 |
ENSRNOT00000091623
|
Rsph1
|
radial spoke head 1 homolog |
| chrX_+_111396995 | 0.02 |
ENSRNOT00000087634
|
Pih1d3
|
PIH1 domain containing 3 |
| chr10_+_96639924 | 0.02 |
ENSRNOT00000004756
|
Apoh
|
apolipoprotein H |
| chrX_+_143097525 | 0.02 |
ENSRNOT00000004559
|
F9
|
coagulation factor IX |
| chr15_+_28018040 | 0.02 |
ENSRNOT00000041495
|
Rnase4
|
ribonuclease A family member 4 |
| chr15_+_57290849 | 0.02 |
ENSRNOT00000014909
|
Cpb2
|
carboxypeptidase B2 |
| chr9_+_46962288 | 0.02 |
ENSRNOT00000082146
|
Il1r1
|
interleukin 1 receptor type 1 |
| chr1_-_22661377 | 0.02 |
ENSRNOT00000021896
|
Vnn3
|
vanin 3 |
| chr12_+_2213705 | 0.02 |
ENSRNOT00000031653
|
Mcemp1
|
mast cell-expressed membrane protein 1 |
| chr17_-_14627937 | 0.02 |
ENSRNOT00000020532
|
NEWGENE_1308171
|
osteoglycin |
| chr3_+_170399302 | 0.02 |
ENSRNOT00000035245
|
Cass4
|
Cas scaffolding protein family member 4 |
| chr2_+_234375315 | 0.02 |
ENSRNOT00000071270
|
LOC102549542
|
elongation of very long chain fatty acids protein 6-like |
| chr13_-_73390393 | 0.02 |
ENSRNOT00000067253
ENSRNOT00000093438 |
Lhx4
|
LIM homeobox 4 |
| chr12_+_10255416 | 0.02 |
ENSRNOT00000092720
|
Gpr12
|
G protein-coupled receptor 12 |
| chr8_+_5768811 | 0.02 |
ENSRNOT00000013936
|
Mmp8
|
matrix metallopeptidase 8 |
| chr5_-_133067245 | 0.02 |
ENSRNOT00000033163
|
Skint10
|
selection and upkeep of intraepithelial T cells 10 |
| chr8_-_125645898 | 0.02 |
ENSRNOT00000036672
|
Rbms3
|
RNA binding motif, single stranded interacting protein 3 |
| chr19_-_49510901 | 0.02 |
ENSRNOT00000082929
ENSRNOT00000079969 |
LOC687399
|
hypothetical protein LOC687399 |
| chr15_-_28155291 | 0.02 |
ENSRNOT00000050820
|
Rnase2
|
ribonuclease A family member 2 |
| chr3_-_160573978 | 0.02 |
ENSRNOT00000018386
|
Wfdc5
|
WAP four-disulfide core domain 5 |
| chrX_-_63809861 | 0.02 |
ENSRNOT00000009870
|
Maged1
|
MAGE family member D1 |
| chr9_-_78969013 | 0.01 |
ENSRNOT00000019772
ENSRNOT00000057585 |
Fn1
|
fibronectin 1 |
| chr2_+_183674522 | 0.01 |
ENSRNOT00000014433
|
Tmem154
|
transmembrane protein 154 |
| chr18_+_16590197 | 0.01 |
ENSRNOT00000066583
|
Mocos
|
molybdenum cofactor sulfurase |
| chr10_-_59112788 | 0.01 |
ENSRNOT00000041886
|
Spns3
|
SPNS sphingolipid transporter 3 |
| chr1_-_191007503 | 0.01 |
ENSRNOT00000023262
|
Igsf6
|
immunoglobulin superfamily, member 6 |
| chr17_-_18590536 | 0.01 |
ENSRNOT00000078992
|
Cap2
|
CAP, adenylate cyclase-associated protein, 2 (yeast) |
| chr1_-_101596822 | 0.01 |
ENSRNOT00000028490
|
Fgf21
|
fibroblast growth factor 21 |
| chr10_-_40282881 | 0.01 |
ENSRNOT00000013864
|
Tnip1
|
TNFAIP3 interacting protein 1 |
| chr3_-_26056818 | 0.01 |
ENSRNOT00000044209
|
Lrp1b
|
LDL receptor related protein 1B |
| chr11_-_64968437 | 0.01 |
ENSRNOT00000059541
|
Cox17
|
COX17 cytochrome c oxidase copper chaperone |
| chr10_+_56710464 | 0.01 |
ENSRNOT00000065370
ENSRNOT00000064064 |
Asgr2
|
asialoglycoprotein receptor 2 |
| chr18_-_29562153 | 0.01 |
ENSRNOT00000023977
|
Cd14
|
CD14 molecule |
| chr4_+_33890349 | 0.01 |
ENSRNOT00000078680
|
C1galt1
|
core 1 synthase, glycoprotein-N-acetylgalactosamine 3-beta-galactosyltransferase, 1 |
| chr10_-_82116621 | 0.01 |
ENSRNOT00000003977
ENSRNOT00000051497 ENSRNOT00000085451 |
Abcc3
|
ATP binding cassette subfamily C member 3 |
| chr7_+_60015998 | 0.01 |
ENSRNOT00000007309
|
Best3
|
bestrophin 3 |
| chrX_-_77529374 | 0.01 |
ENSRNOT00000078213
|
Fndc3c1
|
fibronectin type III domain containing 3C1 |
| chr2_+_55775274 | 0.01 |
ENSRNOT00000018545
|
C9
|
complement C9 |
| chr13_+_48426820 | 0.01 |
ENSRNOT00000048391
|
Ctse
|
cathepsin E |
| chr17_-_5463158 | 0.01 |
ENSRNOT00000090032
|
Naa35
|
N(alpha)-acetyltransferase 35, NatC auxiliary subunit |
| chr2_-_41784929 | 0.01 |
ENSRNOT00000086851
|
Rab3c
|
RAB3C, member RAS oncogene family |
| chr7_+_2504695 | 0.01 |
ENSRNOT00000003965
|
Atp5b
|
ATP synthase, H+ transporting, mitochondrial F1 complex, beta polypeptide |
| chr8_+_116857684 | 0.01 |
ENSRNOT00000026711
|
Mst1
|
macrophage stimulating 1 |
| chr14_-_17333588 | 0.01 |
ENSRNOT00000077636
|
Ppef2
|
protein phosphatase with EF-hand domain 2 |
| chr3_+_2643610 | 0.01 |
ENSRNOT00000037169
|
Fut7
|
fucosyltransferase 7 |
| chr1_-_229601032 | 0.01 |
ENSRNOT00000016690
|
Cntf
|
ciliary neurotrophic factor |
| chr3_+_36173002 | 0.01 |
ENSRNOT00000038906
|
LOC499796
|
LRRGT00012 |
| chr10_-_11935382 | 0.01 |
ENSRNOT00000010059
|
Zfp174
|
zinc finger protein 174 |
| chr14_+_7113544 | 0.01 |
ENSRNOT00000038188
|
Hsd17b13
|
hydroxysteroid (17-beta) dehydrogenase 13 |
| chrX_-_153491837 | 0.00 |
ENSRNOT00000089027
|
LOC100360413
|
eukaryotic translation elongation factor 1 alpha 1-like |
| chr14_+_45062662 | 0.00 |
ENSRNOT00000059124
|
Tlr10
|
toll-like receptor 10 |
| chrX_-_1714061 | 0.00 |
ENSRNOT00000011592
|
Cdk16
|
cyclin-dependent kinase 16 |
| chr1_-_80809769 | 0.00 |
ENSRNOT00000045073
|
Ceacam19
|
carcinoembryonic antigen-related cell adhesion molecule 19 |
| chr1_-_101426852 | 0.00 |
ENSRNOT00000028217
|
Ruvbl2
|
RuvB-like AAA ATPase 2 |
| chr3_+_117421604 | 0.00 |
ENSRNOT00000008860
ENSRNOT00000008857 |
Slc12a1
|
solute carrier family 12 member 1 |
| chrX_-_154918095 | 0.00 |
ENSRNOT00000085224
|
LOC100911991
|
elongation factor 1-alpha 1-like |
| chr13_-_47623849 | 0.00 |
ENSRNOT00000006106
|
Il24
|
interleukin 24 |
| chr11_+_20474483 | 0.00 |
ENSRNOT00000082417
ENSRNOT00000002895 |
Ncam2
|
neural cell adhesion molecule 2 |
| chrX_+_78991223 | 0.00 |
ENSRNOT00000031200
|
Fam46d
|
family with sequence similarity 46, member D |
| chr3_-_14386118 | 0.00 |
ENSRNOT00000025649
|
Rab14
|
RAB14, member RAS oncogene family |
| chr7_+_23854846 | 0.00 |
ENSRNOT00000037290
|
Bpifc
|
BPI fold containing family C |
| chr8_+_13861459 | 0.00 |
ENSRNOT00000078161
|
Taf1d
|
TATA-box binding protein associated factor, RNA polymerase I subunit D |
| chr8_-_6034142 | 0.00 |
ENSRNOT00000014560
|
Birc2
|
baculoviral IAP repeat-containing 2 |
| chr14_+_81837809 | 0.00 |
ENSRNOT00000020576
|
Haus3
|
HAUS augmin-like complex, subunit 3 |
| chr10_+_107502695 | 0.00 |
ENSRNOT00000038088
|
Engase
|
endo-beta-N-acetylglucosaminidase |
| chr10_-_75120247 | 0.00 |
ENSRNOT00000011402
|
Lpo
|
lactoperoxidase |
| chr13_-_82753438 | 0.00 |
ENSRNOT00000075948
|
Atp1b1
|
ATPase Na+/K+ transporting subunit beta 1 |
| chr3_-_43117337 | 0.00 |
ENSRNOT00000078001
|
Nr4a2
|
nuclear receptor subfamily 4, group A, member 2 |
| chr9_+_117583610 | 0.00 |
ENSRNOT00000088647
ENSRNOT00000049426 |
Epb41l3
|
erythrocyte membrane protein band 4.1-like 3 |
| chr11_-_65208837 | 0.00 |
ENSRNOT00000003867
|
Gsk3b
|
glycogen synthase kinase 3 beta |
| chr9_+_98505259 | 0.00 |
ENSRNOT00000051810
|
Erfe
|
erythroferrone |
| chr18_-_60002529 | 0.00 |
ENSRNOT00000081014
ENSRNOT00000024264 ENSRNOT00000059162 |
Nars
|
asparaginyl-tRNA synthetase |
| chr4_-_176381477 | 0.00 |
ENSRNOT00000048367
|
Slco1a6
|
solute carrier organic anion transporter family, member 1a6 |
| chr8_+_2604962 | 0.00 |
ENSRNOT00000009993
|
Casp1
|
caspase 1 |
| chr4_-_87257667 | 0.00 |
ENSRNOT00000083491
|
Nt5c3a
|
5'-nucleotidase, cytosolic IIIA |
| chr14_-_100184192 | 0.00 |
ENSRNOT00000007044
|
Plek
|
pleckstrin |
| chrX_+_43881246 | 0.00 |
ENSRNOT00000005153
|
LOC317456
|
hypothetical LOC317456 |
Network of associatons between targets according to the STRING database.

First level regulatory network of Cebpa_Cebpg
Gene Ontology Analysis
Gene overrepresentation in biological process category:
| Log-likelihood per target | Total log-likelihood | Term | Description |
|---|---|---|---|
| 0.1 | 0.2 | GO:0052422 | modulation of catalytic activity in other organism involved in symbiotic interaction(GO:0052203) modulation by host of symbiont catalytic activity(GO:0052422) regulation of exo-alpha-sialidase activity(GO:1903015) |
| 0.0 | 0.2 | GO:0010999 | regulation of eIF2 alpha phosphorylation by heme(GO:0010999) |
| 0.0 | 0.2 | GO:1903575 | cornified envelope assembly(GO:1903575) |
| 0.0 | 0.1 | GO:0001905 | activation of membrane attack complex(GO:0001905) regulation of activation of membrane attack complex(GO:0001969) |
| 0.0 | 0.2 | GO:0015671 | oxygen transport(GO:0015671) |
| 0.0 | 0.0 | GO:0072209 | metanephric mesangial cell differentiation(GO:0072209) metanephric glomerular mesangial cell differentiation(GO:0072254) |
| 0.0 | 0.0 | GO:0032916 | positive regulation of transforming growth factor beta3 production(GO:0032916) |
| 0.0 | 0.0 | GO:0033364 | mast cell secretory granule organization(GO:0033364) |
| 0.0 | 0.0 | GO:0055129 | L-proline biosynthetic process(GO:0055129) |
Gene overrepresentation in cellular component category:
| Log-likelihood per target | Total log-likelihood | Term | Description |
|---|---|---|---|
| 0.0 | 0.2 | GO:0031838 | haptoglobin-hemoglobin complex(GO:0031838) |
| 0.0 | 0.2 | GO:0005833 | hemoglobin complex(GO:0005833) |
| 0.0 | 0.0 | GO:1990589 | ATF4-CREB1 transcription factor complex(GO:1990589) |
| 0.0 | 0.2 | GO:0043083 | synaptic cleft(GO:0043083) |
Gene overrepresentation in molecular function category:
| Log-likelihood per target | Total log-likelihood | Term | Description |
|---|---|---|---|
| 0.1 | 0.2 | GO:0031720 | haptoglobin binding(GO:0031720) |
| 0.0 | 0.2 | GO:0001849 | complement component C1q binding(GO:0001849) |
| 0.0 | 0.1 | GO:0031714 | C5a anaphylatoxin chemotactic receptor binding(GO:0031714) |
| 0.0 | 0.1 | GO:0035614 | snRNA stem-loop binding(GO:0035614) |
| 0.0 | 0.2 | GO:0005344 | oxygen transporter activity(GO:0005344) |
| 0.0 | 0.0 | GO:0004698 | calcium-dependent protein kinase C activity(GO:0004698) |
| 0.0 | 0.0 | GO:1990763 | arrestin family protein binding(GO:1990763) |
| 0.0 | 0.1 | GO:0046790 | virion binding(GO:0046790) |
| 0.0 | 0.0 | GO:0005294 | neutral L-amino acid secondary active transmembrane transporter activity(GO:0005294) |
| 0.0 | 0.0 | GO:0004735 | pyrroline-5-carboxylate reductase activity(GO:0004735) |
Gene overrepresentation in curated gene sets: REACTOME pathways category:
| Log-likelihood per target | Total log-likelihood | Term | Description |
|---|---|---|---|
| 0.0 | 0.1 | REACTOME OPSINS | Genes involved in Opsins |