Project
GSE49485: Hypoxia transcriptome sequencing of rat brain.
Navigation
Downloads
Results for Atf7_E4f1
Z-value: 0.52
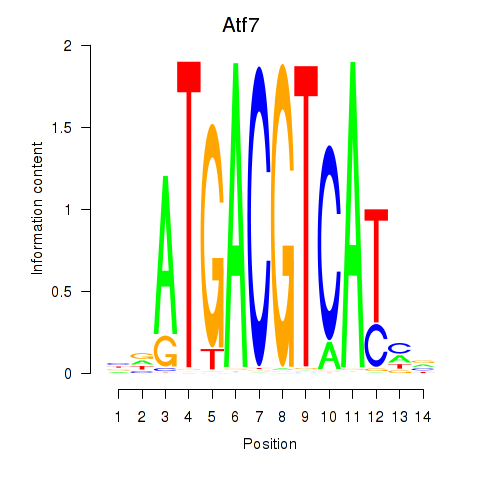
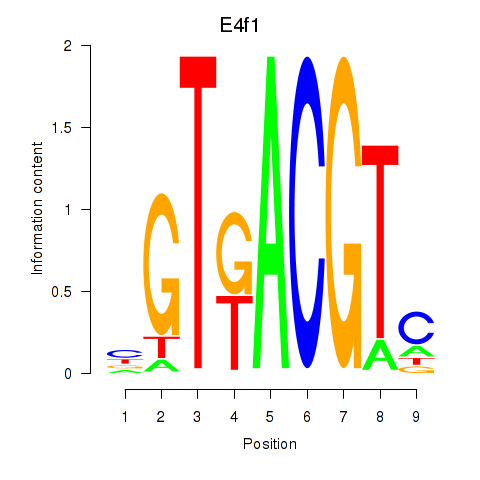
Motif logo
Transcription factors associated with Atf7_E4f1
| Gene Symbol | Gene ID | Gene Info |
|---|---|---|
|
Atf7
|
ENSRNOG00000015269 | activating transcription factor 7 |
|
E4f1
|
ENSRNOG00000009224 | E4F transcription factor 1 |
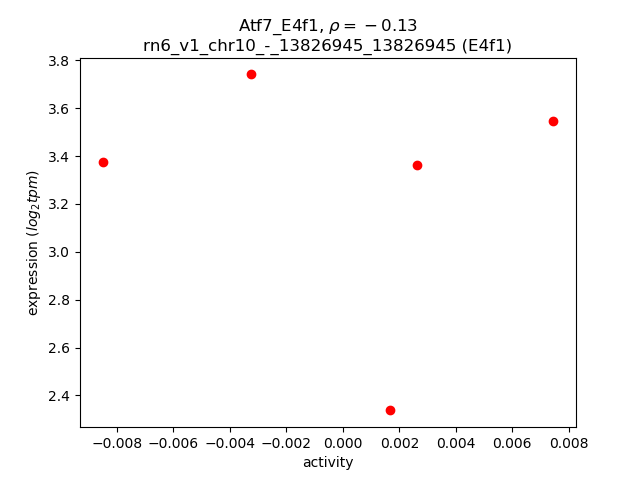
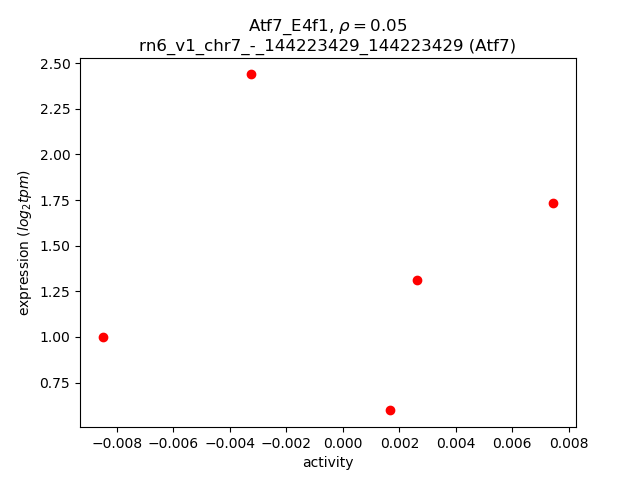
Activity-expression correlation:
| Gene | Promoter | Pearson corr. coef. | P-value | Plot |
|---|---|---|---|---|
| E4f1 | rn6_v1_chr10_-_13826945_13826945 | -0.13 | 8.4e-01 | Click! |
| Atf7 | rn6_v1_chr7_-_144223429_144223429 | 0.05 | 9.3e-01 | Click! |
Activity profile of Atf7_E4f1 motif
Sorted Z-values of Atf7_E4f1 motif
| Promoter | Log-likelihood | Transcript | Gene | Gene Info |
|---|---|---|---|---|
| chr17_-_9695292 | 1.19 |
ENSRNOT00000036162
|
Prr7
|
proline rich 7 (synaptic) |
| chr4_-_117296082 | 0.34 |
ENSRNOT00000021097
|
Egr4
|
early growth response 4 |
| chr12_-_13668515 | 0.33 |
ENSRNOT00000086847
|
Fscn1
|
fascin actin-bundling protein 1 |
| chr8_+_114866768 | 0.29 |
ENSRNOT00000076731
|
Wdr82
|
WD repeat domain 82 |
| chr10_-_85574889 | 0.29 |
ENSRNOT00000072274
|
LOC691153
|
hypothetical protein LOC691153 |
| chr5_-_152464850 | 0.28 |
ENSRNOT00000021937
|
Zfp593
|
zinc finger protein 593 |
| chr17_+_10463303 | 0.22 |
ENSRNOT00000060822
|
Rnf44
|
ring finger protein 44 |
| chr7_+_120580743 | 0.21 |
ENSRNOT00000017181
|
Maff
|
MAF bZIP transcription factor F |
| chr10_+_16970626 | 0.21 |
ENSRNOT00000005383
|
Dusp1
|
dual specificity phosphatase 1 |
| chr17_-_90315492 | 0.20 |
ENSRNOT00000070807
|
Gng4
|
G protein subunit gamma 4 |
| chr9_+_102862890 | 0.20 |
ENSRNOT00000050494
ENSRNOT00000080129 |
Fam174a
|
family with sequence similarity 174, member A |
| chrX_-_73778595 | 0.19 |
ENSRNOT00000076081
ENSRNOT00000075926 ENSRNOT00000003782 |
Rlim
|
ring finger protein, LIM domain interacting |
| chr12_-_18531161 | 0.19 |
ENSRNOT00000037829
|
Akap17a
|
A-kinase anchoring protein 17A |
| chr17_-_43821536 | 0.18 |
ENSRNOT00000072286
|
RGD1562378
|
histone H4 variant H4-v.1 |
| chr2_+_164549455 | 0.18 |
ENSRNOT00000017151
|
Mlf1
|
myeloid leukemia factor 1 |
| chr20_-_22459025 | 0.14 |
ENSRNOT00000000792
|
Egr2
|
early growth response 2 |
| chr8_+_52829085 | 0.14 |
ENSRNOT00000007754
|
RGD1563941
|
similar to hypothetical protein FLJ20010 |
| chr1_-_80544825 | 0.14 |
ENSRNOT00000057802
ENSRNOT00000040060 ENSRNOT00000067049 ENSRNOT00000052387 ENSRNOT00000073352 |
Relb
|
RELB proto-oncogene, NF-kB subunit |
| chr10_+_89578212 | 0.13 |
ENSRNOT00000028178
|
Arl4d
|
ADP-ribosylation factor like GTPase 4D |
| chr11_+_88424414 | 0.13 |
ENSRNOT00000022328
|
Spag6l
|
sperm associated antigen 6-like |
| chr2_-_104461863 | 0.12 |
ENSRNOT00000016953
|
Crh
|
corticotropin releasing hormone |
| chr12_+_37984790 | 0.12 |
ENSRNOT00000001445
|
Vps37b
|
VPS37B, ESCRT-I subunit |
| chr16_-_20486707 | 0.12 |
ENSRNOT00000026470
|
Jund
|
JunD proto-oncogene, AP-1 transcription factor subunit |
| chr11_-_36479868 | 0.12 |
ENSRNOT00000075762
|
LOC100911295
|
non-histone chromosomal protein HMG-14-like |
| chr1_-_190370499 | 0.12 |
ENSRNOT00000084389
|
AABR07005618.1
|
|
| chr10_-_45297385 | 0.11 |
ENSRNOT00000041187
|
Hist3h2bb
|
histone cluster 3 H2B family member b |
| chr12_-_18530724 | 0.09 |
ENSRNOT00000078999
|
Akap17a
|
A-kinase anchoring protein 17A |
| chr1_-_80221710 | 0.09 |
ENSRNOT00000091687
|
Fosb
|
FosB proto-oncogene, AP-1 transcription factor subunit |
| chr20_+_5080070 | 0.09 |
ENSRNOT00000086950
ENSRNOT00000077082 |
Abhd16a
|
abhydrolase domain containing 16A |
| chr5_+_159845774 | 0.09 |
ENSRNOT00000012328
|
Epha2
|
Eph receptor A2 |
| chr19_+_55917736 | 0.09 |
ENSRNOT00000020635
|
Rpl13
|
ribosomal protein L13 |
| chr10_+_102136283 | 0.09 |
ENSRNOT00000003735
|
Sstr2
|
somatostatin receptor 2 |
| chr20_-_10680283 | 0.08 |
ENSRNOT00000001579
|
Sik1
|
salt-inducible kinase 1 |
| chr17_+_57074525 | 0.08 |
ENSRNOT00000020012
ENSRNOT00000074146 |
Crem
|
cAMP responsive element modulator |
| chr20_+_4966817 | 0.08 |
ENSRNOT00000081527
ENSRNOT00000081265 |
Lsm2
|
LSM2 homolog, U6 small nuclear RNA and mRNA degradation associated |
| chr6_+_132702448 | 0.08 |
ENSRNOT00000005743
|
Yy1
|
YY1 transcription factor |
| chr14_+_108826831 | 0.08 |
ENSRNOT00000083146
ENSRNOT00000009421 |
Bcl11a
|
B-cell CLL/lymphoma 11A |
| chr17_+_31493107 | 0.08 |
ENSRNOT00000023611
ENSRNOT00000086264 |
Tubb2a
|
tubulin, beta 2A class IIa |
| chr2_+_189629297 | 0.08 |
ENSRNOT00000049810
|
Dennd4b
|
DENN domain containing 4B |
| chr7_+_123168811 | 0.08 |
ENSRNOT00000007091
|
Csdc2
|
cold shock domain containing C2 |
| chr1_-_220265772 | 0.08 |
ENSRNOT00000027119
|
Npas4
|
neuronal PAS domain protein 4 |
| chr16_-_49574314 | 0.08 |
ENSRNOT00000017568
ENSRNOT00000085535 ENSRNOT00000017054 |
Pdlim3
|
PDZ and LIM domain 3 |
| chr1_-_188190778 | 0.07 |
ENSRNOT00000092657
ENSRNOT00000022988 |
Coq7
|
coenzyme Q7, hydroxylase |
| chr9_-_85243001 | 0.07 |
ENSRNOT00000020219
|
Scg2
|
secretogranin II |
| chr3_+_150910398 | 0.07 |
ENSRNOT00000055310
|
Tp53inp2
|
tumor protein p53 inducible nuclear protein 2 |
| chr19_+_56272162 | 0.07 |
ENSRNOT00000030399
|
Afg3l1
|
AFG3(ATPase family gene 3)-like 1 (S. cerevisiae) |
| chrX_-_45522665 | 0.07 |
ENSRNOT00000030771
|
RGD1562200
|
similar to GS2 gene |
| chr4_+_84854386 | 0.06 |
ENSRNOT00000013620
|
Mturn
|
maturin, neural progenitor differentiation regulator homolog |
| chr10_-_65424802 | 0.06 |
ENSRNOT00000018468
|
Traf4
|
Tnf receptor associated factor 4 |
| chr7_-_44121130 | 0.06 |
ENSRNOT00000005706
|
Nts
|
neurotensin |
| chr10_+_31324512 | 0.06 |
ENSRNOT00000008559
|
Fndc9
|
fibronectin type III domain containing 9 |
| chr6_+_126434226 | 0.06 |
ENSRNOT00000090857
|
Chga
|
chromogranin A |
| chr4_+_99239115 | 0.06 |
ENSRNOT00000009515
|
Cd8a
|
CD8a molecule |
| chr6_+_136330383 | 0.06 |
ENSRNOT00000093106
ENSRNOT00000092774 ENSRNOT00000065281 ENSRNOT00000015935 |
Klc1
|
kinesin light chain 1 |
| chr9_+_82674202 | 0.06 |
ENSRNOT00000027208
|
Tmem198
|
transmembrane protein 198 |
| chr3_+_176093640 | 0.06 |
ENSRNOT00000086541
|
Ogfr
|
opioid growth factor receptor |
| chr1_-_64090017 | 0.06 |
ENSRNOT00000086622
ENSRNOT00000091654 |
Rps9
|
ribosomal protein S9 |
| chr1_+_86938138 | 0.06 |
ENSRNOT00000075601
|
Ccer2
|
coiled-coil glutamate-rich protein 2 |
| chr2_+_240021152 | 0.06 |
ENSRNOT00000012473
|
Tacr3
|
tachykinin receptor 3 |
| chr1_+_81395841 | 0.05 |
ENSRNOT00000072750
|
Irgq
|
immunity-related GTPase Q |
| chr16_+_74237001 | 0.05 |
ENSRNOT00000026039
|
Polb
|
DNA polymerase beta |
| chr18_+_62174670 | 0.05 |
ENSRNOT00000025362
|
Pmaip1
|
phorbol-12-myristate-13-acetate-induced protein 1 |
| chr12_-_2007516 | 0.05 |
ENSRNOT00000037564
|
Pex11g
|
peroxisomal biogenesis factor 11 gamma |
| chr16_-_61091169 | 0.05 |
ENSRNOT00000016328
|
Dusp4
|
dual specificity phosphatase 4 |
| chr7_-_130326470 | 0.05 |
ENSRNOT00000049538
|
Lmf2
|
lipase maturation factor 2 |
| chr10_+_85301875 | 0.05 |
ENSRNOT00000080935
|
Socs7
|
suppressor of cytokine signaling 7 |
| chr4_+_153385205 | 0.05 |
ENSRNOT00000016561
|
Bcl2l13
|
BCL2 like 13 |
| chr6_+_1657331 | 0.05 |
ENSRNOT00000049672
ENSRNOT00000079864 |
Qpct
|
glutaminyl-peptide cyclotransferase |
| chr7_-_2588686 | 0.05 |
ENSRNOT00000048848
|
Rbms2
|
RNA binding motif, single stranded interacting protein 2 |
| chr8_-_62248013 | 0.05 |
ENSRNOT00000080012
ENSRNOT00000089602 |
Scamp5
|
secretory carrier membrane protein 5 |
| chr10_+_58784660 | 0.05 |
ENSRNOT00000019925
|
LOC100912483
|
uncharacterized LOC100912483 |
| chr11_+_39482408 | 0.04 |
ENSRNOT00000075126
|
Hmgn1
|
high mobility group nucleosome binding domain 1 |
| chr2_+_86951776 | 0.04 |
ENSRNOT00000087275
|
AABR07009105.1
|
|
| chr10_-_13542077 | 0.04 |
ENSRNOT00000008736
|
Atp6v0c
|
ATPase H+ transporting V0 subunit C |
| chr9_+_82053581 | 0.04 |
ENSRNOT00000086375
|
Wnt10a
|
wingless-type MMTV integration site family, member 10A |
| chr4_-_88565292 | 0.04 |
ENSRNOT00000008948
|
Lancl2
|
LanC like 2 |
| chr4_-_182600258 | 0.04 |
ENSRNOT00000067970
|
Ergic2
|
ERGIC and golgi 2 |
| chr20_+_3299730 | 0.04 |
ENSRNOT00000078538
|
Prr3
|
proline rich 3 |
| chr14_-_86739335 | 0.04 |
ENSRNOT00000078282
|
Purb
|
purine rich element binding protein B |
| chr16_-_20873344 | 0.04 |
ENSRNOT00000027381
|
Cope
|
coatomer protein complex, subunit epsilon |
| chr13_-_50916982 | 0.04 |
ENSRNOT00000004408
|
Btg2
|
BTG anti-proliferation factor 2 |
| chr3_+_164986421 | 0.04 |
ENSRNOT00000039403
|
Mocs3
|
molybdenum cofactor synthesis 3 |
| chr4_+_8256611 | 0.04 |
ENSRNOT00000061894
|
AABR07059198.1
|
|
| chr4_+_21872856 | 0.04 |
ENSRNOT00000044810
|
Dmtf1
|
cyclin D binding myb-like transcription factor 1 |
| chr19_-_56731372 | 0.04 |
ENSRNOT00000024182
|
Nup133
|
nucleoporin 133 |
| chr10_-_90127600 | 0.04 |
ENSRNOT00000028368
|
Lsm12
|
LSM12 homolog |
| chr18_-_14016713 | 0.04 |
ENSRNOT00000041125
|
Nol4
|
nucleolar protein 4 |
| chr9_+_10535340 | 0.04 |
ENSRNOT00000075408
|
Znrf4
|
zinc and ring finger 4 |
| chr20_-_3299420 | 0.04 |
ENSRNOT00000090999
|
Gnl1
|
G protein nucleolar 1 |
| chr17_+_35677984 | 0.04 |
ENSRNOT00000024609
|
Uqcrfs1
|
ubiquinol-cytochrome c reductase, Rieske iron-sulfur polypeptide 1 |
| chr14_+_44413636 | 0.04 |
ENSRNOT00000003552
|
Smim14
|
small integral membrane protein 14 |
| chr9_-_78969013 | 0.04 |
ENSRNOT00000019772
ENSRNOT00000057585 |
Fn1
|
fibronectin 1 |
| chr7_+_123381077 | 0.04 |
ENSRNOT00000082603
ENSRNOT00000056041 |
Srebf2
|
sterol regulatory element binding transcription factor 2 |
| chr1_-_89179825 | 0.04 |
ENSRNOT00000028514
|
Tmem147
|
transmembrane protein 147 |
| chr9_+_17817721 | 0.04 |
ENSRNOT00000086986
ENSRNOT00000026920 |
Hsp90ab1
|
heat shock protein 90 alpha family class B member 1 |
| chr6_+_98284170 | 0.04 |
ENSRNOT00000031979
|
Rhoj
|
ras homolog family member J |
| chr14_+_107767392 | 0.04 |
ENSRNOT00000012847
|
Cct4
|
chaperonin containing TCP1 subunit 4 |
| chr8_+_90343154 | 0.04 |
ENSRNOT00000068482
|
Irak1bp1
|
interleukin-1 receptor-associated kinase 1 binding protein 1 |
| chr16_+_20317446 | 0.04 |
ENSRNOT00000025626
|
Ccdc124
|
coiled-coil domain containing 124 |
| chr1_-_197098649 | 0.04 |
ENSRNOT00000022271
|
Gtf3c1
|
general transcription factor IIIC subunit 1 |
| chr1_-_80666566 | 0.04 |
ENSRNOT00000082125
ENSRNOT00000025388 |
Nectin2
|
nectin cell adhesion molecule 2 |
| chr10_-_57064600 | 0.03 |
ENSRNOT00000032926
|
Cxcl16
|
C-X-C motif chemokine ligand 16 |
| chr3_+_8802852 | 0.03 |
ENSRNOT00000033934
|
Lrrc8a
|
leucine rich repeat containing 8 family, member A |
| chr7_-_120780641 | 0.03 |
ENSRNOT00000076164
|
Ddx17
|
DEAD-box helicase 17 |
| chr4_+_27175243 | 0.03 |
ENSRNOT00000009985
|
Cyp51
|
cytochrome P450, family 51 |
| chr8_+_115193146 | 0.03 |
ENSRNOT00000056391
|
Iqcf1
|
IQ motif containing F1 |
| chr2_+_257425679 | 0.03 |
ENSRNOT00000066199
|
Fubp1
|
far upstream element binding protein 1 |
| chr5_-_58163584 | 0.03 |
ENSRNOT00000060594
|
Ccl27
|
C-C motif chemokine ligand 27 |
| chr2_+_188784222 | 0.03 |
ENSRNOT00000028095
|
Pmvk
|
phosphomevalonate kinase |
| chr7_-_18612118 | 0.03 |
ENSRNOT00000078122
ENSRNOT00000010197 |
Rab11b
|
RAB11B, member RAS oncogene family |
| chr1_-_72464492 | 0.03 |
ENSRNOT00000068550
|
Nat14
|
N-acetyltransferase 14 |
| chr7_-_2588843 | 0.03 |
ENSRNOT00000088619
|
Rbms2
|
RNA binding motif, single stranded interacting protein 2 |
| chr7_-_120780108 | 0.03 |
ENSRNOT00000018185
|
Ddx17
|
DEAD-box helicase 17 |
| chr1_+_78015722 | 0.03 |
ENSRNOT00000002043
|
Kptn
|
kaptin (actin binding protein) |
| chr7_-_11963268 | 0.03 |
ENSRNOT00000080342
ENSRNOT00000025266 |
Csnk1g2
|
casein kinase 1, gamma 2 |
| chr13_-_102857551 | 0.03 |
ENSRNOT00000080309
|
Mark1
|
microtubule affinity regulating kinase 1 |
| chr7_+_120923274 | 0.03 |
ENSRNOT00000049247
|
Gtpbp1
|
GTP binding protein 1 |
| chr20_-_3815834 | 0.03 |
ENSRNOT00000000543
|
Ring1
|
ring finger protein 1 |
| chr6_+_8346704 | 0.03 |
ENSRNOT00000092218
|
AC111831.2
|
|
| chr3_-_43119159 | 0.03 |
ENSRNOT00000041394
|
Nr4a2
|
nuclear receptor subfamily 4, group A, member 2 |
| chr3_+_125428260 | 0.03 |
ENSRNOT00000028892
|
Chgb
|
chromogranin B |
| chr1_-_37863756 | 0.03 |
ENSRNOT00000077781
|
Zfp874b
|
zinc finger protein 874b |
| chr8_-_111850075 | 0.03 |
ENSRNOT00000082097
|
Cdv3
|
CDV3 homolog |
| chr6_+_28515025 | 0.03 |
ENSRNOT00000088033
ENSRNOT00000005317 ENSRNOT00000081141 |
Dnajc27
|
DnaJ heat shock protein family (Hsp40) member C27 |
| chr1_-_64021321 | 0.03 |
ENSRNOT00000090819
|
Rps9
|
ribosomal protein S9 |
| chr17_-_23792353 | 0.03 |
ENSRNOT00000019089
|
Tbc1d7
|
TBC1 domain family, member 7 |
| chr10_-_88842233 | 0.03 |
ENSRNOT00000026760
|
Stat3
|
signal transducer and activator of transcription 3 |
| chr9_-_82673898 | 0.03 |
ENSRNOT00000027165
|
Chpf
|
chondroitin polymerizing factor |
| chr19_-_25378974 | 0.03 |
ENSRNOT00000011150
|
Ccdc130
|
coiled-coil domain containing 130 |
| chr14_+_86414949 | 0.03 |
ENSRNOT00000083394
ENSRNOT00000057199 |
LOC103693780
|
2-oxoglutarate dehydrogenase, mitochondrial-like |
| chr17_+_10537365 | 0.03 |
ENSRNOT00000023651
|
Cltb
|
clathrin, light chain B |
| chr6_+_10912383 | 0.03 |
ENSRNOT00000061747
ENSRNOT00000086247 |
Ttc7a
|
tetratricopeptide repeat domain 7A |
| chr15_+_52265557 | 0.03 |
ENSRNOT00000015969
|
Nudt18
|
nudix hydrolase 18 |
| chr14_-_18531179 | 0.03 |
ENSRNOT00000003703
|
Areg
|
amphiregulin |
| chr12_-_16002788 | 0.03 |
ENSRNOT00000090318
|
Amz1
|
archaelysin family metallopeptidase 1 |
| chrX_+_1321315 | 0.03 |
ENSRNOT00000014250
|
Syn1
|
synapsin I |
| chrX_-_158261717 | 0.03 |
ENSRNOT00000086804
|
RGD1561558
|
similar to RIKEN cDNA 1700001F22 |
| chr16_-_20534209 | 0.03 |
ENSRNOT00000026601
|
Mk1
|
Mk1 protein |
| chr1_+_196996581 | 0.03 |
ENSRNOT00000021690
|
Il21r
|
interleukin 21 receptor |
| chr18_+_24961245 | 0.02 |
ENSRNOT00000060996
|
Map3k2
|
mitogen activated protein kinase kinase kinase 2 |
| chr7_+_121311024 | 0.02 |
ENSRNOT00000092260
ENSRNOT00000023066 ENSRNOT00000081377 |
Syngr1
|
synaptogyrin 1 |
| chr20_-_3299580 | 0.02 |
ENSRNOT00000050373
|
Gnl1
|
G protein nucleolar 1 |
| chr6_-_127248372 | 0.02 |
ENSRNOT00000085517
|
Asb2
|
ankyrin repeat and SOCS box-containing 2 |
| chr19_+_25181564 | 0.02 |
ENSRNOT00000008104
|
Rfx1
|
regulatory factor X1 |
| chr1_+_100473643 | 0.02 |
ENSRNOT00000026379
|
Josd2
|
Josephin domain containing 2 |
| chr3_+_175930505 | 0.02 |
ENSRNOT00000012611
|
Ogfr
|
opioid growth factor receptor |
| chr15_+_57290849 | 0.02 |
ENSRNOT00000014909
|
Cpb2
|
carboxypeptidase B2 |
| chr2_+_93518806 | 0.02 |
ENSRNOT00000050987
|
Snx16
|
sorting nexin 16 |
| chr13_-_51201331 | 0.02 |
ENSRNOT00000005272
ENSRNOT00000078990 |
Tmem183a
|
transmembrane protein 183A |
| chr5_-_61733778 | 0.02 |
ENSRNOT00000090566
|
Tstd2
|
thiosulfate sulfurtransferase like domain containing 2 |
| chr14_+_1462358 | 0.02 |
ENSRNOT00000077243
|
Csf2ra
|
colony stimulating factor 2 receptor alpha subunit |
| chr7_-_77372398 | 0.02 |
ENSRNOT00000079644
ENSRNOT00000007999 |
Azin1
|
antizyme inhibitor 1 |
| chr12_+_2170630 | 0.02 |
ENSRNOT00000071928
|
Pet100
|
PET100 homolog |
| chr11_+_80255790 | 0.02 |
ENSRNOT00000002522
|
Bcl6
|
B-cell CLL/lymphoma 6 |
| chr7_-_122635731 | 0.02 |
ENSRNOT00000025925
|
St13
|
suppression of tumorigenicity 13 |
| chr4_+_157453069 | 0.02 |
ENSRNOT00000088622
|
Mlf2
|
myeloid leukemia factor 2 |
| chr5_-_86554102 | 0.02 |
ENSRNOT00000083340
ENSRNOT00000007710 |
Cdk5rap2
|
CDK5 regulatory subunit associated protein 2 |
| chr11_-_38274217 | 0.02 |
ENSRNOT00000002206
|
Ripk4
|
receptor-interacting serine-threonine kinase 4 |
| chrX_+_45420596 | 0.02 |
ENSRNOT00000051897
|
Sts
|
steroid sulfatase (microsomal), isozyme S |
| chr6_+_18821815 | 0.02 |
ENSRNOT00000062057
|
Mtm1
|
myotubularin 1 |
| chr20_+_31298269 | 0.02 |
ENSRNOT00000000673
|
Ppa1
|
pyrophosphatase (inorganic) 1 |
| chr2_-_66608324 | 0.02 |
ENSRNOT00000077597
|
Cln5
|
ceroid-lipofuscinosis, neuronal 5 |
| chr8_-_62987182 | 0.02 |
ENSRNOT00000070885
|
Islr2
|
immunoglobulin superfamily containing leucine-rich repeat 2 |
| chr8_+_116311078 | 0.02 |
ENSRNOT00000037363
|
Rassf1
|
Ras association domain family member 1 |
| chr4_+_157452607 | 0.02 |
ENSRNOT00000022467
|
Mlf2
|
myeloid leukemia factor 2 |
| chr8_+_22021213 | 0.02 |
ENSRNOT00000049706
|
Mrpl4
|
mitochondrial ribosomal protein L4 |
| chr10_-_38642397 | 0.02 |
ENSRNOT00000023628
|
Hspa4
|
heat shock protein family A member 4 |
| chr9_-_98597359 | 0.02 |
ENSRNOT00000027506
|
Per2
|
period circadian clock 2 |
| chr1_+_201256910 | 0.02 |
ENSRNOT00000090143
|
Tacc2
|
transforming, acidic coiled-coil containing protein 2 |
| chr12_+_17252093 | 0.02 |
ENSRNOT00000047634
|
Zfand2a
|
zinc finger AN1-type containing 2A |
| chr14_-_86868598 | 0.02 |
ENSRNOT00000087212
|
Nacad
|
NAC alpha domain containing |
| chr1_-_16203838 | 0.02 |
ENSRNOT00000018556
ENSRNOT00000078586 |
Pde7b
|
phosphodiesterase 7B |
| chr6_-_41870046 | 0.02 |
ENSRNOT00000005863
|
Lpin1
|
lipin 1 |
| chr20_-_10407554 | 0.02 |
ENSRNOT00000074081
|
U2af1
|
U2 small nuclear RNA auxiliary factor 1 |
| chr2_-_30748325 | 0.02 |
ENSRNOT00000084294
ENSRNOT00000083089 |
Mrps36
|
mitochondrial ribosomal protein S36 |
| chrX_-_158978995 | 0.02 |
ENSRNOT00000001179
|
Mmgt1
|
membrane magnesium transporter 1 |
| chr12_+_52072188 | 0.02 |
ENSRNOT00000056725
|
Noc4l
|
nucleolar complex associated 4 homolog |
| chr1_+_177495782 | 0.02 |
ENSRNOT00000021020
|
Tead1
|
TEA domain transcription factor 1 |
| chr8_-_111850393 | 0.02 |
ENSRNOT00000044956
|
Cdv3
|
CDV3 homolog |
| chr4_-_168517177 | 0.02 |
ENSRNOT00000009151
|
Dusp16
|
dual specificity phosphatase 16 |
| chr6_+_72891725 | 0.02 |
ENSRNOT00000038074
|
Nubpl
|
nucleotide binding protein-like |
| chr13_-_108841482 | 0.02 |
ENSRNOT00000004632
ENSRNOT00000086775 |
Ptpn14
|
protein tyrosine phosphatase, non-receptor type 14 |
| chr3_-_120011364 | 0.01 |
ENSRNOT00000018922
|
Fahd2a
|
fumarylacetoacetate hydrolase domain containing 2A |
| chr8_-_55467579 | 0.01 |
ENSRNOT00000040162
ENSRNOT00000088607 |
Layn
|
layilin |
| chr1_-_170238890 | 0.01 |
ENSRNOT00000023502
|
Fam160a2
|
family with sequence similarity 160, member A2 |
| chr8_-_21995806 | 0.01 |
ENSRNOT00000028034
|
S1pr2
|
sphingosine-1-phosphate receptor 2 |
| chrX_-_156399760 | 0.01 |
ENSRNOT00000086921
|
Fam50a
|
family with sequence similarity 50, member A |
| chr2_-_104133985 | 0.01 |
ENSRNOT00000088167
ENSRNOT00000067725 |
Pde7a
|
phosphodiesterase 7A |
| chr4_+_83391283 | 0.01 |
ENSRNOT00000031365
|
Creb5
|
cAMP responsive element binding protein 5 |
| chr19_+_27404712 | 0.01 |
ENSRNOT00000023657
|
Mylk3
|
myosin light chain kinase 3 |
| chr19_-_55300403 | 0.01 |
ENSRNOT00000018591
|
Rnf166
|
ring finger protein 166 |
| chr10_-_56531483 | 0.01 |
ENSRNOT00000022343
|
Eif5a
|
eukaryotic translation initiation factor 5A |
| chr14_-_9456990 | 0.01 |
ENSRNOT00000002918
|
Cds1
|
CDP-diacylglycerol synthase 1 |
| chr9_-_37231291 | 0.01 |
ENSRNOT00000016237
|
Ptp4a1
|
protein tyrosine phosphatase type IVA, member 1 |
| chr12_-_13067341 | 0.01 |
ENSRNOT00000029692
|
Fam220a
|
family with sequence similarity 220, member A |
| chr14_-_86706626 | 0.01 |
ENSRNOT00000082893
|
H2afv
|
H2A histone family, member V |
| chr1_+_192025357 | 0.01 |
ENSRNOT00000025072
|
Ubfd1
|
ubiquitin family domain containing 1 |
| chrX_-_111887906 | 0.01 |
ENSRNOT00000085118
|
Tsc22d3
|
TSC22 domain family, member 3 |
| chr8_+_44136496 | 0.01 |
ENSRNOT00000087022
|
Scn3b
|
sodium voltage-gated channel beta subunit 3 |
| chr10_-_110182291 | 0.01 |
ENSRNOT00000015178
ENSRNOT00000054936 |
Csnk1d
|
casein kinase 1, delta |
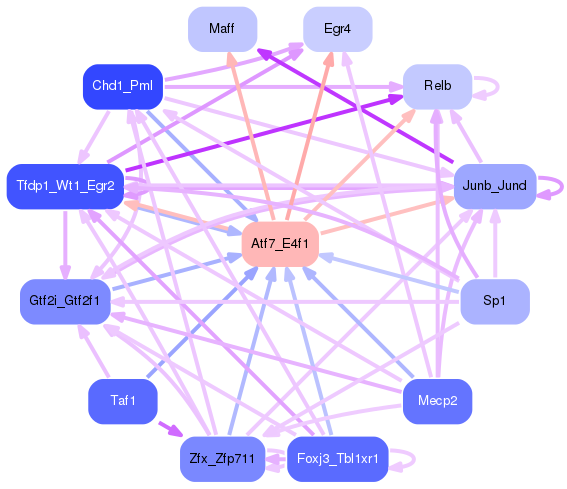
Network of associatons between targets according to the STRING database.

First level regulatory network of Atf7_E4f1
Gene Ontology Analysis
Gene overrepresentation in biological process category:
| Log-likelihood per target | Total log-likelihood | Term | Description |
|---|---|---|---|
| 0.1 | 0.2 | GO:1900095 | random inactivation of X chromosome(GO:0060816) regulation of dosage compensation by inactivation of X chromosome(GO:1900095) |
| 0.1 | 0.3 | GO:0071460 | cellular response to cell-matrix adhesion(GO:0071460) |
| 0.0 | 0.1 | GO:1903774 | positive regulation of viral budding via host ESCRT complex(GO:1903774) |
| 0.0 | 0.1 | GO:0021593 | rhombomere morphogenesis(GO:0021593) |
| 0.0 | 0.3 | GO:1903026 | negative regulation of RNA polymerase II regulatory region sequence-specific DNA binding(GO:1903026) |
| 0.0 | 0.1 | GO:0070093 | hormone-mediated apoptotic signaling pathway(GO:0008628) positive regulation of cortisol secretion(GO:0051464) negative regulation of glucagon secretion(GO:0070093) |
| 0.0 | 0.1 | GO:0048319 | axial mesoderm morphogenesis(GO:0048319) |
| 0.0 | 0.1 | GO:1903860 | negative regulation of dendrite extension(GO:1903860) |
| 0.0 | 0.1 | GO:0007571 | age-dependent response to oxidative stress(GO:0001306) age-dependent general metabolic decline(GO:0007571) |
| 0.0 | 0.1 | GO:0052651 | monoacylglycerol metabolic process(GO:0046462) monoacylglycerol catabolic process(GO:0052651) |
| 0.0 | 0.1 | GO:0045903 | positive regulation of translational fidelity(GO:0045903) |
| 0.0 | 0.1 | GO:1900738 | positive regulation of phospholipase C-activating G-protein coupled receptor signaling pathway(GO:1900738) |
| 0.0 | 0.1 | GO:0045065 | cytotoxic T cell differentiation(GO:0045065) |
| 0.0 | 0.1 | GO:0034696 | response to prostaglandin F(GO:0034696) |
| 0.0 | 0.1 | GO:1900740 | regulation of protein insertion into mitochondrial membrane involved in apoptotic signaling pathway(GO:1900739) positive regulation of protein insertion into mitochondrial membrane involved in apoptotic signaling pathway(GO:1900740) |
| 0.0 | 0.1 | GO:0044375 | regulation of peroxisome size(GO:0044375) |
| 0.0 | 0.1 | GO:0038169 | somatostatin receptor signaling pathway(GO:0038169) somatostatin signaling pathway(GO:0038170) |
| 0.0 | 0.0 | GO:0018199 | peptidyl-glutamine modification(GO:0018199) |
| 0.0 | 0.2 | GO:0035970 | peptidyl-threonine dephosphorylation(GO:0035970) |
| 0.0 | 0.0 | GO:0000720 | pyrimidine dimer repair by nucleotide-excision repair(GO:0000720) |
| 0.0 | 0.0 | GO:1901421 | positive regulation of response to alcohol(GO:1901421) |
| 0.0 | 0.1 | GO:0032792 | negative regulation of CREB transcription factor activity(GO:0032792) |
| 0.0 | 0.0 | GO:0061034 | olfactory bulb mitral cell layer development(GO:0061034) |
| 0.0 | 0.0 | GO:0007161 | substrate-dependent cell migration, cell attachment to substrate(GO:0006931) calcium-independent cell-matrix adhesion(GO:0007161) interaction with other organism via secreted substance involved in symbiotic interaction(GO:0052047) regulation of transforming growth factor-beta secretion(GO:2001201) |
| 0.0 | 0.0 | GO:0090370 | negative regulation of cholesterol efflux(GO:0090370) |
| 0.0 | 0.1 | GO:0071386 | cellular response to corticosterone stimulus(GO:0071386) |
| 0.0 | 0.1 | GO:0097332 | response to antipsychotic drug(GO:0097332) |
| 0.0 | 0.0 | GO:1903660 | negative regulation of complement-dependent cytotoxicity(GO:1903660) |
| 0.0 | 0.2 | GO:0045653 | negative regulation of megakaryocyte differentiation(GO:0045653) |
| 0.0 | 0.1 | GO:0035617 | stress granule disassembly(GO:0035617) |
| 0.0 | 0.0 | GO:0060370 | susceptibility to T cell mediated cytotoxicity(GO:0060370) |
| 0.0 | 0.1 | GO:0032688 | negative regulation of interferon-beta production(GO:0032688) |
| 0.0 | 0.1 | GO:0032483 | regulation of Rab protein signal transduction(GO:0032483) |
| 0.0 | 0.0 | GO:0060474 | positive regulation of sperm motility involved in capacitation(GO:0060474) |
| 0.0 | 0.2 | GO:0080182 | histone H3-K4 trimethylation(GO:0080182) |
| 0.0 | 0.0 | GO:0019287 | isopentenyl diphosphate biosynthetic process, mevalonate pathway(GO:0019287) |
| 0.0 | 0.0 | GO:0045054 | constitutive secretory pathway(GO:0045054) |
| 0.0 | 0.0 | GO:0018307 | enzyme active site formation(GO:0018307) |
| 0.0 | 0.0 | GO:0048294 | negative regulation of isotype switching to IgE isotypes(GO:0048294) |
| 0.0 | 0.0 | GO:0021986 | epithalamus development(GO:0021538) habenula development(GO:0021986) |
Gene overrepresentation in cellular component category:
| Log-likelihood per target | Total log-likelihood | Term | Description |
|---|---|---|---|
| 0.1 | 0.3 | GO:0044393 | microspike(GO:0044393) |
| 0.0 | 0.1 | GO:1990716 | axonemal central apparatus(GO:1990716) |
| 0.0 | 0.1 | GO:0035976 | AP1 complex(GO:0035976) |
| 0.0 | 0.1 | GO:0005745 | m-AAA complex(GO:0005745) |
| 0.0 | 0.2 | GO:0072357 | PTW/PP1 phosphatase complex(GO:0072357) |
| 0.0 | 0.1 | GO:0033256 | I-kappaB/NF-kappaB complex(GO:0033256) |
| 0.0 | 0.1 | GO:0000813 | ESCRT I complex(GO:0000813) |
| 0.0 | 0.0 | GO:0032937 | SREBP-SCAP-Insig complex(GO:0032937) |
| 0.0 | 0.1 | GO:0031314 | extrinsic component of mitochondrial inner membrane(GO:0031314) |
Gene overrepresentation in molecular function category:
| Log-likelihood per target | Total log-likelihood | Term | Description |
|---|---|---|---|
| 0.1 | 0.3 | GO:0031177 | phosphopantetheine binding(GO:0031177) |
| 0.1 | 0.3 | GO:0008330 | protein tyrosine/threonine phosphatase activity(GO:0008330) |
| 0.0 | 0.1 | GO:0051431 | corticotropin-releasing hormone receptor 2 binding(GO:0051431) |
| 0.0 | 0.1 | GO:0050253 | retinyl-palmitate esterase activity(GO:0050253) |
| 0.0 | 0.1 | GO:0004995 | tachykinin receptor activity(GO:0004995) |
| 0.0 | 0.1 | GO:1990932 | 5.8S rRNA binding(GO:1990932) |
| 0.0 | 0.1 | GO:0004994 | somatostatin receptor activity(GO:0004994) |
| 0.0 | 0.0 | GO:0032422 | purine-rich negative regulatory element binding(GO:0032422) |
| 0.0 | 0.0 | GO:0004792 | thiosulfate sulfurtransferase activity(GO:0004792) |
| 0.0 | 0.0 | GO:0032551 | UTP binding(GO:0002134) sulfonylurea receptor binding(GO:0017098) pyrimidine ribonucleoside binding(GO:0032551) |
Gene overrepresentation in curated gene sets: REACTOME pathways category:
| Log-likelihood per target | Total log-likelihood | Term | Description |
|---|---|---|---|
| 0.0 | 0.1 | REACTOME MEMBRANE BINDING AND TARGETTING OF GAG PROTEINS | Genes involved in Membrane binding and targetting of GAG proteins |