Project
GSE80451: E.coli grown aerobically and anaerobically
Navigation
Downloads
Results for NagC
Z-value: 0.85
Transcription factors associated with NagC
| Gene Symbol | Gene ID | Gene Info |
|---|---|---|
|
nagC
|
nagC | NagC DNA-binding transcriptional dual regulator |
Activity-expression correlation:
| Gene | Promoter | Pearson corr. coef. | P-value | Plot |
|---|---|---|---|---|
| nagC | 0.99 | 9.5e-04 | Click! |
Activity profile of NagC motif
Sorted Z-values of NagC motif
| Promoter | Log-likelihood | Transcript | Gene | Gene Info |
|---|---|---|---|---|
| nanCM | 2.38 |
nanC
nanM
|
N-acetylneuraminic acid outer membrane channel N-acetylneuraminate mutarotase |
|
| nanCMS | 1.97 |
nanC
nanM
nanS
|
N-acetylneuraminic acid outer membrane channel N-acetylneuraminate mutarotase probable 9-O-acetyl-N-acetylneuraminate esterase |
|
| nagE | 1.92 |
nagE
|
N-acetylglucosamine PTS permease |
|
| glmUS | 1.74 |
glmU
glmS
|
fused N-acetylglucosamine-1-phosphate uridyltransferase and glucosamine-1-phosphate acetyltransferase L-glutamine:D-fructose-6-phosphate aminotransferase |
|
| manXYZ | 1.51 |
manX
manY
manZ
|
mannose PTS permease - ManX subunit mannose PTS permease - ManY subunit mannose PTS permease - ManZ subunit |
|
| nagBAC-umpH | 1.40 |
nagB
nagC
umpH
nagA
|
glucosamine-6-phosphate deaminase NagC DNA-binding transcriptional dual regulator UMP phosphatase N-acetylglucosamine-6-phosphate deacetylase |
|
| ptsHI-crr | 1.13 |
ptsI
ptsH
crr
|
PTS enzyme I HPr Enzyme IIAGlc; Crr |
|
| ydeP | 0.43 |
ydeP
|
acid resistance protein |
|
| dinI | 0.28 |
dinI
|
DNA damage-inducible protein I |
|
| chbBCARFG | 0.21 |
chbG
chbF
chbC
chbB
chbA
chbR
|
chito-oligosaccharide mono-deacetylase monoacetylchitobiose-6-phosphate hydrolase chitobiose PTS permease - ChbC subunit chitobiose PTS permease - ChbB subunit chitobiose PTS permease - ChbA subunit ChbR DNA-binding transcriptional dual regulator |
Network of associatons between targets according to the STRING database.

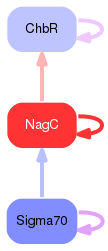
First level regulatory network of NagC
Gene Ontology Analysis
Gene overrepresentation in biological process category:
| Log-likelihood per target | Total log-likelihood | Term | Description |
|---|---|---|---|
| 1.0 | 3.1 | GO:0009225 | nucleotide-sugar metabolic process(GO:0009225) nucleotide-sugar biosynthetic process(GO:0009226) |
| 0.5 | 1.5 | GO:0015755 | fructose transport(GO:0015755) |
| 0.5 | 1.9 | GO:0009254 | peptidoglycan turnover(GO:0009254) |
| 0.4 | 1.1 | GO:0045912 | carbohydrate utilization(GO:0009758) regulation of glucose metabolic process(GO:0010906) regulation of cellular catabolic process(GO:0031329) regulation of cellular carbohydrate catabolic process(GO:0043471) negative regulation of carbohydrate metabolic process(GO:0045912) |
| 0.4 | 3.7 | GO:0015772 | oligosaccharide transport(GO:0015772) |
| 0.0 | 0.4 | GO:0010447 | response to acidic pH(GO:0010447) |
| 0.0 | 0.2 | GO:0009401 | phosphoenolpyruvate-dependent sugar phosphotransferase system(GO:0009401) |
| 0.0 | 0.3 | GO:0009432 | SOS response(GO:0009432) |
Gene overrepresentation in cellular component category:
| Log-likelihood per target | Total log-likelihood | Term | Description |
|---|---|---|---|
| 0.5 | 4.4 | GO:0045203 | integral component of cell outer membrane(GO:0045203) |
| 0.1 | 1.1 | GO:0031234 | extrinsic component of cytoplasmic side of plasma membrane(GO:0031234) |
| 0.0 | 3.6 | GO:0005887 | integral component of plasma membrane(GO:0005887) |
Gene overrepresentation in molecular function category:
| Log-likelihood per target | Total log-likelihood | Term | Description |
|---|---|---|---|
| 1.5 | 4.4 | GO:0015136 | sialic acid transmembrane transporter activity(GO:0015136) |
| 0.6 | 1.9 | GO:0019534 | toxin transporter activity(GO:0019534) |
| 0.5 | 1.4 | GO:0008253 | 5'-nucleotidase activity(GO:0008253) |
| 0.3 | 1.7 | GO:0070569 | uridylyltransferase activity(GO:0070569) |
| 0.2 | 1.1 | GO:0008047 | enzyme activator activity(GO:0008047) |
| 0.1 | 1.2 | GO:0015149 | hexose transmembrane transporter activity(GO:0015149) |
| 0.1 | 0.2 | GO:0008706 | 6-phospho-beta-glucosidase activity(GO:0008706) |
| 0.0 | 0.3 | GO:0019899 | enzyme binding(GO:0019899) |