Project
GSE67402: E.coli regulatory changes under long-term starvation
Navigation
Downloads
Results for TdcA
Z-value: 0.32
Transcription factors associated with TdcA
| Gene Symbol | Gene ID | Gene Info |
|---|---|---|
|
tdcA
|
tdcA | TdcA DNA-binding transcriptional activator |
Activity-expression correlation:
| Gene | Promoter | Pearson corr. coef. | P-value | Plot |
|---|---|---|---|---|
| tdcA | 0.40 | 3.6e-02 | Click! |
Activity profile of TdcA motif
Sorted Z-values of TdcA motif
| Promoter | Log-likelihood | Transcript | Gene | Gene Info |
|---|---|---|---|---|
| tdcABCDEFG | 5.55 |
tdcE
tdcD
tdcG
tdcF
tdcA
tdcC
tdcB
|
2-ketobutyrate formate-lyase/pyruvate formate-lyase 4, inactive propionate kinase L-serine deaminase III predicted enamine/imine deaminase TdcA DNA-binding transcriptional activator serine / threonine:H+ symporter TdcC catabolic threonine dehydratase |
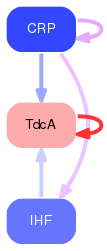
Network of associatons between targets according to the STRING database.

First level regulatory network of TdcA
Gene Ontology Analysis
Gene overrepresentation in biological process category:
| Log-likelihood per target | Total log-likelihood | Term | Description |
|---|---|---|---|
| 1.9 | 5.6 | GO:0006565 | L-serine catabolic process(GO:0006565) |
Gene overrepresentation in cellular component category:
| Log-likelihood per target | Total log-likelihood | Term | Description |
|---|---|---|---|
| 0.0 | 5.6 | GO:0005887 | integral component of plasma membrane(GO:0005887) |
Gene overrepresentation in molecular function category:
| Log-likelihood per target | Total log-likelihood | Term | Description |
|---|---|---|---|
| 1.4 | 5.6 | GO:0008861 | formate C-acetyltransferase activity(GO:0008861) |