Project
GSE67402: E.coli regulatory changes under long-term starvation
Navigation
Downloads
Results for QseB
Z-value: 0.42
Transcription factors associated with QseB
| Gene Symbol | Gene ID | Gene Info |
|---|---|---|
|
qseB
|
qseB | QseB transcriptional activator |
Activity-expression correlation:
| Gene | Promoter | Pearson corr. coef. | P-value | Plot |
|---|---|---|---|---|
| qseB | 0.95 | 3.5e-14 | Click! |
Activity profile of QseB motif
Sorted Z-values of QseB motif
| Promoter | Log-likelihood | Transcript | Gene | Gene Info |
|---|---|---|---|---|
| flhDC | 9.97 |
flhC
flhD
|
FlhC transcriptional dual regulator FlhD transcriptional dual regulator |
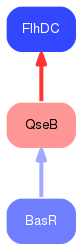
Network of associatons between targets according to the STRING database.

First level regulatory network of QseB
Gene Ontology Analysis
Gene overrepresentation in biological process category:
| Log-likelihood per target | Total log-likelihood | Term | Description |
|---|---|---|---|
| 0.0 | 8.6 | GO:0006351 | transcription, DNA-templated(GO:0006351) nucleic acid-templated transcription(GO:0097659) |