Project
GSE67402: E.coli regulatory changes under long-term starvation
Navigation
Downloads
Results for MarA
Z-value: 0.59
Transcription factors associated with MarA
| Gene Symbol | Gene ID | Gene Info |
|---|---|---|
|
marA
|
marA | MarA DNA-binding transcriptional dual regulator |
Activity-expression correlation:
Activity profile of MarA motif
Sorted Z-values of MarA motif
| Promoter | Log-likelihood | Transcript | Gene | Gene Info |
|---|---|---|---|---|
| decR | 5.81 |
decR
|
DecR DNA-binding transcriptional activator |
|
| tolC-ygiABC | 5.38 |
ygiC
ygiB
ygiA
tolC
|
predicted enzyme with ATPase activity conserved outer membrane protein predicted protein TolC outer membrane channel |
|
| fpr | 2.97 |
fpr
|
flavodoxin-NADP+ reductase/ferredoxin-NADP+ reductase |
|
| purA | 2.58 |
purA
|
adenylosuccinate synthetase |
|
| marRAB | 2.57 |
marB
marA
marR
|
multiple antibiotic resistance protein MarA DNA-binding transcriptional dual regulator MarR DNA-binding transcriptional repressor |
|
| slp-dctR | 1.91 |
slp
dctR
|
starvation lipoprotein predicted DNA-binding transcriptional regulator |
|
| putA | 1.34 |
putA
|
fused PutA transcriptional repressor / proline dehydrogenase / 1-pyrroline-5-carboxylate dehydrogenase |
|
| hdeAB-yhiD | 1.33 |
yhiD
hdeB
hdeA
|
inner membrane protein YhiD HdeB monomer HdeA monomer, chaperone active form |
|
| sodA | 1.13 |
sodA
|
superoxide dismutase (Mn) |
|
| ybjC-nfsA-rimK-ybjN | 0.70 |
nfsA
ybjN
ybjC
rimK
|
NADPH nitroreductase NfsA predicted oxidoreductase predicted inner membrane protein ribosomal protein S6 modification protein |
|
| acrAB | 0.67 |
acrB
acrA
|
AcrAB-TolC multidrug efflux pump - permease subunit AcrAB-TolC multidrug efflux pump - membrane fusion protein |
|
| zwf | 0.41 |
zwf
|
glucose-6-phosphate dehydrogenase (NADP+) |
|
| poxB | 0.38 |
poxB
|
pyruvate oxidase |
|
| nfsB | 0.23 |
nfsB
|
NAD(P)H nitroreductase NfsB |
|
| pqiAB | 0.17 |
pqiB
pqiA
|
paraquat-inducible protein B paraquat-inducible protein A |
Network of associatons between targets according to the STRING database.

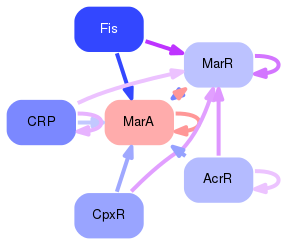
First level regulatory network of MarA
Gene Ontology Analysis
Gene overrepresentation in biological process category:
| Log-likelihood per target | Total log-likelihood | Term | Description |
|---|---|---|---|
| 1.4 | 4.1 | GO:0000303 | response to superoxide(GO:0000303) |
| 1.2 | 5.8 | GO:0044273 | response to amino acid(GO:0043200) sulfur compound catabolic process(GO:0044273) |
| 0.9 | 5.4 | GO:0015891 | siderophore transport(GO:0015891) |
| 0.6 | 2.6 | GO:0046040 | IMP metabolic process(GO:0046040) |
| 0.6 | 1.9 | GO:0031329 | regulation of cellular catabolic process(GO:0031329) regulation of cellular carbohydrate catabolic process(GO:0043471) |
| 0.3 | 2.6 | GO:0097237 | cellular response to antibiotic(GO:0071236) cellular response to toxic substance(GO:0097237) |
| 0.3 | 1.3 | GO:0009065 | glutamine family amino acid catabolic process(GO:0009065) |
| 0.3 | 1.3 | GO:0071468 | cellular response to pH(GO:0071467) cellular response to acidic pH(GO:0071468) |
| 0.2 | 0.7 | GO:0097305 | negative regulation of organelle organization(GO:0010639) negative regulation of cell projection organization(GO:0031345) post-translational protein modification(GO:0043687) response to alcohol(GO:0097305) regulation of single-species biofilm formation on inanimate substrate(GO:1900231) negative regulation of single-species biofilm formation on inanimate substrate(GO:1900232) negative regulation of organelle assembly(GO:1902116) negative regulation of bacterial-type flagellum assembly(GO:1902209) |
| 0.1 | 0.4 | GO:0009372 | quorum sensing(GO:0009372) |
| 0.1 | 0.2 | GO:0046256 | trinitrotoluene metabolic process(GO:0018973) 2,4,6-trinitrotoluene metabolic process(GO:0018974) nitrotoluene metabolic process(GO:0019326) 2,4,6-trinitrotoluene catabolic process(GO:0046256) trinitrotoluene catabolic process(GO:0046260) nitrotoluene catabolic process(GO:0046263) toluene-containing compound metabolic process(GO:0072490) toluene-containing compound catabolic process(GO:0072491) |
| 0.1 | 0.7 | GO:0006855 | drug transmembrane transport(GO:0006855) |
| 0.0 | 0.4 | GO:0051262 | pyruvate metabolic process(GO:0006090) protein tetramerization(GO:0051262) protein homotetramerization(GO:0051289) |
Gene overrepresentation in cellular component category:
| Log-likelihood per target | Total log-likelihood | Term | Description |
|---|---|---|---|
| 0.1 | 6.1 | GO:1902495 | transmembrane transporter complex(GO:1902495) transporter complex(GO:1990351) |
| 0.1 | 1.3 | GO:0009898 | cytoplasmic side of plasma membrane(GO:0009898) cytoplasmic side of membrane(GO:0098562) |
| 0.1 | 4.0 | GO:0030288 | outer membrane-bounded periplasmic space(GO:0030288) |
| 0.0 | 12.4 | GO:0005829 | cytosol(GO:0005829) |
| 0.0 | 0.4 | GO:0019867 | outer membrane(GO:0019867) |
Gene overrepresentation in molecular function category:
| Log-likelihood per target | Total log-likelihood | Term | Description |
|---|---|---|---|
| 0.9 | 5.4 | GO:0015562 | efflux transmembrane transporter activity(GO:0015562) |
| 0.6 | 2.6 | GO:0001067 | regulatory region DNA binding(GO:0000975) regulatory region nucleic acid binding(GO:0001067) transcription regulatory region DNA binding(GO:0044212) |
| 0.4 | 1.3 | GO:0051087 | chaperone binding(GO:0051087) |
| 0.4 | 1.1 | GO:0016721 | superoxide dismutase activity(GO:0004784) oxidoreductase activity, acting on superoxide radicals as acceptor(GO:0016721) |
| 0.3 | 1.3 | GO:0001217 | transcriptional repressor activity, bacterial-type RNA polymerase core promoter proximal region sequence-specific binding(GO:0001141) bacterial-type RNA polymerase transcriptional repressor activity, sequence-specific DNA binding(GO:0001217) |
| 0.2 | 3.0 | GO:0071949 | FAD binding(GO:0071949) |
| 0.2 | 0.7 | GO:0034567 | chromate reductase activity(GO:0034567) |
| 0.2 | 0.7 | GO:0015307 | drug:proton antiporter activity(GO:0015307) |
| 0.1 | 2.6 | GO:0016879 | ligase activity, forming carbon-nitrogen bonds(GO:0016879) |
| 0.1 | 5.6 | GO:0043565 | sequence-specific DNA binding(GO:0043565) |
| 0.1 | 0.4 | GO:0030976 | thiamine pyrophosphate binding(GO:0030976) |
| 0.0 | 0.2 | GO:0016646 | oxidoreductase activity, acting on the CH-NH group of donors, NAD or NADP as acceptor(GO:0016646) |
| 0.0 | 2.3 | GO:0042802 | identical protein binding(GO:0042802) |