Project
GSE67402: E.coli regulatory changes under long-term starvation
Navigation
Downloads
Results for LldR
Z-value: 0.32
Transcription factors associated with LldR
| Gene Symbol | Gene ID | Gene Info |
|---|---|---|
|
lldR
|
lldR | LldR transcriptional dual regulator |
Activity-expression correlation:
| Gene | Promoter | Pearson corr. coef. | P-value | Plot |
|---|---|---|---|---|
| lldR | 0.68 | 9.1e-05 | Click! |
Activity profile of LldR motif
Sorted Z-values of LldR motif
| Promoter | Log-likelihood | Transcript | Gene | Gene Info |
|---|---|---|---|---|
| lldPRD | 4.59 |
lldP
lldR
lldD
|
(R)-lactate / (S)-lactate / glycolate:H+ symporter LldP LldR transcriptional dual regulator L-lactate dehydrogenase |
Network of associatons between targets according to the STRING database.

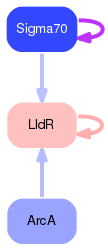
First level regulatory network of LldR
Gene Ontology Analysis
Gene overrepresentation in biological process category:
| Log-likelihood per target | Total log-likelihood | Term | Description |
|---|---|---|---|
| 1.1 | 4.6 | GO:0006004 | fucose metabolic process(GO:0006004) response to nutrient(GO:0007584) fucose catabolic process(GO:0019317) L-fucose metabolic process(GO:0042354) L-fucose catabolic process(GO:0042355) |
Gene overrepresentation in cellular component category:
| Log-likelihood per target | Total log-likelihood | Term | Description |
|---|---|---|---|
| 0.0 | 4.6 | GO:0005887 | integral component of plasma membrane(GO:0005887) |
Gene overrepresentation in molecular function category:
| Log-likelihood per target | Total log-likelihood | Term | Description |
|---|---|---|---|
| 1.1 | 4.6 | GO:0043879 | glycolate transmembrane transporter activity(GO:0043879) |