Project
GSE67402: E.coli regulatory changes under long-term starvation
Navigation
Downloads
Results for IdnR
Z-value: 0.83
Transcription factors associated with IdnR
| Gene Symbol | Gene ID | Gene Info |
|---|---|---|
|
idnR
|
idnR | IdnR transcriptional regulator |
Activity-expression correlation:
| Gene | Promoter | Pearson corr. coef. | P-value | Plot |
|---|---|---|---|---|
| idnR | -0.88 | 1.0e-09 | Click! |
Activity profile of IdnR motif
Sorted Z-values of IdnR motif
Network of associatons between targets according to the STRING database.

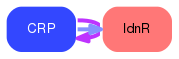
First level regulatory network of IdnR
Gene Ontology Analysis
Gene overrepresentation in biological process category:
| Log-likelihood per target | Total log-likelihood | Term | Description |
|---|---|---|---|
| 6.8 | 34.1 | GO:0019521 | D-gluconate metabolic process(GO:0019521) D-gluconate catabolic process(GO:0046177) |
Gene overrepresentation in cellular component category:
| Log-likelihood per target | Total log-likelihood | Term | Description |
|---|---|---|---|
| 0.0 | 8.2 | GO:0005887 | integral component of plasma membrane(GO:0005887) |
Gene overrepresentation in molecular function category:
| Log-likelihood per target | Total log-likelihood | Term | Description |
|---|---|---|---|
| 11.4 | 34.1 | GO:0046316 | gluconokinase activity(GO:0046316) |