Project
GSE67402: E.coli regulatory changes under long-term starvation
Navigation
Downloads
Results for GadX
Z-value: 0.72
Transcription factors associated with GadX
| Gene Symbol | Gene ID | Gene Info |
|---|---|---|
|
gadX
|
gadX | GadX DNA-binding transcriptional dual regulator |
Activity-expression correlation:
Activity profile of GadX motif
Sorted Z-values of GadX motif
| Promoter | Log-likelihood | Transcript | Gene | Gene Info |
|---|---|---|---|---|
| gadE | 6.40 |
gadE
|
GadE DNA-binding transcriptional activator |
|
| hdeD | 5.31 |
hdeD
|
acid-resistance membrane protein |
|
| gadY | 3.60 |
gadY
|
GadY |
|
| ybaST | 3.37 |
ybaS
ybaT
|
glutaminase putative transport protein, archaeal/bacterial transporter (ABT) family |
|
| lon | 2.80 |
lon
|
DNA-binding, ATP-dependent protease La |
|
| uspE | 2.79 |
uspE
|
universal stress protein with a role cellular motility |
|
| glnK-amtB | 2.58 |
glnK
amtB
|
nitrogen regulatory protein GlnK ammonia / ammonium transporter |
|
| gadBC | 2.15 |
gadB
gadC
|
glutamate decarboxylase B subunit glutamic acid:4-aminobutyrate antiporter |
|
| gadW | 1.78 |
gadW
|
GadW DNA-binding transcriptional dual regulator |
|
| cadBA | 1.73 |
cadA
cadB
|
lysine decarboxylase 1 lysine:cadaverine antiporter |
|
| gadX | 1.51 |
gadX
|
GadX DNA-binding transcriptional dual regulator |
|
| slp-dctR | 1.46 |
slp
dctR
|
starvation lipoprotein predicted DNA-binding transcriptional regulator |
|
| gadXW | 1.05 |
gadW
gadX
|
GadW DNA-binding transcriptional dual regulator GadX DNA-binding transcriptional dual regulator |
|
| hdeAB-yhiD | 0.40 |
yhiD
hdeB
hdeA
|
inner membrane protein YhiD HdeB monomer HdeA monomer, chaperone active form |
|
| gadE-mdtEF | 0.39 |
mdtF
mdtE
gadE
|
MdtEF-TolC multidrug efflux pump - permease subunit MdtEF-TolC multidrug efflux pump - membrane fusion protein GadE DNA-binding transcriptional activator |
|
| rpoS | 0.37 |
rpoS
|
RNA polymerase, sigma S (sigma 38) factor |
Network of associatons between targets according to the STRING database.

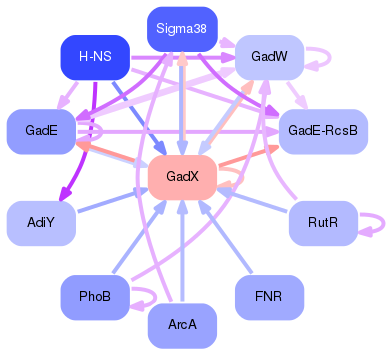
First level regulatory network of GadX
Gene Ontology Analysis
Gene overrepresentation in biological process category:
| Log-likelihood per target | Total log-likelihood | Term | Description |
|---|---|---|---|
| 0.9 | 2.6 | GO:0006808 | regulation of nitrogen utilization(GO:0006808) |
| 0.7 | 2.2 | GO:0055067 | regulation of pH(GO:0006885) cellular monovalent inorganic cation homeostasis(GO:0030004) regulation of cellular pH(GO:0030641) pH elevation(GO:0045852) regulation of intracellular pH(GO:0051453) intracellular pH elevation(GO:0051454) monovalent inorganic cation homeostasis(GO:0055067) |
| 0.7 | 10.8 | GO:0009268 | response to pH(GO:0009268) |
| 0.6 | 2.8 | GO:0006515 | misfolded or incompletely synthesized protein catabolic process(GO:0006515) |
| 0.6 | 2.8 | GO:0071214 | cellular response to hydrogen peroxide(GO:0070301) cellular response to abiotic stimulus(GO:0071214) |
| 0.5 | 1.5 | GO:0043471 | regulation of cellular catabolic process(GO:0031329) regulation of cellular carbohydrate catabolic process(GO:0043471) |
| 0.1 | 0.4 | GO:0001121 | transcription from bacterial-type RNA polymerase promoter(GO:0001121) |
| 0.0 | 0.4 | GO:0006855 | drug transmembrane transport(GO:0006855) |
| 0.0 | 7.0 | GO:2001141 | regulation of transcription, DNA-templated(GO:0006355) regulation of nucleic acid-templated transcription(GO:1903506) regulation of RNA biosynthetic process(GO:2001141) |
Gene overrepresentation in cellular component category:
| Log-likelihood per target | Total log-likelihood | Term | Description |
|---|---|---|---|
| 0.0 | 15.9 | GO:0005886 | plasma membrane(GO:0005886) |
| 0.0 | 1.5 | GO:0019867 | outer membrane(GO:0019867) |
Gene overrepresentation in molecular function category:
| Log-likelihood per target | Total log-likelihood | Term | Description |
|---|---|---|---|
| 0.6 | 2.8 | GO:0004176 | ATP-dependent peptidase activity(GO:0004176) |
| 0.5 | 4.3 | GO:0008519 | ammonium transmembrane transporter activity(GO:0008519) |
| 0.1 | 2.2 | GO:0015297 | antiporter activity(GO:0015297) |
| 0.1 | 0.4 | GO:0051087 | chaperone binding(GO:0051087) |
| 0.1 | 0.4 | GO:0001000 | bacterial-type RNA polymerase core enzyme binding(GO:0001000) |
| 0.0 | 0.4 | GO:0015238 | drug transmembrane transporter activity(GO:0015238) |
| 0.0 | 4.7 | GO:0003677 | DNA binding(GO:0003677) |