Project
GSE67402: E.coli regulatory changes under long-term starvation
Navigation
Downloads
Results for GadE
Z-value: 1.42
Transcription factors associated with GadE
| Gene Symbol | Gene ID | Gene Info |
|---|---|---|
|
gadE
|
gadE | DNA-binding transcriptional activator GadE |
Activity-expression correlation:
| Gene | Promoter | Pearson corr. coef. | P-value | Plot |
|---|---|---|---|---|
| gadE | 0.61 | 7.8e-04 | Click! |
Activity profile of GadE motif
Sorted Z-values of GadE motif
| Promoter | Log-likelihood | Transcript | Gene | Gene Info |
|---|---|---|---|---|
| lrp | 45.59 |
lrp
|
Lrp transcriptional dual regulator |
|
| skp-lpxD-fabZ-lpxA | 25.61 |
lpxA
lpxD
skp
fabZ
|
UDP-N-acetylglucosamine acyltransferase UDP-3-O-(R-3-hydroxymyristoyl)-glucosamine N-acyltransferase periplasmic chaperone 3-hydroxy-acyl-[acyl-carrier-protein] dehydratase |
|
| gltBDF | 25.14 |
gltB
gltD
gltF
|
glutamate synthase, large subunit glutamate synthase, small subunit periplasmic protein |
|
| purA | 14.32 |
purA
|
adenylosuccinate synthetase |
|
| gnd | 13.09 |
gnd
|
6-phosphogluconate dehydrogenase, decarboxylating |
|
| cyoABCDE | 10.98 |
cyoA
cyoC
cyoB
cyoE
cyoD
|
cytochrome bo terminal oxidase subunit II cytochrome bo terminal oxidase subunit III cytochrome bo terminal oxidase subunit I heme O synthase cytochrome bo terminal oxidase subunit IV |
|
| gadE-mdtEF | 4.64 |
mdtF
mdtE
gadE
|
MdtEF-TolC multidrug efflux pump - permease subunit MdtEF-TolC multidrug efflux pump - membrane fusion protein GadE DNA-binding transcriptional activator |
|
| hdeAB-yhiD | 2.09 |
yhiD
hdeB
hdeA
|
inner membrane protein YhiD HdeB monomer HdeA monomer, chaperone active form |
|
| gadXW | 0.12 |
gadW
gadX
|
GadW DNA-binding transcriptional dual regulator GadX DNA-binding transcriptional dual regulator |
Network of associatons between targets according to the STRING database.

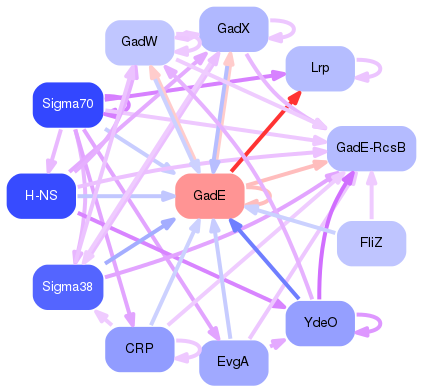
First level regulatory network of GadE
Gene Ontology Analysis
Gene overrepresentation in biological process category:
| Log-likelihood per target | Total log-likelihood | Term | Description |
|---|---|---|---|
| 9.1 | 45.6 | GO:0009078 | alanine metabolic process(GO:0006522) leucine metabolic process(GO:0006551) pyruvate family amino acid metabolic process(GO:0009078) leucine biosynthetic process(GO:0009098) response to amino acid(GO:0043200) |
| 8.5 | 25.6 | GO:0032978 | protein insertion into membrane from inner side(GO:0032978) |
| 8.4 | 25.1 | GO:0019676 | ammonia assimilation cycle(GO:0019676) |
| 3.6 | 14.3 | GO:0046040 | IMP metabolic process(GO:0046040) |
| 2.7 | 11.0 | GO:1902600 | aerobic electron transport chain(GO:0019646) hydrogen ion transmembrane transport(GO:1902600) |
| 2.6 | 13.1 | GO:0019521 | D-gluconate metabolic process(GO:0019521) D-gluconate catabolic process(GO:0046177) |
| 0.5 | 4.6 | GO:0006855 | drug transmembrane transport(GO:0006855) |
| 0.4 | 2.1 | GO:0071468 | cellular response to acidic pH(GO:0071468) |
Gene overrepresentation in cellular component category:
| Log-likelihood per target | Total log-likelihood | Term | Description |
|---|---|---|---|
| 3.7 | 11.0 | GO:0070069 | cytochrome complex(GO:0070069) |
| 0.5 | 52.8 | GO:0030288 | outer membrane-bounded periplasmic space(GO:0030288) |
| 0.1 | 66.4 | GO:0005829 | cytosol(GO:0005829) |
| 0.0 | 4.6 | GO:0031226 | intrinsic component of plasma membrane(GO:0031226) |
Gene overrepresentation in molecular function category:
| Log-likelihood per target | Total log-likelihood | Term | Description |
|---|---|---|---|
| 8.5 | 25.6 | GO:0047451 | 3-hydroxydecanoyl-[acyl-carrier-protein] dehydratase activity(GO:0008693) 3-hydroxyacyl-[acyl-carrier-protein] dehydratase activity(GO:0019171) 3-hydroxyoctanoyl-[acyl-carrier-protein] dehydratase activity(GO:0047451) |
| 4.2 | 25.1 | GO:0016638 | oxidoreductase activity, acting on the CH-NH2 group of donors(GO:0016638) |
| 2.7 | 11.0 | GO:0048038 | prenyltransferase activity(GO:0004659) quinone binding(GO:0048038) ubiquinone binding(GO:0048039) |
| 0.7 | 2.1 | GO:0051087 | chaperone binding(GO:0051087) |
| 0.7 | 44.8 | GO:0043565 | sequence-specific DNA binding(GO:0043565) |
| 0.5 | 14.3 | GO:0016879 | ligase activity, forming carbon-nitrogen bonds(GO:0016879) |
| 0.4 | 4.6 | GO:0015238 | drug transmembrane transporter activity(GO:0015238) |
| 0.3 | 13.1 | GO:0016616 | oxidoreductase activity, acting on the CH-OH group of donors, NAD or NADP as acceptor(GO:0016616) |