Project
GSE67402: E.coli regulatory changes under long-term starvation
Navigation
Downloads
Results for FliZ
Z-value: 0.35
Transcription factors associated with FliZ
| Gene Symbol | Gene ID | Gene Info |
|---|---|---|
|
fliZ
|
fliZ | FliZ DNA-binding transcriptional regulator |
Activity profile of FliZ motif
Sorted Z-values of FliZ motif
| Promoter | Log-likelihood | Transcript | Gene | Gene Info |
|---|---|---|---|---|
| csgDEFG | 2.69 |
csgG
csgF
csgE
csgD
|
curli secretion channel curli assembly component curli transport specificity factor CsgD DNA-binding transcriptional dual regulator |
|
| csgBAC | 1.61 |
csgC
csgB
csgA
|
inhibitor of CsgA amyloid formation curlin, minor subunit curlin, major subunit |
|
| pdeR | 0.80 |
pdeR
|
cyclic di-GMP phosphodiesterase |
|
| gadBC | 0.67 |
gadB
gadC
|
glutamate decarboxylase B subunit glutamic acid:4-aminobutyrate antiporter |
|
| flhDC | 0.60 |
flhC
flhD
|
FlhC transcriptional dual regulator FlhD transcriptional dual regulator |
|
| hdeAB-yhiD | 0.54 |
yhiD
hdeB
hdeA
|
inner membrane protein YhiD HdeB monomer HdeA monomer, chaperone active form |
|
| gadE-mdtEF | 0.29 |
mdtF
mdtE
gadE
|
MdtEF-TolC multidrug efflux pump - permease subunit MdtEF-TolC multidrug efflux pump - membrane fusion protein GadE DNA-binding transcriptional activator |
Network of associatons between targets according to the STRING database.

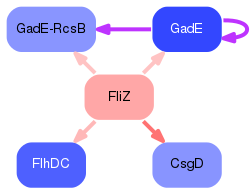
First level regulatory network of FliZ
Gene Ontology Analysis
Gene overrepresentation in biological process category:
| Log-likelihood per target | Total log-likelihood | Term | Description |
|---|---|---|---|
| 0.5 | 4.3 | GO:0022610 | biological adhesion(GO:0022610) |
| 0.2 | 0.7 | GO:0045852 | pH elevation(GO:0045852) intracellular pH elevation(GO:0051454) |
| 0.1 | 0.5 | GO:0071468 | cellular response to acidic pH(GO:0071468) |
| 0.1 | 0.8 | GO:0043086 | negative regulation of catalytic activity(GO:0043086) |
| 0.0 | 0.3 | GO:0006855 | drug transmembrane transport(GO:0006855) |
Gene overrepresentation in cellular component category:
| Log-likelihood per target | Total log-likelihood | Term | Description |
|---|---|---|---|
| 0.3 | 2.7 | GO:0031246 | intrinsic component of periplasmic side of cell outer membrane(GO:0031246) |
| 0.2 | 1.6 | GO:0042995 | cell projection(GO:0042995) |
Gene overrepresentation in molecular function category:
| Log-likelihood per target | Total log-likelihood | Term | Description |
|---|---|---|---|
| 0.2 | 0.5 | GO:0051087 | chaperone binding(GO:0051087) |
| 0.2 | 0.8 | GO:0071111 | cyclic-guanylate-specific phosphodiesterase activity(GO:0071111) |
| 0.1 | 2.7 | GO:0001159 | bacterial-type RNA polymerase core promoter proximal region sequence-specific DNA binding(GO:0000986) core promoter proximal region sequence-specific DNA binding(GO:0000987) core promoter proximal region DNA binding(GO:0001159) |
| 0.0 | 0.7 | GO:0015297 | antiporter activity(GO:0015297) |
| 0.0 | 0.3 | GO:0015238 | drug transmembrane transporter activity(GO:0015238) |