Project
GSE67402: E.coli regulatory changes under long-term starvation
Navigation
Downloads
Results for FeaR
Z-value: 0.73
Transcription factors associated with FeaR
| Gene Symbol | Gene ID | Gene Info |
|---|---|---|
|
feaR
|
feaR | FeaR DNA-binding transcriptional activator |
Activity-expression correlation:
| Gene | Promoter | Pearson corr. coef. | P-value | Plot |
|---|---|---|---|---|
| feaR | -0.86 | 1.3e-08 | Click! |
Activity profile of FeaR motif
Sorted Z-values of FeaR motif
Network of associatons between targets according to the STRING database.

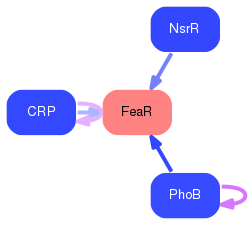
First level regulatory network of FeaR
Gene Ontology Analysis
Gene overrepresentation in biological process category:
| Log-likelihood per target | Total log-likelihood | Term | Description |
|---|---|---|---|
| 3.0 | 11.8 | GO:0042178 | phenol-containing compound metabolic process(GO:0018958) xenobiotic catabolic process(GO:0042178) |
| 1.8 | 14.2 | GO:0009310 | amine catabolic process(GO:0009310) cellular biogenic amine catabolic process(GO:0042402) |
Gene overrepresentation in cellular component category:
| Log-likelihood per target | Total log-likelihood | Term | Description |
|---|---|---|---|
| 0.1 | 14.2 | GO:0042597 | periplasmic space(GO:0042597) |
Gene overrepresentation in molecular function category:
| Log-likelihood per target | Total log-likelihood | Term | Description |
|---|---|---|---|
| 2.8 | 14.2 | GO:0048038 | quinone binding(GO:0048038) |
| 2.0 | 11.8 | GO:0004029 | aldehyde dehydrogenase (NAD) activity(GO:0004029) |