Project
GSE67402: E.coli regulatory changes under long-term starvation
Navigation
Downloads
Results for FadR
Z-value: 1.34
Transcription factors associated with FadR
| Gene Symbol | Gene ID | Gene Info |
|---|---|---|
|
fadR
|
fadR | FadR DNA-binding transcriptional dual regulator |
Activity-expression correlation:
| Gene | Promoter | Pearson corr. coef. | P-value | Plot |
|---|---|---|---|---|
| fadR | 0.74 | 8.6e-06 | Click! |
Activity profile of FadR motif
Sorted Z-values of FadR motif
| Promoter | Log-likelihood | Transcript | Gene | Gene Info |
|---|---|---|---|---|
| fabI | 16.12 |
fabI
|
enoyl-[acyl-carrier-protein] reductase subunit |
|
| accBC | 13.85 |
accC
accB
|
biotin carboxylase biotin carboxyl carrier protein |
|
| fabHDG | 13.16 |
fabD
fabG
fabH
|
malonyl-CoA-ACP transacylase 3-oxoacyl-[acyl-carrier-protein] reductase subunit β-ketoacyl-ACP synthase III |
|
| accA | 11.51 |
accA
|
acetyl-CoA carboxyltransferase, α subunit |
|
| fabB | 5.92 |
fabB
|
β-ketoacyl-ACP synthase I |
|
| fadBA | 5.47 |
fadB
fadA
|
dodecenoyl-CoA δ-isomerase, enoyl-CoA hydratase, 3-hydroxybutyryl-CoA epimerase, 3-hydroxyacyl-CoA dehydrogenase 3-ketoacyl-CoA thiolase |
|
| uspA | 5.43 |
uspA
|
universal stress global stress response regulator |
|
| fadIJ | 5.15 |
fadJ
fadI
|
FadJ component of anaerobic fatty acid oxidation complex FadI component of anaerobic fatty acid oxidation complex |
|
| accD | 5.02 |
accD
|
acetyl-CoA carboxyltransferase, β subunit |
|
| fabA | 4.33 |
fabA
|
β-hydroxyacyl-ACP dehydratase/isomerase |
|
| fadR | 3.55 |
fadR
|
FadR DNA-binding transcriptional dual regulator |
|
| iclR | 3.10 |
iclR
|
IclR transcriptional repressor |
|
| fadH | 2.00 |
fadH
|
2,4-dienoyl-CoA reductase |
|
| fadL | 1.75 |
fadL
|
long-chain fatty acid outer membrane porin; bacteriophage T2 receptor |
Network of associatons between targets according to the STRING database.

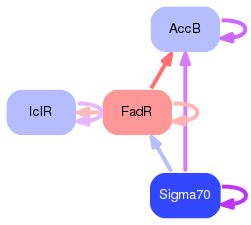
First level regulatory network of FadR
Gene Ontology Analysis
Gene overrepresentation in biological process category:
| Log-likelihood per target | Total log-likelihood | Term | Description |
|---|---|---|---|
| 9.8 | 29.3 | GO:0030497 | fatty acid elongation(GO:0030497) |
| 5.8 | 17.4 | GO:0046890 | regulation of lipid metabolic process(GO:0019216) regulation of fatty acid metabolic process(GO:0019217) regulation of fatty acid biosynthetic process(GO:0042304) regulation of lipid biosynthetic process(GO:0046890) |
| 2.4 | 26.8 | GO:0006633 | fatty acid biosynthetic process(GO:0006633) |
| 0.2 | 1.7 | GO:0006869 | lipid transport(GO:0006869) |
| 0.0 | 3.1 | GO:0045892 | negative regulation of transcription, DNA-templated(GO:0045892) negative regulation of RNA biosynthetic process(GO:1902679) negative regulation of nucleic acid-templated transcription(GO:1903507) |
Gene overrepresentation in cellular component category:
| Log-likelihood per target | Total log-likelihood | Term | Description |
|---|---|---|---|
| 1.0 | 16.5 | GO:1990234 | transferase complex(GO:1990234) |
| 0.1 | 55.1 | GO:0005829 | cytosol(GO:0005829) |
| 0.0 | 1.7 | GO:0009279 | cell outer membrane(GO:0009279) |
Gene overrepresentation in molecular function category:
| Log-likelihood per target | Total log-likelihood | Term | Description |
|---|---|---|---|
| 7.0 | 35.2 | GO:0004312 | fatty acid synthase activity(GO:0004312) |
| 3.5 | 10.6 | GO:0003857 | 3-hydroxyacyl-CoA dehydrogenase activity(GO:0003857) |
| 1.4 | 4.3 | GO:0019171 | 3-hydroxydecanoyl-[acyl-carrier-protein] dehydratase activity(GO:0008693) 3-hydroxyacyl-[acyl-carrier-protein] dehydratase activity(GO:0019171) 3-hydroxyoctanoyl-[acyl-carrier-protein] dehydratase activity(GO:0047451) |
| 0.6 | 1.7 | GO:0022836 | gated channel activity(GO:0022836) transmembrane receptor activity(GO:0099600) |
| 0.5 | 13.8 | GO:0016879 | ligase activity, forming carbon-nitrogen bonds(GO:0016879) |
| 0.3 | 5.0 | GO:0003729 | mRNA binding(GO:0003729) poly(A) RNA binding(GO:0044822) |
| 0.3 | 2.0 | GO:0016628 | oxidoreductase activity, acting on the CH-CH group of donors, NAD or NADP as acceptor(GO:0016628) |
| 0.1 | 6.7 | GO:0003700 | transcription factor activity, sequence-specific DNA binding(GO:0003700) |
| 0.1 | 16.9 | GO:0042802 | identical protein binding(GO:0042802) |