Project
GSE67402: E.coli regulatory changes under long-term starvation
Navigation
Downloads
Results for CspA
Z-value: 0.86
Transcription factors associated with CspA
| Gene Symbol | Gene ID | Gene Info |
|---|---|---|
|
cspA
|
cspA | CspA DNA-binding transcriptional activator |
Activity-expression correlation:
| Gene | Promoter | Pearson corr. coef. | P-value | Plot |
|---|---|---|---|---|
| cspA | 0.84 | 3.1e-08 | Click! |
Activity profile of CspA motif
Sorted Z-values of CspA motif
Network of associatons between targets according to the STRING database.

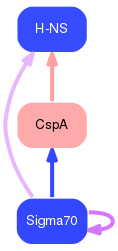
First level regulatory network of CspA
Gene Ontology Analysis
Gene overrepresentation in biological process category:
| Log-likelihood per target | Total log-likelihood | Term | Description |
|---|---|---|---|
| 7.8 | 23.5 | GO:0006265 | DNA topological change(GO:0006265) |
Gene overrepresentation in cellular component category:
| Log-likelihood per target | Total log-likelihood | Term | Description |
|---|---|---|---|
| 0.1 | 35.6 | GO:0016020 | membrane(GO:0016020) |
Gene overrepresentation in molecular function category:
| Log-likelihood per target | Total log-likelihood | Term | Description |
|---|---|---|---|
| 7.8 | 23.5 | GO:0003916 | DNA topoisomerase activity(GO:0003916) |
| 1.7 | 12.1 | GO:0003681 | bent DNA binding(GO:0003681) |