Project
GSE67402: E.coli regulatory changes under long-term starvation
Navigation
Downloads
Results for CadC
Z-value: 0.65
Transcription factors associated with CadC
| Gene Symbol | Gene ID | Gene Info |
|---|---|---|
|
cadC
|
cadC | CadC DNA-binding transcriptional activator |
Activity-expression correlation:
| Gene | Promoter | Pearson corr. coef. | P-value | Plot |
|---|---|---|---|---|
| cadC | -0.11 | 5.7e-01 | Click! |
Activity profile of CadC motif
Sorted Z-values of CadC motif
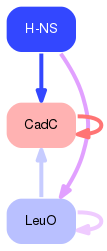
Network of associatons between targets according to the STRING database.

First level regulatory network of CadC
Gene Ontology Analysis
Gene overrepresentation in biological process category:
| Log-likelihood per target | Total log-likelihood | Term | Description |
|---|---|---|---|
| 1.5 | 6.0 | GO:1903401 | organic cation transport(GO:0015695) L-lysine transmembrane transport(GO:1903401) |
| 0.2 | 14.2 | GO:1903508 | positive regulation of transcription, DNA-templated(GO:0045893) positive regulation of RNA metabolic process(GO:0051254) positive regulation of RNA biosynthetic process(GO:1902680) positive regulation of nucleic acid-templated transcription(GO:1903508) |
Gene overrepresentation in cellular component category:
| Log-likelihood per target | Total log-likelihood | Term | Description |
|---|---|---|---|
| 0.1 | 20.2 | GO:0005886 | plasma membrane(GO:0005886) |
Gene overrepresentation in molecular function category:
| Log-likelihood per target | Total log-likelihood | Term | Description |
|---|---|---|---|
| 1.5 | 6.0 | GO:0015491 | L-lysine transmembrane transporter activity(GO:0015189) cation:cation antiporter activity(GO:0015491) |
| 0.0 | 14.2 | GO:0005515 | protein binding(GO:0005515) |