Project
GSE67402: E.coli regulatory changes under long-term starvation
Navigation
Downloads
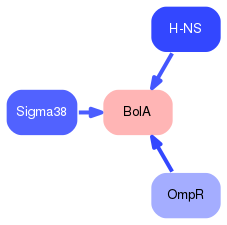
Results for BolA
Z-value: 0.57
Transcription factors associated with BolA
| Gene Symbol | Gene ID | Gene Info |
|---|---|---|
|
bolA
|
bolA | BolA DNA-binding transcriptional dual regulator |
Activity-expression correlation:
| Gene | Promoter | Pearson corr. coef. | P-value | Plot |
|---|---|---|---|---|
| bolA | 0.28 | 1.6e-01 | Click! |
Activity profile of BolA motif
Sorted Z-values of BolA motif
Network of associatons between targets according to the STRING database.

First level regulatory network of BolA
Gene Ontology Analysis
Gene overrepresentation in biological process category:
| Log-likelihood per target | Total log-likelihood | Term | Description |
|---|---|---|---|
| 1.0 | 5.1 | GO:0022604 | cell morphogenesis(GO:0000902) regulation of cell shape(GO:0008360) anatomical structure morphogenesis(GO:0009653) regulation of anatomical structure morphogenesis(GO:0022603) regulation of cell morphogenesis(GO:0022604) cellular component morphogenesis(GO:0032989) single-organism developmental process(GO:0044767) anatomical structure development(GO:0048856) cellular developmental process(GO:0048869) regulation of developmental process(GO:0050793) |
Gene overrepresentation in cellular component category:
| Log-likelihood per target | Total log-likelihood | Term | Description |
|---|---|---|---|
| 0.0 | 5.1 | GO:0005887 | integral component of plasma membrane(GO:0005887) |
Gene overrepresentation in molecular function category:
| Log-likelihood per target | Total log-likelihood | Term | Description |
|---|---|---|---|
| 2.7 | 10.6 | GO:0016812 | hydrolase activity, acting on carbon-nitrogen (but not peptide) bonds, in cyclic amides(GO:0016812) |
| 1.7 | 5.1 | GO:0008658 | penicillin binding(GO:0008658) |