Project
GSE67402: E.coli regulatory changes under long-term starvation
Navigation
Downloads
Results for BetI
Z-value: 0.37
Transcription factors associated with BetI
| Gene Symbol | Gene ID | Gene Info |
|---|---|---|
|
betI
|
betI | BetI DNA-binding transcriptional repressor |
Activity-expression correlation:
| Gene | Promoter | Pearson corr. coef. | P-value | Plot |
|---|---|---|---|---|
| betI | -0.11 | 5.7e-01 | Click! |
Activity profile of BetI motif
Sorted Z-values of BetI motif
Network of associatons between targets according to the STRING database.

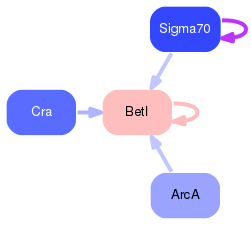
First level regulatory network of BetI
Gene Ontology Analysis
Gene overrepresentation in biological process category:
| Log-likelihood per target | Total log-likelihood | Term | Description |
|---|---|---|---|
| 0.6 | 2.4 | GO:0006577 | amino-acid betaine metabolic process(GO:0006577) |
| 0.5 | 3.7 | GO:0015696 | ammonium transport(GO:0015696) |
Gene overrepresentation in cellular component category:
| Log-likelihood per target | Total log-likelihood | Term | Description |
|---|---|---|---|
| 0.0 | 3.7 | GO:0005887 | integral component of plasma membrane(GO:0005887) |
Gene overrepresentation in molecular function category:
| Log-likelihood per target | Total log-likelihood | Term | Description |
|---|---|---|---|
| 0.5 | 3.7 | GO:0015665 | ammonium transmembrane transporter activity(GO:0008519) alcohol transmembrane transporter activity(GO:0015665) |
| 0.4 | 2.4 | GO:0004029 | aldehyde dehydrogenase (NAD) activity(GO:0004029) |