Project
PRJNA438478: RNAseq of wild type zebrafish germline
Navigation
Downloads
Results for tfap2d
Z-value: 0.21
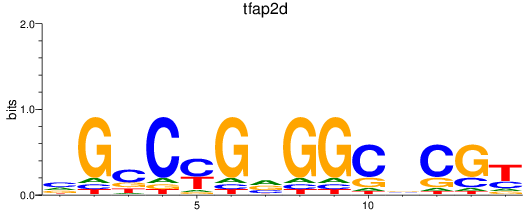
Motif logo
Transcription factors associated with tfap2d
| Gene Symbol | Gene ID | Gene Info |
|---|---|---|
|
tfap2d
|
ENSDARG00000023272 | transcription factor AP-2 delta (activating enhancer binding protein 2 delta) |
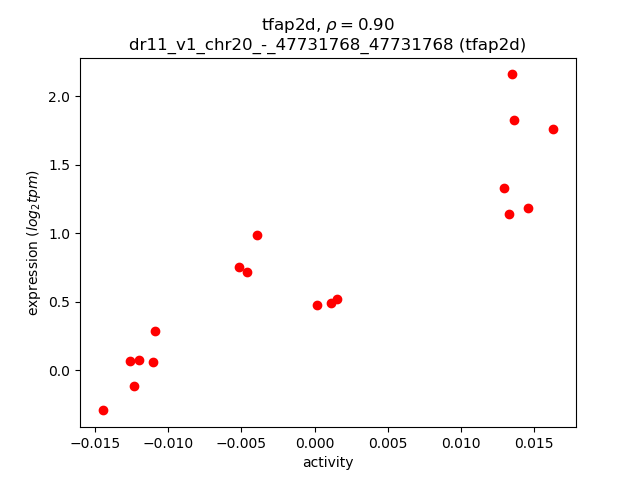
Activity-expression correlation:
| Gene | Promoter | Pearson corr. coef. | P-value | Plot |
|---|---|---|---|---|
| tfap2d | dr11_v1_chr20_-_47731768_47731768 | 0.90 | 2.6e-07 | Click! |
Activity profile of tfap2d motif
Sorted Z-values of tfap2d motif
| Promoter | Log-likelihood | Transcript | Gene | Gene Info |
|---|---|---|---|---|
| chr5_+_42388464 | 0.57 |
ENSDART00000191596
|
BX548073.13
|
|
| chr13_-_36579086 | 0.46 |
ENSDART00000146671
|
lgals3a
|
lectin, galactoside binding soluble 3a |
| chr20_-_14925281 | 0.46 |
ENSDART00000152641
|
dnm3a
|
dynamin 3a |
| chr22_-_188102 | 0.44 |
ENSDART00000125391
ENSDART00000170463 |
CABZ01052268.1
|
|
| chr10_-_322769 | 0.38 |
ENSDART00000165244
|
akt2l
|
v-akt murine thymoma viral oncogene homolog 2, like |
| chr2_-_47681454 | 0.26 |
ENSDART00000056882
|
cul3a
|
cullin 3a |
| chr8_+_50946379 | 0.24 |
ENSDART00000139649
|
b2ml
|
beta-2-microglobulin, like |
| chr17_+_52822831 | 0.21 |
ENSDART00000193368
|
meis2a
|
Meis homeobox 2a |
| chr14_+_52369262 | 0.20 |
ENSDART00000169352
ENSDART00000157833 |
igfbp7
|
insulin-like growth factor binding protein 7 |
| chr12_-_19007834 | 0.16 |
ENSDART00000153248
|
chadlb
|
chondroadherin-like b |
| chr5_+_58520266 | 0.16 |
ENSDART00000108889
|
oafb
|
OAF homolog b (Drosophila) |
| chr14_-_21064199 | 0.12 |
ENSDART00000172099
|
si:dkey-74k8.3
|
si:dkey-74k8.3 |
| chr9_-_4511613 | 0.09 |
ENSDART00000168921
|
kcnj3a
|
potassium inwardly-rectifying channel, subfamily J, member 3a |
| chr22_-_57177 | 0.07 |
ENSDART00000163959
|
CABZ01085139.1
|
|
| chr17_+_52823015 | 0.04 |
ENSDART00000160507
ENSDART00000186979 |
meis2a
|
Meis homeobox 2a |
| chr17_-_19022990 | 0.02 |
ENSDART00000154186
|
flrt2
|
fibronectin leucine rich transmembrane protein 2 |
| chr21_-_5856050 | 0.02 |
ENSDART00000115367
|
CABZ01071020.1
|
|
| chr10_-_373575 | 0.02 |
ENSDART00000114487
|
DMPK
|
DM1 protein kinase |
| chr17_+_24718272 | 0.01 |
ENSDART00000007271
|
mtfr1l
|
mitochondrial fission regulator 1-like |
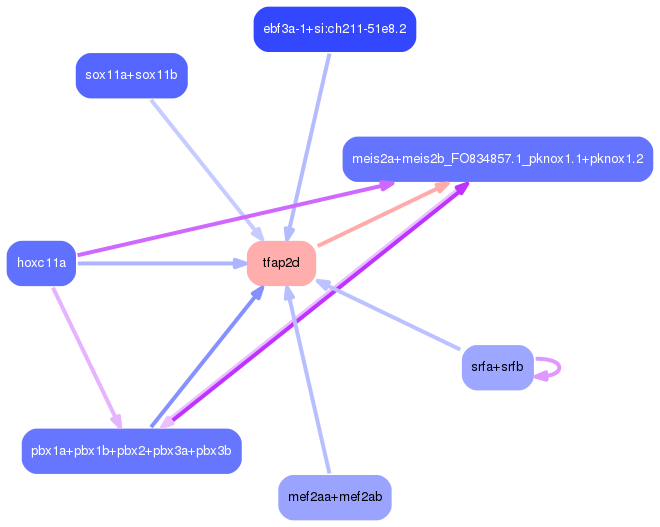
Network of associatons between targets according to the STRING database.

First level regulatory network of tfap2d
Gene Ontology Analysis
Gene overrepresentation in biological process category:
| Log-likelihood per target | Total log-likelihood | Term | Description |
|---|---|---|---|
| 0.1 | 0.5 | GO:0048245 | eosinophil chemotaxis(GO:0048245) eosinophil migration(GO:0072677) |
| 0.0 | 0.1 | GO:0010332 | response to gamma radiation(GO:0010332) cellular response to gamma radiation(GO:0071480) |
| 0.0 | 0.5 | GO:0098884 | postsynaptic neurotransmitter receptor internalization(GO:0098884) |
| 0.0 | 0.2 | GO:0002474 | antigen processing and presentation of peptide antigen via MHC class I(GO:0002474) |
Gene overrepresentation in cellular component category:
| Log-likelihood per target | Total log-likelihood | Term | Description |
|---|---|---|---|
| 0.1 | 0.5 | GO:0001772 | immunological synapse(GO:0001772) |
| 0.0 | 0.2 | GO:0042612 | MHC class I protein complex(GO:0042612) |
| 0.0 | 0.5 | GO:0098844 | postsynaptic endocytic zone membrane(GO:0098844) |
Gene overrepresentation in molecular function category:
| Log-likelihood per target | Total log-likelihood | Term | Description |
|---|---|---|---|
| 0.1 | 0.5 | GO:0019865 | IgE binding(GO:0019863) immunoglobulin binding(GO:0019865) |