Project
PRJNA207719: Tissue specific transcriptome profiling
Navigation
Downloads
Results for hoxb10a+hoxc10a
Z-value: 0.82
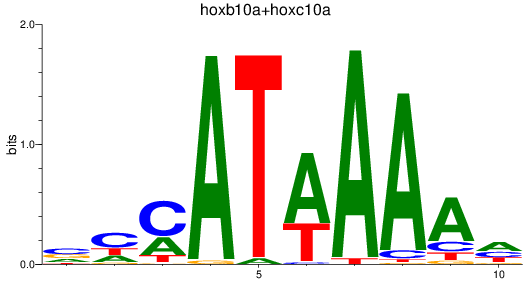
Motif logo
Transcription factors associated with hoxb10a+hoxc10a
| Gene Symbol | Gene ID | Gene Info |
|---|---|---|
|
hoxb10a
|
ENSDARG00000011579 | homeobox B10a |
|
hoxc10a
|
ENSDARG00000070348 | homeobox C10a |
Activity-expression correlation:
| Gene | Promoter | Pearson corr. coef. | P-value | Plot |
|---|---|---|---|---|
| hoxb10a | dr11_v1_chr3_+_23669267_23669267 | -0.50 | 3.9e-01 | Click! |
| hoxc10a | dr11_v1_chr23_+_36083529_36083617 | 0.11 | 8.6e-01 | Click! |
Activity profile of hoxb10a+hoxc10a motif
Sorted Z-values of hoxb10a+hoxc10a motif
| Promoter | Log-likelihood | Transcript | Gene | Gene Info |
|---|---|---|---|---|
| chr23_+_17417539 | 0.92 |
ENSDART00000182605
|
BX649300.2
|
|
| chr1_-_38195012 | 0.85 |
ENSDART00000020409
|
hand2
|
heart and neural crest derivatives expressed 2 |
| chr4_+_7391110 | 0.84 |
ENSDART00000160708
ENSDART00000187823 |
tnni4a
|
troponin I4a |
| chr4_+_7391400 | 0.72 |
ENSDART00000169111
ENSDART00000186395 |
tnni4a
|
troponin I4a |
| chr23_+_7379728 | 0.70 |
ENSDART00000012194
|
gata5
|
GATA binding protein 5 |
| chr11_-_18253111 | 0.48 |
ENSDART00000125984
|
mustn1b
|
musculoskeletal, embryonic nuclear protein 1b |
| chr7_-_16562200 | 0.46 |
ENSDART00000169093
ENSDART00000173491 |
csrp3
|
cysteine and glycine-rich protein 3 (cardiac LIM protein) |
| chr24_+_1042594 | 0.44 |
ENSDART00000109117
|
si:dkey-192l18.9
|
si:dkey-192l18.9 |
| chr13_-_12660318 | 0.42 |
ENSDART00000008498
|
adh8a
|
alcohol dehydrogenase 8a |
| chr5_+_15202495 | 0.42 |
ENSDART00000144915
|
tbx1
|
T-box 1 |
| chr24_-_27452488 | 0.42 |
ENSDART00000136433
|
ccl34b.8
|
chemokine (C-C motif) ligand 34b, duplicate 8 |
| chr20_+_26538137 | 0.42 |
ENSDART00000045397
|
stx11b.1
|
syntaxin 11b, tandem duplicate 1 |
| chr12_-_20373058 | 0.42 |
ENSDART00000066382
|
aqp8a.1
|
aquaporin 8a, tandem duplicate 1 |
| chr16_-_45917322 | 0.39 |
ENSDART00000060822
|
afp4
|
antifreeze protein type IV |
| chr23_+_10146542 | 0.38 |
ENSDART00000048073
|
zgc:171775
|
zgc:171775 |
| chr12_-_26430507 | 0.36 |
ENSDART00000153214
|
synpo2lb
|
synaptopodin 2-like b |
| chr5_-_24174956 | 0.36 |
ENSDART00000137631
|
si:ch211-137i24.10
|
si:ch211-137i24.10 |
| chr2_+_52847049 | 0.35 |
ENSDART00000121980
|
creb3l3b
|
cAMP responsive element binding protein 3-like 3b |
| chr24_-_27473771 | 0.34 |
ENSDART00000139874
|
cxl34b.11
|
CX chemokine ligand 34b, duplicate 11 |
| chr5_-_42883761 | 0.34 |
ENSDART00000167374
|
BX323596.2
|
|
| chr24_-_27461295 | 0.34 |
ENSDART00000110748
|
ccl34b.9
|
chemokine (C-C motif) ligand 34b, duplicate 9 |
| chr12_+_46543572 | 0.33 |
ENSDART00000167510
|
hid1b
|
HID1 domain containing b |
| chr6_+_36877968 | 0.32 |
ENSDART00000155187
|
traf3ip2l
|
TRAF3 interacting protein 2-like |
| chr1_+_1915967 | 0.32 |
ENSDART00000131463
|
si:ch211-132g1.1
|
si:ch211-132g1.1 |
| chr1_-_37377509 | 0.31 |
ENSDART00000113542
|
tnip2
|
TNFAIP3 interacting protein 2 |
| chr7_+_48761875 | 0.31 |
ENSDART00000003690
|
acana
|
aggrecan a |
| chr10_+_26612321 | 0.31 |
ENSDART00000134322
|
fhl1b
|
four and a half LIM domains 1b |
| chr20_+_52546186 | 0.29 |
ENSDART00000110777
ENSDART00000153377 ENSDART00000153013 ENSDART00000042704 |
eef1db
|
eukaryotic translation elongation factor 1 delta b (guanine nucleotide exchange protein) |
| chr20_-_25533739 | 0.28 |
ENSDART00000063064
|
cyp2ad6
|
cytochrome P450, family 2, subfamily AD, polypeptide 6 |
| chr16_+_25664387 | 0.27 |
ENSDART00000184394
|
nsmce2
|
NSE2/MMS21 homolog, SMC5-SMC6 complex SUMO ligase |
| chr19_-_47571456 | 0.27 |
ENSDART00000158071
ENSDART00000165841 |
rrm2
|
ribonucleotide reductase M2 polypeptide |
| chr11_+_14284866 | 0.26 |
ENSDART00000163729
|
si:ch211-262i1.3
|
si:ch211-262i1.3 |
| chr20_-_29499363 | 0.26 |
ENSDART00000152889
ENSDART00000153252 ENSDART00000170972 ENSDART00000166420 ENSDART00000163079 |
rrm2
|
ribonucleotide reductase M2 polypeptide |
| chr24_+_12913329 | 0.26 |
ENSDART00000141829
|
si:dkeyp-28d2.4
|
si:dkeyp-28d2.4 |
| chr13_-_50108337 | 0.26 |
ENSDART00000133308
|
nid1a
|
nidogen 1a |
| chr22_+_1779401 | 0.25 |
ENSDART00000170126
|
znf1154
|
zinc finger protein 1154 |
| chr16_-_7443388 | 0.25 |
ENSDART00000017445
|
prdm1a
|
PR domain containing 1a, with ZNF domain |
| chr7_-_60096318 | 0.25 |
ENSDART00000189125
|
BX511067.1
|
|
| chr15_-_4580763 | 0.25 |
ENSDART00000008170
|
rffl
|
ring finger and FYVE-like domain containing E3 ubiquitin protein ligase |
| chr8_+_2487250 | 0.24 |
ENSDART00000081325
|
dynll1
|
dynein, light chain, LC8-type 1 |
| chr19_+_28187480 | 0.24 |
ENSDART00000183825
|
irx4b
|
iroquois homeobox 4b |
| chr6_+_13045885 | 0.23 |
ENSDART00000104757
|
casp8
|
caspase 8, apoptosis-related cysteine peptidase |
| chr12_-_13155653 | 0.23 |
ENSDART00000152467
|
cxl34c
|
CX chemokine ligand 34c |
| chr21_-_2415808 | 0.23 |
ENSDART00000171179
|
si:ch211-241b2.5
|
si:ch211-241b2.5 |
| chr8_+_3379815 | 0.22 |
ENSDART00000155995
|
FUT9 (1 of many)
|
zgc:136963 |
| chr6_+_41191482 | 0.22 |
ENSDART00000000877
|
opn1mw3
|
opsin 1 (cone pigments), medium-wave-sensitive, 3 |
| chr19_+_17385561 | 0.22 |
ENSDART00000141397
ENSDART00000143913 ENSDART00000133626 |
rpl15
|
ribosomal protein L15 |
| chr3_-_31069776 | 0.21 |
ENSDART00000167462
|
elob
|
elongin B |
| chr3_+_35812040 | 0.21 |
ENSDART00000075903
ENSDART00000147712 |
crlf3
|
cytokine receptor-like factor 3 |
| chr16_+_25664078 | 0.21 |
ENSDART00000154024
|
nsmce2
|
NSE2/MMS21 homolog, SMC5-SMC6 complex SUMO ligase |
| chr1_+_40801448 | 0.20 |
ENSDART00000187394
|
cpz
|
carboxypeptidase Z |
| chr1_-_9249943 | 0.20 |
ENSDART00000055011
|
zgc:136472
|
zgc:136472 |
| chr17_+_33453689 | 0.20 |
ENSDART00000156894
|
rin3
|
Ras and Rab interactor 3 |
| chr4_+_2267641 | 0.20 |
ENSDART00000165503
|
si:ch73-89b15.3
|
si:ch73-89b15.3 |
| chr13_-_35984530 | 0.20 |
ENSDART00000143488
|
si:ch211-67f13.8
|
si:ch211-67f13.8 |
| chr5_-_57723929 | 0.20 |
ENSDART00000144237
|
gig2p
|
grass carp reovirus (GCRV)-induced gene 2p |
| chr23_+_24085531 | 0.20 |
ENSDART00000139710
|
ttll10
|
tubulin tyrosine ligase-like family, member 10 |
| chr23_+_39606108 | 0.20 |
ENSDART00000109464
|
g0s2
|
G0/G1 switch 2 |
| chr6_-_12588044 | 0.19 |
ENSDART00000047896
|
slc15a1b
|
solute carrier family 15 (oligopeptide transporter), member 1b |
| chr5_-_26181863 | 0.19 |
ENSDART00000098500
|
ccdc125
|
coiled-coil domain containing 125 |
| chr16_+_50969248 | 0.19 |
ENSDART00000172068
|
si:dkeyp-97a10.2
|
si:dkeyp-97a10.2 |
| chr8_+_2487883 | 0.18 |
ENSDART00000101841
|
dynll1
|
dynein, light chain, LC8-type 1 |
| chr2_-_28420415 | 0.18 |
ENSDART00000183857
|
CABZ01056051.1
|
|
| chr13_-_42749916 | 0.18 |
ENSDART00000140019
|
capn2a
|
calpain 2, (m/II) large subunit a |
| chr5_-_23715861 | 0.18 |
ENSDART00000019992
|
gbgt1l1
|
globoside alpha-1,3-N-acetylgalactosaminyltransferase 1, like 1 |
| chr2_+_20406399 | 0.18 |
ENSDART00000006817
ENSDART00000137848 |
palmda
|
palmdelphin a |
| chr22_-_4644484 | 0.17 |
ENSDART00000167748
|
fbn2b
|
fibrillin 2b |
| chr11_-_27778831 | 0.16 |
ENSDART00000023823
|
cass4
|
Cas scaffolding protein family member 4 |
| chr23_+_27068225 | 0.16 |
ENSDART00000054238
|
mipa
|
major intrinsic protein of lens fiber a |
| chr17_+_45395846 | 0.16 |
ENSDART00000058793
|
nenf
|
neudesin neurotrophic factor |
| chr20_-_32045057 | 0.16 |
ENSDART00000152970
ENSDART00000034248 |
rab32a
|
RAB32a, member RAS oncogene family |
| chr17_+_27456804 | 0.16 |
ENSDART00000017756
ENSDART00000181461 ENSDART00000180178 |
ctsl.1
|
cathepsin L.1 |
| chr17_-_47090440 | 0.16 |
ENSDART00000163542
|
CABZ01056321.1
|
|
| chr19_+_19762183 | 0.16 |
ENSDART00000163611
ENSDART00000187604 |
hoxa3a
|
homeobox A3a |
| chr16_-_21038015 | 0.16 |
ENSDART00000059239
|
snx10b
|
sorting nexin 10b |
| chr23_+_43718115 | 0.15 |
ENSDART00000149266
ENSDART00000149503 |
anapc10
|
anaphase promoting complex subunit 10 |
| chr17_-_2690083 | 0.15 |
ENSDART00000135374
|
ptpn21
|
protein tyrosine phosphatase, non-receptor type 21 |
| chr4_+_37406676 | 0.15 |
ENSDART00000130981
|
si:ch73-134f24.1
|
si:ch73-134f24.1 |
| chr7_-_29341233 | 0.15 |
ENSDART00000140938
ENSDART00000147251 |
trpm1a
|
transient receptor potential cation channel, subfamily M, member 1a |
| chr12_+_19191787 | 0.15 |
ENSDART00000152892
|
slc16a8
|
solute carrier family 16 (monocarboxylate transporter), member 8 |
| chr2_-_38287987 | 0.15 |
ENSDART00000185329
ENSDART00000061677 |
si:ch211-14a17.6
|
si:ch211-14a17.6 |
| chr13_-_26799244 | 0.15 |
ENSDART00000036419
|
vrk2
|
vaccinia related kinase 2 |
| chr21_+_20396858 | 0.14 |
ENSDART00000003299
ENSDART00000146615 |
zgc:103482
|
zgc:103482 |
| chr7_-_69025306 | 0.14 |
ENSDART00000180796
|
CABZ01057488.2
|
|
| chr7_+_24165371 | 0.14 |
ENSDART00000173472
|
si:ch211-216p19.5
|
si:ch211-216p19.5 |
| chr5_-_54712159 | 0.14 |
ENSDART00000149207
|
ccnb1
|
cyclin B1 |
| chr14_-_33613794 | 0.14 |
ENSDART00000010022
|
xpnpep2
|
X-prolyl aminopeptidase (aminopeptidase P) 2, membrane-bound |
| chr17_+_14965570 | 0.14 |
ENSDART00000066604
|
gpr137c
|
G protein-coupled receptor 137c |
| chr21_-_21537452 | 0.14 |
ENSDART00000142549
|
or133-7
|
odorant receptor, family H, subfamily 133, member 7 |
| chr21_-_14826066 | 0.13 |
ENSDART00000067001
|
noc4l
|
nucleolar complex associated 4 homolog |
| chr11_-_2700397 | 0.13 |
ENSDART00000082511
|
si:ch211-160o17.6
|
si:ch211-160o17.6 |
| chr2_+_5927255 | 0.13 |
ENSDART00000152866
|
si:ch211-168b3.2
|
si:ch211-168b3.2 |
| chr13_+_22295905 | 0.13 |
ENSDART00000180133
ENSDART00000181125 |
usp54a
|
ubiquitin specific peptidase 54a |
| chr19_-_47571797 | 0.13 |
ENSDART00000166180
ENSDART00000168134 |
rrm2
|
ribonucleotide reductase M2 polypeptide |
| chr13_+_24584401 | 0.13 |
ENSDART00000057599
|
fuom
|
fucose mutarotase |
| chr11_-_24016761 | 0.12 |
ENSDART00000153601
ENSDART00000067817 ENSDART00000170531 |
chia.3
|
chitinase, acidic.3 |
| chr21_-_25756119 | 0.12 |
ENSDART00000002341
|
cldnc
|
claudin c |
| chr19_+_19761966 | 0.12 |
ENSDART00000163697
|
hoxa3a
|
homeobox A3a |
| chr15_-_1843831 | 0.12 |
ENSDART00000156718
ENSDART00000154175 |
taf15
|
TAF15 RNA polymerase II, TATA box binding protein (TBP)-associated factor |
| chr6_+_13083146 | 0.11 |
ENSDART00000172158
|
l3hypdh
|
trans-L-3-hydroxyproline dehydratase |
| chr11_+_36683859 | 0.11 |
ENSDART00000170102
|
si:ch211-11c3.12
|
si:ch211-11c3.12 |
| chr17_+_17764979 | 0.11 |
ENSDART00000105013
|
alkbh1
|
alkB homolog 1, histone H2A dioxygenase |
| chr4_-_14191434 | 0.11 |
ENSDART00000142374
ENSDART00000136730 |
pus7l
|
pseudouridylate synthase 7-like |
| chr13_+_45431660 | 0.11 |
ENSDART00000099950
|
syf2
|
SYF2 pre-mRNA-splicing factor |
| chr8_+_30709685 | 0.11 |
ENSDART00000133989
|
upb1
|
ureidopropionase, beta |
| chr18_+_41232719 | 0.11 |
ENSDART00000138552
ENSDART00000145863 |
trip12
|
thyroid hormone receptor interactor 12 |
| chr9_-_41025062 | 0.10 |
ENSDART00000002053
|
pms1
|
PMS1 homolog 1, mismatch repair system component |
| chr10_+_36650222 | 0.10 |
ENSDART00000126963
|
ucp3
|
uncoupling protein 3 |
| chr13_-_15793585 | 0.10 |
ENSDART00000145914
ENSDART00000010286 |
bag5
|
BCL2 associated athanogene 5 |
| chr12_-_17602958 | 0.10 |
ENSDART00000134690
ENSDART00000028090 |
eif2ak1
|
eukaryotic translation initiation factor 2-alpha kinase 1 |
| chr12_+_27117609 | 0.10 |
ENSDART00000076154
|
hoxb8b
|
homeobox B8b |
| chr25_+_29474982 | 0.10 |
ENSDART00000130410
|
il17rel
|
interleukin 17 receptor E-like |
| chr21_-_32781612 | 0.09 |
ENSDART00000031028
|
cnot6a
|
CCR4-NOT transcription complex, subunit 6a |
| chr4_-_14191717 | 0.09 |
ENSDART00000147928
|
pus7l
|
pseudouridylate synthase 7-like |
| chr17_-_15746898 | 0.09 |
ENSDART00000180079
|
cx52.7
|
connexin 52.7 |
| chr3_+_46764278 | 0.09 |
ENSDART00000136051
ENSDART00000164930 |
prkcsh
|
protein kinase C substrate 80K-H |
| chr7_+_27317174 | 0.09 |
ENSDART00000193058
|
sox6
|
SRY (sex determining region Y)-box 6 |
| chr17_-_15747296 | 0.09 |
ENSDART00000153970
|
cx52.7
|
connexin 52.7 |
| chr24_+_1294176 | 0.09 |
ENSDART00000106637
|
si:ch73-134f24.1
|
si:ch73-134f24.1 |
| chr4_+_44954486 | 0.09 |
ENSDART00000150875
|
si:dkeyp-100h4.8
|
si:dkeyp-100h4.8 |
| chr12_+_34051848 | 0.09 |
ENSDART00000153276
|
cyth1b
|
cytohesin 1b |
| chr5_-_57289872 | 0.09 |
ENSDART00000189893
ENSDART00000050957 |
fer
|
fer (fps/fes related) tyrosine kinase |
| chr23_+_33934228 | 0.08 |
ENSDART00000134237
|
si:ch211-148l7.4
|
si:ch211-148l7.4 |
| chr14_-_31488100 | 0.08 |
ENSDART00000186246
|
cab39l1
|
calcium binding protein 39, like 1 |
| chr4_+_51552434 | 0.08 |
ENSDART00000165016
|
si:dkey-165e24.1
|
si:dkey-165e24.1 |
| chr24_+_7495945 | 0.08 |
ENSDART00000133525
ENSDART00000182460 ENSDART00000162954 |
kmt2ca
|
lysine (K)-specific methyltransferase 2Ca |
| chr20_-_33961697 | 0.08 |
ENSDART00000061765
|
selp
|
selectin P |
| chr4_-_14192254 | 0.08 |
ENSDART00000143804
|
pus7l
|
pseudouridylate synthase 7-like |
| chr12_-_22400999 | 0.08 |
ENSDART00000153194
|
si:dkey-38p12.3
|
si:dkey-38p12.3 |
| chr6_-_30485009 | 0.08 |
ENSDART00000025698
|
zgc:153311
|
zgc:153311 |
| chr18_+_19974289 | 0.08 |
ENSDART00000090334
ENSDART00000192982 |
skor1b
|
SKI family transcriptional corepressor 1b |
| chr15_+_31344472 | 0.08 |
ENSDART00000146695
ENSDART00000159182 ENSDART00000060125 |
or107-1
|
odorant receptor, family D, subfamily 107, member 1 |
| chr20_-_51186524 | 0.08 |
ENSDART00000027836
ENSDART00000114407 |
rbm25b
|
RNA binding motif protein 25b |
| chr20_+_6543674 | 0.07 |
ENSDART00000134204
|
tns3.1
|
tensin 3, tandem duplicate 1 |
| chr21_+_4313039 | 0.07 |
ENSDART00000141146
|
HTRA2 (1 of many)
|
si:dkey-84o3.4 |
| chr18_-_17513426 | 0.07 |
ENSDART00000146725
|
b3gnt9
|
UDP-GlcNAc:betaGal beta-1,3-N-acetylglucosaminyltransferase 9 |
| chr16_+_25535993 | 0.06 |
ENSDART00000077436
|
mylipb
|
myosin regulatory light chain interacting protein b |
| chr13_-_50546634 | 0.06 |
ENSDART00000192127
|
CU570781.2
|
|
| chr1_-_35924495 | 0.06 |
ENSDART00000184424
|
smad1
|
SMAD family member 1 |
| chr22_+_25331766 | 0.06 |
ENSDART00000155006
ENSDART00000155836 |
si:ch211-226h8.15
|
si:ch211-226h8.15 |
| chr19_-_22843480 | 0.06 |
ENSDART00000052503
|
nudcd1
|
NudC domain containing 1 |
| chr2_+_35595454 | 0.06 |
ENSDART00000098734
|
cacybp
|
calcyclin binding protein |
| chr10_+_11265387 | 0.05 |
ENSDART00000038888
|
hsdl2
|
hydroxysteroid dehydrogenase like 2 |
| chr10_+_2587234 | 0.05 |
ENSDART00000126937
|
wu:fb59d01
|
wu:fb59d01 |
| chr19_-_10881141 | 0.05 |
ENSDART00000162793
|
psmd4a
|
proteasome 26S subunit, non-ATPase 4a |
| chr16_-_21668082 | 0.05 |
ENSDART00000088513
|
gnl1
|
guanine nucleotide binding protein-like 1 |
| chr23_-_9807546 | 0.05 |
ENSDART00000136740
ENSDART00000004474 |
mapre1b
|
microtubule-associated protein, RP/EB family, member 1b |
| chr9_-_34937025 | 0.05 |
ENSDART00000137888
|
cdc16
|
cell division cycle 16 homolog (S. cerevisiae) |
| chr7_+_34296789 | 0.05 |
ENSDART00000052471
ENSDART00000173798 ENSDART00000173778 |
bbox1
|
butyrobetaine (gamma), 2-oxoglutarate dioxygenase (gamma-butyrobetaine hydroxylase) 1 |
| chr16_+_13883872 | 0.05 |
ENSDART00000101304
ENSDART00000136005 |
atg12
|
ATG12 autophagy related 12 homolog (S. cerevisiae) |
| chr7_+_58179513 | 0.04 |
ENSDART00000123117
|
ggh
|
gamma-glutamyl hydrolase (conjugase, folylpolygammaglutamyl hydrolase) |
| chr5_-_36597612 | 0.04 |
ENSDART00000031270
ENSDART00000122098 |
rhogc
|
ras homolog gene family, member Gc |
| chr11_-_6265574 | 0.04 |
ENSDART00000181974
ENSDART00000104405 |
ccl25b
|
chemokine (C-C motif) ligand 25b |
| chr4_-_56898328 | 0.04 |
ENSDART00000169189
|
si:dkey-269o24.6
|
si:dkey-269o24.6 |
| chr18_-_15329454 | 0.04 |
ENSDART00000191903
ENSDART00000019818 |
ric8b
|
RIC8 guanine nucleotide exchange factor B |
| chr14_+_21159693 | 0.04 |
ENSDART00000192678
|
zgc:136929
|
zgc:136929 |
| chr2_-_6039757 | 0.04 |
ENSDART00000013079
|
scp2a
|
sterol carrier protein 2a |
| chr22_+_26853254 | 0.03 |
ENSDART00000182487
|
tmem186
|
transmembrane protein 186 |
| chr19_-_10881486 | 0.03 |
ENSDART00000168852
ENSDART00000160438 |
PSMD4 (1 of many)
psmd4a
|
proteasome 26S subunit, non-ATPase 4 proteasome 26S subunit, non-ATPase 4a |
| chr10_-_35002731 | 0.03 |
ENSDART00000131279
|
alg5
|
asparagine-linked glycosylation 5 (dolichyl-phosphate beta-glucosyltransferase) |
| chr23_-_43718067 | 0.03 |
ENSDART00000015777
|
abce1
|
ATP-binding cassette, sub-family E (OABP), member 1 |
| chr19_-_20163197 | 0.03 |
ENSDART00000148179
ENSDART00000151646 |
fam221a
|
family with sequence similarity 221, member A |
| chr2_-_55298075 | 0.03 |
ENSDART00000186404
ENSDART00000149062 |
rab8a
|
RAB8A, member RAS oncogene family |
| chr6_+_28208973 | 0.03 |
ENSDART00000171216
ENSDART00000171377 ENSDART00000167389 ENSDART00000166988 |
LSM2 (1 of many)
|
si:ch73-14h10.2 |
| chr6_+_52790049 | 0.03 |
ENSDART00000002571
|
matn4
|
matrilin 4 |
| chr14_+_23184517 | 0.03 |
ENSDART00000181410
|
enox2
|
ecto-NOX disulfide-thiol exchanger 2 |
| chr13_+_9612395 | 0.03 |
ENSDART00000136689
ENSDART00000138362 |
slf2
|
SMC5-SMC6 complex localization factor 2 |
| chr5_+_23136544 | 0.03 |
ENSDART00000003428
ENSDART00000109340 ENSDART00000171039 ENSDART00000178821 |
prps1a
|
phosphoribosyl pyrophosphate synthetase 1A |
| chr15_-_5212930 | 0.02 |
ENSDART00000136845
|
or128-6
|
odorant receptor, family E, subfamily 128, member 6 |
| chr5_+_30588856 | 0.02 |
ENSDART00000086661
|
dpagt1
|
dolichyl-phosphate (UDP-N-acetylglucosamine) N-acetylglucosaminephosphotransferase 1 (GlcNAc-1-P transferase) |
| chr5_+_26913120 | 0.02 |
ENSDART00000126609
|
tbx3b
|
T-box 3b |
| chr5_-_50371205 | 0.02 |
ENSDART00000157800
|
si:ch73-280o22.2
|
si:ch73-280o22.2 |
| chr23_-_24047054 | 0.02 |
ENSDART00000184308
ENSDART00000185902 |
CR925720.1
|
|
| chr12_+_17603528 | 0.02 |
ENSDART00000111565
|
pms2
|
PMS1 homolog 2, mismatch repair system component |
| chr19_+_2590182 | 0.02 |
ENSDART00000162293
|
si:ch73-345f18.3
|
si:ch73-345f18.3 |
| chr1_-_39983730 | 0.02 |
ENSDART00000160066
|
ing2
|
inhibitor of growth family, member 2 |
| chr3_-_32873641 | 0.02 |
ENSDART00000075277
|
zgc:113090
|
zgc:113090 |
| chr10_-_10969444 | 0.02 |
ENSDART00000138041
|
exd3
|
exonuclease 3'-5' domain containing 3 |
| chr25_-_31898552 | 0.02 |
ENSDART00000156128
|
si:ch73-330k17.3
|
si:ch73-330k17.3 |
| chr2_-_35566938 | 0.02 |
ENSDART00000029006
ENSDART00000077178 ENSDART00000125298 |
tnn
|
tenascin N |
| chr13_-_37519774 | 0.02 |
ENSDART00000141420
ENSDART00000185478 |
sgpp1
|
sphingosine-1-phosphate phosphatase 1 |
| chr10_+_5234327 | 0.02 |
ENSDART00000133927
ENSDART00000063120 |
sptlc1
|
serine palmitoyltransferase, long chain base subunit 1 |
| chr2_-_45663945 | 0.02 |
ENSDART00000075080
|
prpf38b
|
pre-mRNA processing factor 38B |
| chr17_+_47090497 | 0.01 |
ENSDART00000169038
ENSDART00000159292 |
zgc:103755
|
zgc:103755 |
| chr12_+_27704015 | 0.01 |
ENSDART00000153256
|
cacna1g
|
calcium channel, voltage-dependent, T type, alpha 1G subunit |
| chr2_-_34072218 | 0.01 |
ENSDART00000184618
|
eif2b3
|
eukaryotic translation initiation factor 2B, subunit 3 gamma |
| chr5_-_30080332 | 0.01 |
ENSDART00000140049
|
bco2a
|
beta-carotene oxygenase 2a |
| chr9_-_41784799 | 0.01 |
ENSDART00000144573
ENSDART00000112542 ENSDART00000190486 |
obsl1b
|
obscurin-like 1b |
| chr8_+_8860902 | 0.00 |
ENSDART00000144986
|
otud5a
|
OTU deubiquitinase 5a |
| chr18_+_7363242 | 0.00 |
ENSDART00000133375
|
si:dkey-30c15.17
|
si:dkey-30c15.17 |
| chr7_+_22688781 | 0.00 |
ENSDART00000173509
|
ugt5g1
|
UDP glucuronosyltransferase 5 family, polypeptide G1 |
| chr5_+_45140914 | 0.00 |
ENSDART00000172702
|
smarca2
|
SWI/SNF related, matrix associated, actin dependent regulator of chromatin, subfamily a, member 2 |
| chr25_+_20089986 | 0.00 |
ENSDART00000143441
ENSDART00000184073 |
tnni4b.2
|
troponin I4b, tandem duplicate 2 |
Network of associatons between targets according to the STRING database.

First level regulatory network of hoxb10a+hoxc10a
Gene Ontology Analysis
Gene overrepresentation in biological process category:
| Log-likelihood per target | Total log-likelihood | Term | Description |
|---|---|---|---|
| 0.2 | 0.7 | GO:0048618 | post-embryonic foregut morphogenesis(GO:0048618) |
| 0.1 | 0.8 | GO:0071908 | determination of intestine left/right asymmetry(GO:0071908) |
| 0.1 | 0.4 | GO:0003156 | regulation of organ formation(GO:0003156) |
| 0.1 | 0.5 | GO:0035994 | response to muscle stretch(GO:0035994) |
| 0.1 | 0.3 | GO:0034134 | toll-like receptor 2 signaling pathway(GO:0034134) toll-like receptor 3 signaling pathway(GO:0034138) |
| 0.1 | 0.5 | GO:0035988 | chondrocyte proliferation(GO:0035988) |
| 0.1 | 0.2 | GO:0043903 | regulation of symbiosis, encompassing mutualism through parasitism(GO:0043903) |
| 0.1 | 0.4 | GO:2000580 | positive regulation of microtubule motor activity(GO:2000576) regulation of ATP-dependent microtubule motor activity, plus-end-directed(GO:2000580) positive regulation of ATP-dependent microtubule motor activity, plus-end-directed(GO:2000582) |
| 0.1 | 0.4 | GO:0046294 | formaldehyde metabolic process(GO:0046292) formaldehyde catabolic process(GO:0046294) |
| 0.1 | 0.7 | GO:0009263 | deoxyribonucleotide biosynthetic process(GO:0009263) |
| 0.1 | 0.2 | GO:0060958 | cell proliferation involved in heart valve morphogenesis(GO:0003249) regulation of cell proliferation involved in heart valve morphogenesis(GO:0003250) endocardial cell development(GO:0060958) cell proliferation involved in heart valve development(GO:2000793) |
| 0.1 | 0.3 | GO:0003151 | outflow tract morphogenesis(GO:0003151) |
| 0.0 | 0.3 | GO:0060017 | parathyroid gland development(GO:0060017) |
| 0.0 | 0.2 | GO:2001271 | negative regulation of execution phase of apoptosis(GO:1900118) regulation of cysteine-type endopeptidase activity involved in execution phase of apoptosis(GO:2001270) negative regulation of cysteine-type endopeptidase activity involved in execution phase of apoptosis(GO:2001271) |
| 0.0 | 0.2 | GO:0090527 | actin filament reorganization(GO:0090527) |
| 0.0 | 1.6 | GO:0003009 | skeletal muscle contraction(GO:0003009) |
| 0.0 | 0.1 | GO:0035513 | oxidative RNA demethylation(GO:0035513) |
| 0.0 | 0.2 | GO:0006857 | oligopeptide transport(GO:0006857) |
| 0.0 | 0.1 | GO:0038093 | Fc receptor signaling pathway(GO:0038093) |
| 0.0 | 0.1 | GO:0019482 | beta-alanine metabolic process(GO:0019482) beta-alanine biosynthetic process(GO:0019483) |
| 0.0 | 0.1 | GO:0006004 | fucose metabolic process(GO:0006004) |
| 0.0 | 0.2 | GO:0031295 | lymphocyte costimulation(GO:0031294) T cell costimulation(GO:0031295) |
| 0.0 | 0.3 | GO:0042693 | muscle cell fate commitment(GO:0042693) |
| 0.0 | 0.8 | GO:0048247 | lymphocyte chemotaxis(GO:0048247) |
| 0.0 | 0.2 | GO:0006833 | water transport(GO:0006833) |
| 0.0 | 0.2 | GO:0060036 | notochord cell vacuolation(GO:0060036) |
| 0.0 | 0.1 | GO:0033183 | negative regulation of histone ubiquitination(GO:0033183) regulation of protein K63-linked ubiquitination(GO:1900044) negative regulation of protein K63-linked ubiquitination(GO:1900045) regulation of histone H2A K63-linked ubiquitination(GO:1901314) negative regulation of histone H2A K63-linked ubiquitination(GO:1901315) regulation of protein polyubiquitination(GO:1902914) negative regulation of protein polyubiquitination(GO:1902915) |
| 0.0 | 0.5 | GO:0016925 | protein sumoylation(GO:0016925) |
| 0.0 | 0.1 | GO:0007080 | mitotic metaphase plate congression(GO:0007080) |
| 0.0 | 0.2 | GO:0035024 | negative regulation of Rho protein signal transduction(GO:0035024) |
| 0.0 | 0.1 | GO:0045948 | positive regulation of translational initiation(GO:0045948) |
| 0.0 | 0.3 | GO:1990798 | pancreas regeneration(GO:1990798) |
| 0.0 | 0.2 | GO:0070979 | protein K11-linked ubiquitination(GO:0070979) |
| 0.0 | 0.1 | GO:0097241 | hematopoietic stem cell migration to bone marrow(GO:0097241) |
| 0.0 | 0.4 | GO:0032233 | positive regulation of actin filament bundle assembly(GO:0032233) |
| 0.0 | 0.1 | GO:1990845 | adaptive thermogenesis(GO:1990845) |
| 0.0 | 0.4 | GO:0060030 | dorsal convergence(GO:0060030) |
| 0.0 | 0.1 | GO:1904263 | positive regulation of TORC1 signaling(GO:1904263) |
| 0.0 | 0.1 | GO:0006032 | chitin catabolic process(GO:0006032) |
| 0.0 | 0.3 | GO:0001522 | pseudouridine synthesis(GO:0001522) |
| 0.0 | 0.0 | GO:0046900 | tetrahydrofolylpolyglutamate metabolic process(GO:0046900) |
| 0.0 | 0.2 | GO:0030259 | lipid glycosylation(GO:0030259) |
Gene overrepresentation in cellular component category:
| Log-likelihood per target | Total log-likelihood | Term | Description |
|---|---|---|---|
| 0.1 | 0.5 | GO:0030915 | Smc5-Smc6 complex(GO:0030915) |
| 0.1 | 0.3 | GO:0005797 | Golgi medial cisterna(GO:0005797) |
| 0.0 | 0.1 | GO:0097125 | cyclin B1-CDK1 complex(GO:0097125) |
| 0.0 | 0.1 | GO:0030689 | Noc complex(GO:0030689) |
| 0.0 | 0.3 | GO:0005853 | eukaryotic translation elongation factor 1 complex(GO:0005853) |
| 0.0 | 1.6 | GO:0005861 | troponin complex(GO:0005861) |
| 0.0 | 0.2 | GO:0030891 | VCB complex(GO:0030891) |
| 0.0 | 0.4 | GO:0005868 | cytoplasmic dynein complex(GO:0005868) |
| 0.0 | 0.1 | GO:0017177 | glucosidase II complex(GO:0017177) |
| 0.0 | 0.4 | GO:0048787 | presynaptic active zone membrane(GO:0048787) |
| 0.0 | 0.1 | GO:0032300 | mismatch repair complex(GO:0032300) |
| 0.0 | 0.1 | GO:0000974 | Prp19 complex(GO:0000974) |
Gene overrepresentation in molecular function category:
| Log-likelihood per target | Total log-likelihood | Term | Description |
|---|---|---|---|
| 0.1 | 0.7 | GO:0016728 | ribonucleoside-diphosphate reductase activity, thioredoxin disulfide as acceptor(GO:0004748) oxidoreductase activity, acting on CH or CH2 groups, disulfide as acceptor(GO:0016728) ribonucleoside-diphosphate reductase activity(GO:0061731) |
| 0.1 | 0.4 | GO:0051903 | alcohol dehydrogenase activity, zinc-dependent(GO:0004024) S-(hydroxymethyl)glutathione dehydrogenase activity(GO:0051903) |
| 0.1 | 0.6 | GO:0015250 | water channel activity(GO:0015250) |
| 0.0 | 0.8 | GO:0031726 | CCR1 chemokine receptor binding(GO:0031726) CCR4 chemokine receptor binding(GO:0031729) |
| 0.0 | 0.1 | GO:0042806 | fucose binding(GO:0042806) |
| 0.0 | 0.5 | GO:0061665 | SUMO ligase activity(GO:0061665) |
| 0.0 | 0.2 | GO:0004104 | cholinesterase activity(GO:0004104) |
| 0.0 | 0.2 | GO:0071916 | dipeptide transporter activity(GO:0042936) dipeptide transmembrane transporter activity(GO:0071916) |
| 0.0 | 0.1 | GO:0035516 | oxidative DNA demethylase activity(GO:0035516) |
| 0.0 | 0.1 | GO:0017077 | oxidative phosphorylation uncoupler activity(GO:0017077) |
| 0.0 | 0.3 | GO:0070530 | K63-linked polyubiquitin binding(GO:0070530) |
| 0.0 | 0.3 | GO:0035497 | cAMP response element binding(GO:0035497) |
| 0.0 | 0.5 | GO:0042805 | actinin binding(GO:0042805) |
| 0.0 | 0.0 | GO:0008336 | gamma-butyrobetaine dioxygenase activity(GO:0008336) |
| 0.0 | 0.2 | GO:0097199 | cysteine-type endopeptidase activity involved in apoptotic signaling pathway(GO:0097199) |
| 0.0 | 0.3 | GO:0009982 | pseudouridine synthase activity(GO:0009982) |
| 0.0 | 0.4 | GO:0045505 | dynein intermediate chain binding(GO:0045505) |
| 0.0 | 0.1 | GO:0044548 | S100 protein binding(GO:0044548) |
| 0.0 | 0.6 | GO:0008009 | chemokine activity(GO:0008009) |
| 0.0 | 0.2 | GO:0015129 | lactate transmembrane transporter activity(GO:0015129) |
| 0.0 | 0.1 | GO:0004568 | chitinase activity(GO:0004568) |
Gene overrepresentation in curated gene sets: canonical pathways category:
| Log-likelihood per target | Total log-likelihood | Term | Description |
|---|---|---|---|
| 0.0 | 0.2 | SA FAS SIGNALING | The TNF-type receptor Fas induces apoptosis on ligand binding. |
Gene overrepresentation in curated gene sets: REACTOME pathways category:
| Log-likelihood per target | Total log-likelihood | Term | Description |
|---|---|---|---|
| 0.0 | 0.4 | REACTOME ACTIVATION OF BH3 ONLY PROTEINS | Genes involved in Activation of BH3-only proteins |
| 0.0 | 0.7 | REACTOME SYNTHESIS AND INTERCONVERSION OF NUCLEOTIDE DI AND TRIPHOSPHATES | Genes involved in Synthesis and interconversion of nucleotide di- and triphosphates |
| 0.0 | 0.2 | REACTOME EXTRINSIC PATHWAY FOR APOPTOSIS | Genes involved in Extrinsic Pathway for Apoptosis |
| 0.0 | 0.3 | REACTOME PHOSPHORYLATION OF THE APC C | Genes involved in Phosphorylation of the APC/C |
| 0.0 | 0.1 | REACTOME PYRIMIDINE CATABOLISM | Genes involved in Pyrimidine catabolism |
| 0.0 | 0.1 | REACTOME ADVANCED GLYCOSYLATION ENDPRODUCT RECEPTOR SIGNALING | Genes involved in Advanced glycosylation endproduct receptor signaling |