Project
PRJNA207719: Tissue specific transcriptome profiling
Navigation
Downloads
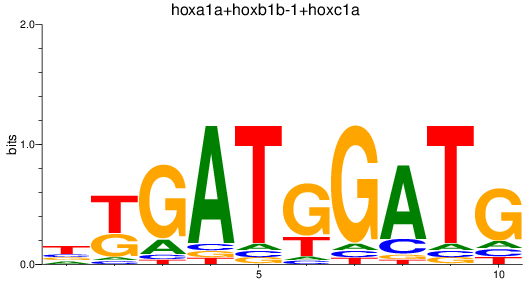
Results for hoxa1a+hoxb1b-1+hoxc1a
Z-value: 1.88
Motif logo
Transcription factors associated with hoxa1a+hoxb1b-1+hoxc1a
| Gene Symbol | Gene ID | Gene Info |
|---|---|---|
|
hoxb1b-1
|
ENSDARG00000054033 | homeobox B1b |
|
hoxc1a
|
ENSDARG00000070337 | homeobox C1a |
|
hoxa1a
|
ENSDARG00000104307 | homeobox A1a |
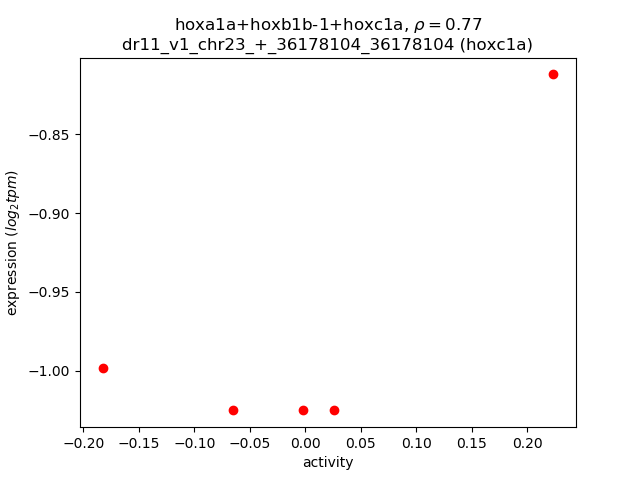
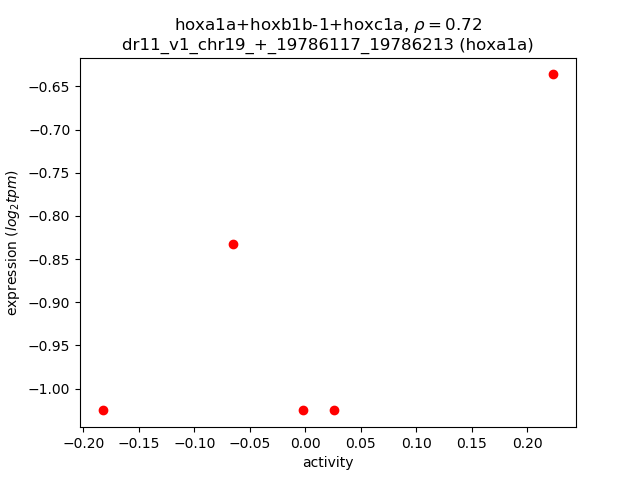
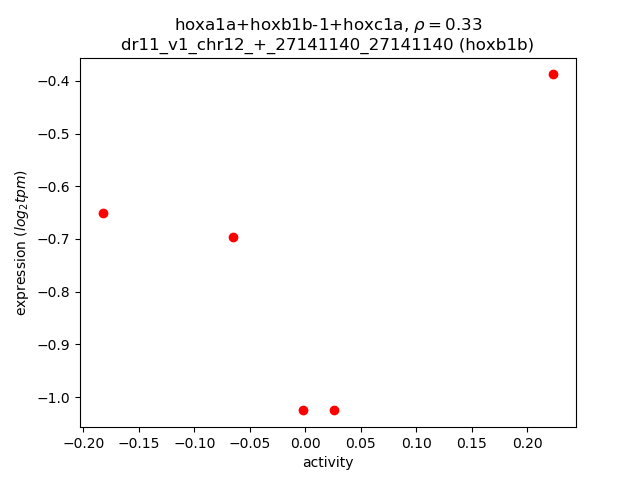
Activity-expression correlation:
| Gene | Promoter | Pearson corr. coef. | P-value | Plot |
|---|---|---|---|---|
| hoxc1a | dr11_v1_chr23_+_36178104_36178104 | 0.77 | 1.3e-01 | Click! |
| hoxa1a | dr11_v1_chr19_+_19786117_19786213 | 0.72 | 1.7e-01 | Click! |
| hoxb1b | dr11_v1_chr12_+_27141140_27141140 | 0.33 | 5.9e-01 | Click! |
Activity profile of hoxa1a+hoxb1b-1+hoxc1a motif
Sorted Z-values of hoxa1a+hoxb1b-1+hoxc1a motif
| Promoter | Log-likelihood | Transcript | Gene | Gene Info |
|---|---|---|---|---|
| chr9_-_51370293 | 2.41 |
ENSDART00000084806
|
slc4a10b
|
solute carrier family 4, sodium bicarbonate transporter, member 10b |
| chr25_+_7461624 | 1.92 |
ENSDART00000170569
|
syt12
|
synaptotagmin XII |
| chr12_-_25916530 | 1.89 |
ENSDART00000186386
|
sncgb
|
synuclein, gamma b (breast cancer-specific protein 1) |
| chr10_+_466926 | 1.74 |
ENSDART00000145220
|
arvcfa
|
ARVCF, delta catenin family member a |
| chr22_-_600016 | 1.51 |
ENSDART00000086434
|
tmcc2
|
transmembrane and coiled-coil domain family 2 |
| chr11_-_1131569 | 1.51 |
ENSDART00000173228
|
slc6a11b
|
solute carrier family 6 (neurotransmitter transporter), member 11b |
| chr20_-_9462433 | 1.46 |
ENSDART00000152674
ENSDART00000040557 |
zgc:101840
|
zgc:101840 |
| chr7_-_72067475 | 1.44 |
ENSDART00000017763
|
LO018380.1
|
|
| chr14_-_7888748 | 1.41 |
ENSDART00000166293
|
ppp3cb
|
protein phosphatase 3, catalytic subunit, beta isozyme |
| chr23_-_12015139 | 1.21 |
ENSDART00000110627
ENSDART00000193988 ENSDART00000184528 |
si:dkey-178k16.1
|
si:dkey-178k16.1 |
| chr4_+_4816695 | 1.20 |
ENSDART00000136962
|
slc13a4
|
solute carrier family 13 (sodium/sulfate symporter), member 4 |
| chr23_-_11870962 | 1.19 |
ENSDART00000143481
|
si:dkey-178k16.1
|
si:dkey-178k16.1 |
| chr4_+_21129752 | 1.17 |
ENSDART00000169764
|
syt1a
|
synaptotagmin Ia |
| chr22_+_635813 | 1.13 |
ENSDART00000179067
|
CU856139.1
|
|
| chr6_-_29105727 | 1.11 |
ENSDART00000184355
|
fam69ab
|
family with sequence similarity 69, member Ab |
| chr23_-_12014931 | 1.10 |
ENSDART00000134652
|
si:dkey-178k16.1
|
si:dkey-178k16.1 |
| chr15_-_16704417 | 1.08 |
ENSDART00000155163
|
caln1
|
calneuron 1 |
| chr18_+_24919614 | 1.06 |
ENSDART00000008638
|
rgma
|
repulsive guidance molecule family member a |
| chr5_-_55600689 | 1.06 |
ENSDART00000013229
|
gnaq
|
guanine nucleotide binding protein (G protein), q polypeptide |
| chr17_+_8183393 | 1.03 |
ENSDART00000155957
|
tulp4b
|
tubby like protein 4b |
| chr23_+_21067684 | 1.01 |
ENSDART00000132066
|
kcnab2b
|
potassium voltage-gated channel, shaker-related subfamily, beta member 2 b |
| chr10_-_26766780 | 0.98 |
ENSDART00000146666
|
mcf2b
|
MCF.2 cell line derived transforming sequence b |
| chr21_-_43079161 | 0.98 |
ENSDART00000144151
|
jakmip2
|
janus kinase and microtubule interacting protein 2 |
| chr16_-_13730152 | 0.97 |
ENSDART00000138772
|
ttyh1
|
tweety family member 1 |
| chr8_-_22698651 | 0.96 |
ENSDART00000181411
|
iqsec2a
|
IQ motif and Sec7 domain 2a |
| chr13_+_35745572 | 0.94 |
ENSDART00000159690
|
gpr75
|
G protein-coupled receptor 75 |
| chr19_-_45985989 | 0.92 |
ENSDART00000165897
|
si:ch211-153f2.3
|
si:ch211-153f2.3 |
| chr14_+_19258702 | 0.90 |
ENSDART00000187087
ENSDART00000005738 |
slitrk2
|
SLIT and NTRK-like family, member 2 |
| chr3_+_29714775 | 0.88 |
ENSDART00000041388
|
cacng2a
|
calcium channel, voltage-dependent, gamma subunit 2a |
| chr6_-_55585423 | 0.88 |
ENSDART00000157129
|
slc12a5a
|
solute carrier family 12 (potassium/chloride transporter), member 5a |
| chr16_-_31188715 | 0.86 |
ENSDART00000058829
|
scrt1b
|
scratch family zinc finger 1b |
| chr18_-_23875370 | 0.84 |
ENSDART00000130163
|
nr2f2
|
nuclear receptor subfamily 2, group F, member 2 |
| chr19_-_43226124 | 0.83 |
ENSDART00000168965
|
gnrhr1
|
gonadotropin releasing hormone receptor 1 |
| chr9_+_11202552 | 0.83 |
ENSDART00000151931
|
asic4a
|
acid-sensing (proton-gated) ion channel family member 4a |
| chr9_+_34425736 | 0.81 |
ENSDART00000135147
|
si:ch211-218d20.15
|
si:ch211-218d20.15 |
| chr3_+_46628885 | 0.79 |
ENSDART00000006602
|
pde4a
|
phosphodiesterase 4A, cAMP-specific |
| chr2_+_45354747 | 0.79 |
ENSDART00000083957
ENSDART00000135582 ENSDART00000160867 |
camsap2b
|
calmodulin regulated spectrin-associated protein family, member 2b |
| chr18_-_23874929 | 0.79 |
ENSDART00000134910
|
nr2f2
|
nuclear receptor subfamily 2, group F, member 2 |
| chr11_+_30817943 | 0.78 |
ENSDART00000150130
ENSDART00000159997 |
cacna1ab
|
calcium channel, voltage-dependent, P/Q type, alpha 1A subunit, b |
| chr5_+_65492183 | 0.77 |
ENSDART00000162804
|
si:dkey-21e5.1
|
si:dkey-21e5.1 |
| chr6_+_23752593 | 0.76 |
ENSDART00000164366
|
zgc:158654
|
zgc:158654 |
| chr20_+_26349002 | 0.75 |
ENSDART00000152842
|
syne1a
|
spectrin repeat containing, nuclear envelope 1a |
| chr13_-_39736938 | 0.75 |
ENSDART00000141645
|
zgc:171482
|
zgc:171482 |
| chr16_+_46111849 | 0.75 |
ENSDART00000172232
|
sv2a
|
synaptic vesicle glycoprotein 2A |
| chr11_-_1509773 | 0.74 |
ENSDART00000050762
|
phactr3b
|
phosphatase and actin regulator 3b |
| chr23_-_333457 | 0.74 |
ENSDART00000114486
|
uhrf1bp1
|
UHRF1 binding protein 1 |
| chr12_+_41510492 | 0.74 |
ENSDART00000170976
ENSDART00000176164 |
kif5bb
|
kinesin family member 5B, b |
| chr10_-_2527342 | 0.73 |
ENSDART00000184168
|
CU856539.1
|
|
| chr18_-_23875219 | 0.72 |
ENSDART00000059976
|
nr2f2
|
nuclear receptor subfamily 2, group F, member 2 |
| chr17_-_6399920 | 0.72 |
ENSDART00000022010
|
hivep2b
|
human immunodeficiency virus type I enhancer binding protein 2b |
| chr1_+_10221568 | 0.68 |
ENSDART00000152424
|
npy2rl
|
neuropeptide Y receptor Y2, like |
| chr5_-_52277643 | 0.67 |
ENSDART00000010757
|
rgmb
|
repulsive guidance molecule family member b |
| chr16_-_13004166 | 0.67 |
ENSDART00000133735
|
cacng7b
|
calcium channel, voltage-dependent, gamma subunit 7b |
| chr14_+_2478994 | 0.67 |
ENSDART00000170538
|
CU929317.1
|
|
| chr1_+_20069535 | 0.66 |
ENSDART00000088653
|
prss12
|
protease, serine, 12 (neurotrypsin, motopsin) |
| chr17_-_7436766 | 0.66 |
ENSDART00000162002
|
grm1b
|
glutamate receptor, metabotropic 1b |
| chr6_-_13401133 | 0.65 |
ENSDART00000151206
|
fmnl2b
|
formin-like 2b |
| chr15_+_42933236 | 0.65 |
ENSDART00000167763
|
slc8a2b
|
solute carrier family 8 (sodium/calcium exchanger), member 2b |
| chr6_-_31576397 | 0.63 |
ENSDART00000111837
|
raver2
|
ribonucleoprotein, PTB-binding 2 |
| chr25_-_24074500 | 0.63 |
ENSDART00000040410
|
th
|
tyrosine hydroxylase |
| chr17_-_26604549 | 0.63 |
ENSDART00000174773
|
fam149b1
|
family with sequence similarity 149, member B1 |
| chr9_-_23217196 | 0.63 |
ENSDART00000083567
|
kif5c
|
kinesin family member 5C |
| chr20_-_35841570 | 0.62 |
ENSDART00000037855
|
tnfrsf21
|
tumor necrosis factor receptor superfamily, member 21 |
| chr17_-_26604946 | 0.61 |
ENSDART00000087062
|
fam149b1
|
family with sequence similarity 149, member B1 |
| chr25_-_29987839 | 0.61 |
ENSDART00000154088
|
fam19a5b
|
family with sequence similarity 19 (chemokine (C-C motif)-like), member A5b |
| chr12_+_38770654 | 0.59 |
ENSDART00000155367
|
kif19
|
kinesin family member 19 |
| chr6_-_16561536 | 0.59 |
ENSDART00000167295
|
unc80
|
unc-80 homolog (C. elegans) |
| chr24_+_26039464 | 0.58 |
ENSDART00000131017
|
tnk2a
|
tyrosine kinase, non-receptor, 2a |
| chr4_+_11384891 | 0.58 |
ENSDART00000092381
ENSDART00000186577 ENSDART00000191054 ENSDART00000191584 |
pcloa
|
piccolo presynaptic cytomatrix protein a |
| chr20_-_47550577 | 0.57 |
ENSDART00000187361
|
CABZ01053323.1
|
|
| chr2_+_42872661 | 0.56 |
ENSDART00000036979
|
efr3a
|
EFR3 homolog A (S. cerevisiae) |
| chr13_-_36184476 | 0.56 |
ENSDART00000057185
|
map3k9
|
mitogen-activated protein kinase kinase kinase 9 |
| chr4_+_74226447 | 0.55 |
ENSDART00000174336
ENSDART00000191455 ENSDART00000180062 |
ptprr
|
protein tyrosine phosphatase, receptor type, r |
| chr22_-_34937455 | 0.55 |
ENSDART00000169217
ENSDART00000188330 ENSDART00000165142 |
slit1b
|
slit homolog 1b (Drosophila) |
| chr9_+_32073606 | 0.55 |
ENSDART00000184170
ENSDART00000180355 ENSDART00000110204 ENSDART00000123278 |
pikfyve
|
phosphoinositide kinase, FYVE finger containing |
| chr12_+_39685485 | 0.54 |
ENSDART00000163403
|
LO017650.1
|
|
| chr17_-_20394566 | 0.53 |
ENSDART00000154667
|
sorcs3b
|
sortilin related VPS10 domain containing receptor 3b |
| chr5_-_22544151 | 0.53 |
ENSDART00000006474
|
glra4b
|
glycine receptor, alpha 4b |
| chr5_-_31689796 | 0.53 |
ENSDART00000184319
ENSDART00000190229 ENSDART00000186294 ENSDART00000170313 ENSDART00000147065 ENSDART00000134427 ENSDART00000098172 |
sh3glb2b
|
SH3-domain GRB2-like endophilin B2b |
| chr17_+_40684 | 0.53 |
ENSDART00000164231
|
CABZ01111555.1
|
|
| chr8_-_51930826 | 0.52 |
ENSDART00000109785
|
cabin1
|
calcineurin binding protein 1 |
| chr17_-_45009782 | 0.52 |
ENSDART00000123971
|
fam161b
|
family with sequence similarity 161, member B |
| chr5_+_61301525 | 0.52 |
ENSDART00000128773
|
doc2b
|
double C2-like domains, beta |
| chr19_+_4463389 | 0.51 |
ENSDART00000168805
|
kcnk9
|
potassium channel, subfamily K, member 9 |
| chr12_-_33582382 | 0.51 |
ENSDART00000009794
ENSDART00000136617 |
tdrkh
|
tudor and KH domain containing |
| chr21_+_43561650 | 0.50 |
ENSDART00000085071
|
gpr185a
|
G protein-coupled receptor 185 a |
| chr20_-_32446406 | 0.47 |
ENSDART00000026635
|
nr2e1
|
nuclear receptor subfamily 2, group E, member 1 |
| chr3_+_15805917 | 0.47 |
ENSDART00000055834
|
phospho1
|
phosphatase, orphan 1 |
| chr25_+_2668892 | 0.45 |
ENSDART00000122929
|
bbs4
|
Bardet-Biedl syndrome 4 |
| chr18_+_24922125 | 0.45 |
ENSDART00000180385
|
rgma
|
repulsive guidance molecule family member a |
| chr11_-_21528056 | 0.45 |
ENSDART00000181626
|
srgap2
|
SLIT-ROBO Rho GTPase activating protein 2 |
| chr10_+_39692241 | 0.44 |
ENSDART00000113414
|
kirrel3a
|
kirre like nephrin family adhesion molecule 3a |
| chr16_+_14707960 | 0.44 |
ENSDART00000137912
|
col14a1a
|
collagen, type XIV, alpha 1a |
| chr10_-_31175744 | 0.43 |
ENSDART00000191728
|
pknox2
|
pbx/knotted 1 homeobox 2 |
| chr17_+_51764310 | 0.42 |
ENSDART00000157171
|
si:ch211-168d23.3
|
si:ch211-168d23.3 |
| chr17_+_19626479 | 0.42 |
ENSDART00000044993
ENSDART00000131863 |
rgs7a
|
regulator of G protein signaling 7a |
| chr16_+_19033554 | 0.42 |
ENSDART00000182430
|
rapgef5b
|
Rap guanine nucleotide exchange factor (GEF) 5b |
| chr25_+_336503 | 0.41 |
ENSDART00000160395
|
CU929262.1
|
|
| chr7_+_13464878 | 0.41 |
ENSDART00000172969
|
dagla
|
diacylglycerol lipase, alpha |
| chr11_+_33628104 | 0.41 |
ENSDART00000165318
|
thsd7bb
|
thrombospondin, type I, domain containing 7Bb |
| chr3_-_55650771 | 0.40 |
ENSDART00000162413
|
axin2
|
axin 2 (conductin, axil) |
| chr4_-_9191220 | 0.40 |
ENSDART00000156919
|
hcfc2
|
host cell factor C2 |
| chr7_+_31074636 | 0.40 |
ENSDART00000173805
|
tjp1a
|
tight junction protein 1a |
| chr3_+_37824268 | 0.39 |
ENSDART00000137038
|
asic2
|
acid-sensing (proton-gated) ion channel 2 |
| chr8_-_44015210 | 0.36 |
ENSDART00000186879
ENSDART00000188965 ENSDART00000001313 ENSDART00000188902 ENSDART00000185935 ENSDART00000147869 |
rimbp2
rimbp2
|
RIMS binding protein 2 RIMS binding protein 2 |
| chr8_-_40464935 | 0.36 |
ENSDART00000040013
|
myl7
|
myosin, light chain 7, regulatory |
| chr14_+_34547554 | 0.35 |
ENSDART00000074819
|
gabrp
|
gamma-aminobutyric acid (GABA) A receptor, pi |
| chr24_+_27548474 | 0.35 |
ENSDART00000105774
ENSDART00000123368 |
ek1
|
eph-like kinase 1 |
| chr8_+_6410933 | 0.34 |
ENSDART00000168789
|
lrrtm4l2
|
leucine rich repeat transmembrane neuronal 4 like 2 |
| chr6_+_2174082 | 0.34 |
ENSDART00000073936
|
acvr1bb
|
activin A receptor type 1Bb |
| chr9_-_48296469 | 0.34 |
ENSDART00000058255
|
bbs5
|
Bardet-Biedl syndrome 5 |
| chr21_+_30194904 | 0.34 |
ENSDART00000137023
ENSDART00000078403 |
BRD8
|
si:ch211-59d17.3 |
| chr5_+_31959954 | 0.34 |
ENSDART00000142826
|
myo1hb
|
myosin IHb |
| chr14_+_24215046 | 0.34 |
ENSDART00000079215
|
stc2a
|
stanniocalcin 2a |
| chr7_+_7151832 | 0.32 |
ENSDART00000109485
|
gal3st3
|
galactose-3-O-sulfotransferase 3 |
| chr3_-_55650417 | 0.32 |
ENSDART00000171441
|
axin2
|
axin 2 (conductin, axil) |
| chr2_-_45630823 | 0.32 |
ENSDART00000183553
|
CR450720.1
|
|
| chr3_-_214709 | 0.31 |
ENSDART00000098311
|
CABZ01079818.1
|
|
| chr10_-_27741793 | 0.31 |
ENSDART00000129369
ENSDART00000192440 ENSDART00000189808 ENSDART00000138149 |
auts2a
si:dkey-33o22.1
|
autism susceptibility candidate 2a si:dkey-33o22.1 |
| chr5_-_16791223 | 0.30 |
ENSDART00000192744
|
atad1a
|
ATPase family, AAA domain containing 1a |
| chr20_+_29587995 | 0.30 |
ENSDART00000153339
|
adam17b
|
ADAM metallopeptidase domain 17b |
| chr24_+_30521619 | 0.29 |
ENSDART00000162903
|
dpyda.3
|
dihydropyrimidine dehydrogenase a, tandem duplicate 3 |
| chr7_+_16835218 | 0.28 |
ENSDART00000173580
|
nav2a
|
neuron navigator 2a |
| chr17_-_53282539 | 0.28 |
ENSDART00000164953
|
FO704905.1
|
|
| chr15_-_25099679 | 0.28 |
ENSDART00000154628
|
rflnb
|
refilin B |
| chr3_-_6417328 | 0.28 |
ENSDART00000160979
|
jpt1b
|
Jupiter microtubule associated homolog 1b |
| chr2_-_31754292 | 0.28 |
ENSDART00000192498
|
ralyl
|
RALY RNA binding protein like |
| chr17_+_31914877 | 0.28 |
ENSDART00000177801
|
FAM196A (1 of many)
|
family with sequence similarity 196 member A |
| chr25_-_36827491 | 0.27 |
ENSDART00000170941
|
CU929365.1
|
|
| chr17_+_45009868 | 0.27 |
ENSDART00000085009
|
coq6
|
coenzyme Q6 monooxygenase |
| chr24_+_119680 | 0.27 |
ENSDART00000061973
|
tgfbr1b
|
transforming growth factor, beta receptor 1 b |
| chr1_-_14258409 | 0.25 |
ENSDART00000079359
|
pde5aa
|
phosphodiesterase 5A, cGMP-specific, a |
| chr23_+_27782071 | 0.25 |
ENSDART00000131379
|
kmt2d
|
lysine (K)-specific methyltransferase 2D |
| chr15_-_33304133 | 0.25 |
ENSDART00000186092
|
nbeab
|
neurobeachin b |
| chr18_-_18875308 | 0.25 |
ENSDART00000127182
|
arl2bp
|
ADP-ribosylation factor-like 2 binding protein |
| chr4_-_14926637 | 0.24 |
ENSDART00000110199
|
prdm4
|
PR domain containing 4 |
| chr6_+_19383267 | 0.23 |
ENSDART00000166549
|
mchr1a
|
melanin-concentrating hormone receptor 1a |
| chr6_-_14038804 | 0.23 |
ENSDART00000184606
ENSDART00000184609 |
etv5b
|
ets variant 5b |
| chr18_-_16392448 | 0.21 |
ENSDART00000180253
|
mgat4c
|
mgat4 family, member C |
| chr14_-_24101897 | 0.21 |
ENSDART00000143695
|
cpeb4a
|
cytoplasmic polyadenylation element binding protein 4a |
| chr3_+_40409100 | 0.21 |
ENSDART00000103486
|
tnrc18
|
trinucleotide repeat containing 18 |
| chr2_-_16217344 | 0.20 |
ENSDART00000152031
|
arhgef4
|
Rho guanine nucleotide exchange factor (GEF) 4 |
| chr3_-_21118969 | 0.20 |
ENSDART00000129016
|
maza
|
MYC-associated zinc finger protein a (purine-binding transcription factor) |
| chr17_-_28097760 | 0.19 |
ENSDART00000149861
|
kdm1a
|
lysine (K)-specific demethylase 1a |
| chr4_-_71983381 | 0.19 |
ENSDART00000169130
|
ftr64
|
finTRIM family, member 64 |
| chr3_+_18846488 | 0.18 |
ENSDART00000148133
|
tmem104
|
transmembrane protein 104 |
| chr3_-_1283247 | 0.18 |
ENSDART00000149814
|
tcf20
|
transcription factor 20 |
| chr1_-_10577945 | 0.18 |
ENSDART00000179237
ENSDART00000040502 ENSDART00000186876 |
trpc5a
|
transient receptor potential cation channel, subfamily C, member 5a |
| chr22_+_35089031 | 0.16 |
ENSDART00000076040
|
srfa
|
serum response factor a |
| chr22_-_15602760 | 0.16 |
ENSDART00000009054
|
tpm4a
|
tropomyosin 4a |
| chr16_+_46869010 | 0.16 |
ENSDART00000153619
|
thsd7ab
|
thrombospondin, type I, domain containing 7Ab |
| chr23_+_40951443 | 0.16 |
ENSDART00000115161
|
reps2
|
RALBP1 associated Eps domain containing 2 |
| chr4_-_17642168 | 0.14 |
ENSDART00000007030
|
klhl42
|
kelch-like family, member 42 |
| chr17_+_8754020 | 0.14 |
ENSDART00000105322
|
edrf1
|
erythroid differentiation regulatory factor 1 |
| chr17_-_7060477 | 0.13 |
ENSDART00000081797
|
sash1b
|
SAM and SH3 domain containing 1b |
| chr19_+_13994563 | 0.12 |
ENSDART00000164696
|
tmem222b
|
transmembrane protein 222b |
| chr21_-_26495700 | 0.12 |
ENSDART00000109379
|
cd248b
|
CD248 molecule, endosialin b |
| chr18_-_18874921 | 0.12 |
ENSDART00000193332
|
arl2bp
|
ADP-ribosylation factor-like 2 binding protein |
| chr3_-_49925313 | 0.11 |
ENSDART00000164361
|
gcgra
|
glucagon receptor a |
| chr22_+_3232925 | 0.10 |
ENSDART00000166754
|
CU929402.1
|
|
| chr22_-_15602593 | 0.10 |
ENSDART00000036075
|
tpm4a
|
tropomyosin 4a |
| chr22_+_10676981 | 0.10 |
ENSDART00000138016
|
hyal2b
|
hyaluronoglucosaminidase 2b |
| chr10_+_42589391 | 0.08 |
ENSDART00000067689
ENSDART00000075259 |
fgfr1b
|
fibroblast growth factor receptor 1b |
| chr25_+_20215964 | 0.08 |
ENSDART00000139235
|
tnnt2d
|
troponin T2d, cardiac |
| chr4_-_13255700 | 0.05 |
ENSDART00000162277
ENSDART00000026593 |
grip1
|
glutamate receptor interacting protein 1 |
| chr12_+_48581588 | 0.04 |
ENSDART00000114996
|
CABZ01078415.1
|
|
| chr6_+_4255319 | 0.04 |
ENSDART00000170351
|
nbeal1
|
neurobeachin-like 1 |
| chr13_-_11679486 | 0.02 |
ENSDART00000108694
|
si:ch211-195e19.1
|
si:ch211-195e19.1 |
| chr9_-_12652984 | 0.02 |
ENSDART00000052256
|
sumo3b
|
small ubiquitin-like modifier 3b |
| chr22_+_21398508 | 0.02 |
ENSDART00000089408
ENSDART00000186091 |
shdb
|
Src homology 2 domain containing transforming protein D, b |
| chr17_-_19626357 | 0.02 |
ENSDART00000011432
|
reep3a
|
receptor accessory protein 3a |
| chr8_+_18830759 | 0.00 |
ENSDART00000089079
|
mpnd
|
MPN domain containing |
| chr20_-_53624645 | 0.00 |
ENSDART00000083427
ENSDART00000152920 |
slc25a29
|
solute carrier family 25 (mitochondrial carnitine/acylcarnitine carrier), member 29 |
| chr17_+_8754426 | 0.00 |
ENSDART00000185519
|
edrf1
|
erythroid differentiation regulatory factor 1 |
Network of associatons between targets according to the STRING database.

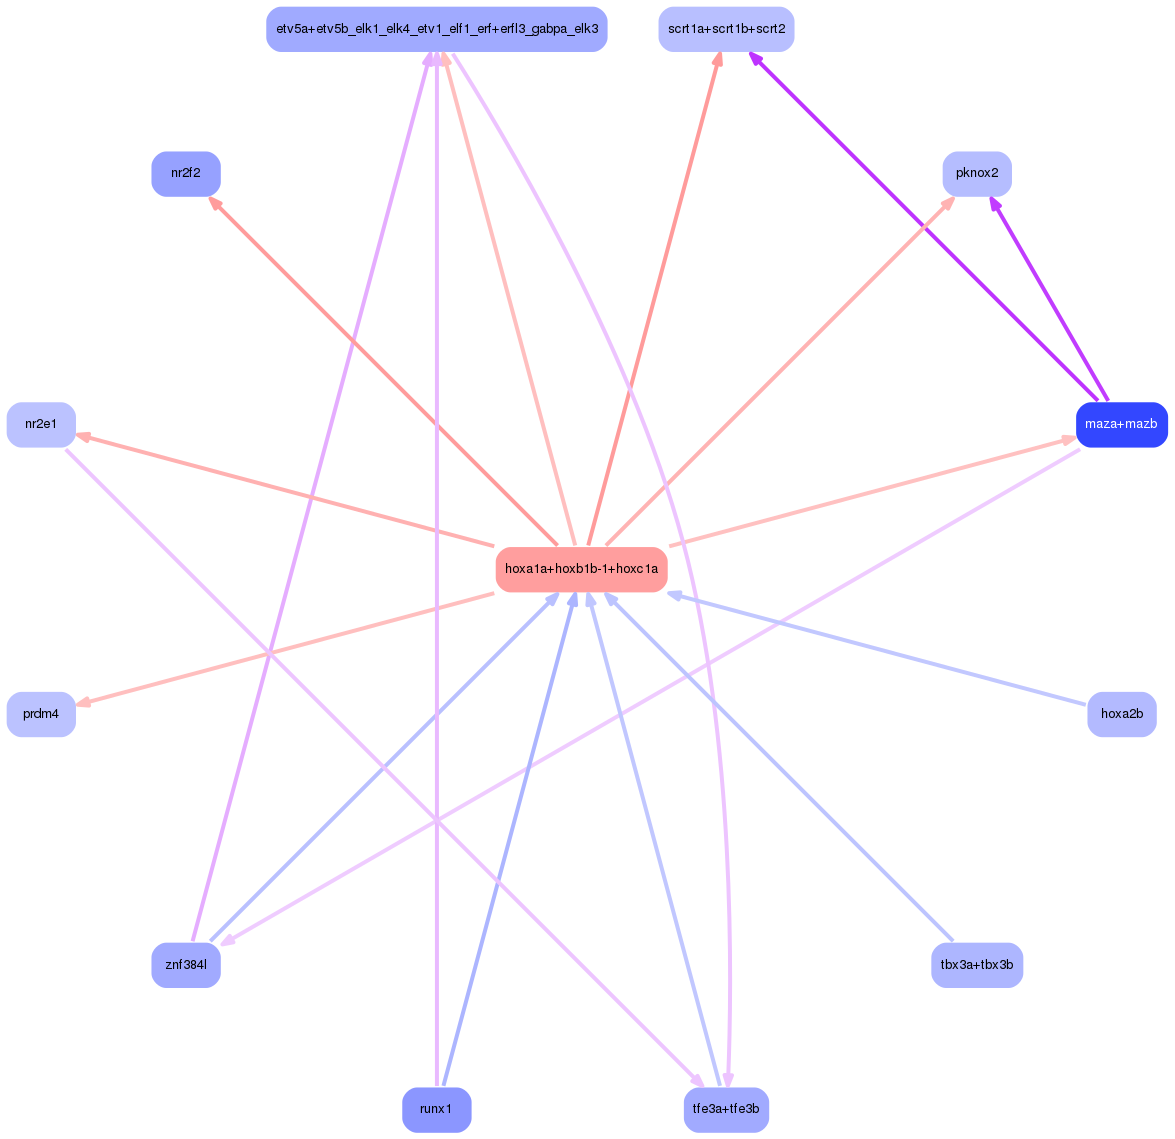
First level regulatory network of hoxa1a+hoxb1b-1+hoxc1a
Gene Ontology Analysis
Gene overrepresentation in biological process category:
| Log-likelihood per target | Total log-likelihood | Term | Description |
|---|---|---|---|
| 0.8 | 2.3 | GO:0060838 | lymphatic endothelial cell fate commitment(GO:0060838) venous endothelial cell differentiation(GO:0060843) venous endothelial cell fate commitment(GO:0060845) |
| 0.3 | 1.5 | GO:0031293 | membrane protein intracellular domain proteolysis(GO:0031293) |
| 0.2 | 0.6 | GO:0042416 | dopamine biosynthetic process from tyrosine(GO:0006585) dopamine biosynthetic process(GO:0042416) |
| 0.2 | 0.6 | GO:0031645 | negative regulation of myelination(GO:0031642) negative regulation of neurological system process(GO:0031645) |
| 0.2 | 1.0 | GO:0051969 | regulation of transmission of nerve impulse(GO:0051969) |
| 0.1 | 2.4 | GO:0015701 | bicarbonate transport(GO:0015701) |
| 0.1 | 0.5 | GO:0061469 | regulation of type B pancreatic cell proliferation(GO:0061469) |
| 0.1 | 0.4 | GO:0098920 | endocannabinoid signaling pathway(GO:0071926) retrograde trans-synaptic signaling by lipid(GO:0098920) retrograde trans-synaptic signaling by endocannabinoid(GO:0098921) |
| 0.1 | 0.3 | GO:0061037 | negative regulation of chondrocyte differentiation(GO:0032331) negative regulation of cartilage development(GO:0061037) negative regulation of chondrocyte development(GO:0061182) regulation of bone mineralization involved in bone maturation(GO:1900157) negative regulation of bone mineralization involved in bone maturation(GO:1900158) negative regulation of bone development(GO:1903011) |
| 0.1 | 1.4 | GO:0033173 | calcineurin-NFAT signaling cascade(GO:0033173) |
| 0.1 | 1.6 | GO:0098943 | neurotransmitter receptor transport, postsynaptic endosome to lysosome(GO:0098943) |
| 0.1 | 0.6 | GO:0098971 | dendritic transport(GO:0098935) anterograde dendritic transport(GO:0098937) anterograde dendritic transport of neurotransmitter receptor complex(GO:0098971) |
| 0.1 | 0.4 | GO:2001223 | negative regulation of neuron migration(GO:2001223) |
| 0.1 | 0.3 | GO:0072116 | kidney rudiment formation(GO:0072003) pronephros formation(GO:0072116) |
| 0.1 | 1.7 | GO:0048791 | calcium ion-regulated exocytosis of neurotransmitter(GO:0048791) |
| 0.1 | 1.9 | GO:0071542 | dopaminergic neuron differentiation(GO:0071542) |
| 0.1 | 1.9 | GO:0060291 | long-term synaptic potentiation(GO:0060291) |
| 0.1 | 0.8 | GO:0007026 | negative regulation of microtubule depolymerization(GO:0007026) negative regulation of microtubule polymerization or depolymerization(GO:0031111) |
| 0.1 | 4.2 | GO:0030866 | cortical actin cytoskeleton organization(GO:0030866) |
| 0.1 | 0.4 | GO:0055014 | ventricular cardiac myofibril assembly(GO:0055005) atrial cardiac muscle cell development(GO:0055014) |
| 0.1 | 1.0 | GO:0042982 | amyloid precursor protein metabolic process(GO:0042982) |
| 0.1 | 0.6 | GO:1904071 | presynaptic active zone assembly(GO:1904071) |
| 0.1 | 0.3 | GO:0019860 | uracil catabolic process(GO:0006212) beta-alanine metabolic process(GO:0019482) beta-alanine biosynthetic process(GO:0019483) uracil metabolic process(GO:0019860) 'de novo' UMP biosynthetic process(GO:0044205) |
| 0.1 | 0.7 | GO:2000054 | negative regulation of Wnt signaling pathway involved in dorsal/ventral axis specification(GO:2000054) |
| 0.1 | 0.9 | GO:0055075 | potassium ion homeostasis(GO:0055075) |
| 0.1 | 1.1 | GO:0007274 | neuromuscular synaptic transmission(GO:0007274) |
| 0.0 | 1.7 | GO:0016339 | calcium-dependent cell-cell adhesion via plasma membrane cell adhesion molecules(GO:0016339) |
| 0.0 | 0.5 | GO:0006336 | DNA replication-independent nucleosome assembly(GO:0006336) |
| 0.0 | 0.8 | GO:0006198 | cAMP catabolic process(GO:0006198) |
| 0.0 | 0.4 | GO:0036058 | filtration diaphragm assembly(GO:0036058) slit diaphragm assembly(GO:0036060) |
| 0.0 | 0.5 | GO:0060012 | synaptic transmission, glycinergic(GO:0060012) |
| 0.0 | 0.7 | GO:1990035 | calcium ion import across plasma membrane(GO:0098703) calcium ion import into cell(GO:1990035) |
| 0.0 | 0.3 | GO:0003422 | growth plate cartilage morphogenesis(GO:0003422) chondrocyte intercalation involved in growth plate cartilage morphogenesis(GO:0003428) |
| 0.0 | 0.2 | GO:0002931 | response to ischemia(GO:0002931) |
| 0.0 | 0.6 | GO:0043507 | activation of JUN kinase activity(GO:0007257) positive regulation of JUN kinase activity(GO:0043507) |
| 0.0 | 0.3 | GO:0051893 | cell-substrate adherens junction assembly(GO:0007045) focal adhesion assembly(GO:0048041) regulation of focal adhesion assembly(GO:0051893) regulation of cell-substrate junction assembly(GO:0090109) |
| 0.0 | 0.4 | GO:0072595 | positive regulation of tyrosine phosphorylation of STAT protein(GO:0042531) maintenance of protein localization in organelle(GO:0072595) |
| 0.0 | 0.2 | GO:0034720 | histone H3-K4 demethylation(GO:0034720) |
| 0.0 | 1.1 | GO:0001508 | action potential(GO:0001508) |
| 0.0 | 0.7 | GO:0060349 | bone morphogenesis(GO:0060349) |
| 0.0 | 0.7 | GO:0007216 | G-protein coupled glutamate receptor signaling pathway(GO:0007216) |
| 0.0 | 1.0 | GO:0032011 | ARF protein signal transduction(GO:0032011) regulation of ARF protein signal transduction(GO:0032012) |
| 0.0 | 0.2 | GO:0021979 | hypothalamus cell differentiation(GO:0021979) |
| 0.0 | 0.3 | GO:0021884 | forebrain neuron development(GO:0021884) |
| 0.0 | 0.5 | GO:0030322 | stabilization of membrane potential(GO:0030322) |
| 0.0 | 3.5 | GO:0006814 | sodium ion transport(GO:0006814) |
| 0.0 | 0.5 | GO:0021602 | cranial nerve morphogenesis(GO:0021602) |
| 0.0 | 0.4 | GO:0070831 | basement membrane assembly(GO:0070831) |
| 0.0 | 0.3 | GO:0055003 | cardiac myofibril assembly(GO:0055003) |
| 0.0 | 0.3 | GO:1901663 | ubiquinone metabolic process(GO:0006743) ubiquinone biosynthetic process(GO:0006744) quinone biosynthetic process(GO:1901663) |
| 0.0 | 0.6 | GO:0032924 | activin receptor signaling pathway(GO:0032924) |
| 0.0 | 0.3 | GO:0006509 | membrane protein ectodomain proteolysis(GO:0006509) |
| 0.0 | 0.7 | GO:0031638 | zymogen activation(GO:0031638) |
Gene overrepresentation in cellular component category:
| Log-likelihood per target | Total log-likelihood | Term | Description |
|---|---|---|---|
| 0.2 | 1.4 | GO:0005955 | calcineurin complex(GO:0005955) |
| 0.2 | 1.2 | GO:0042584 | chromaffin granule membrane(GO:0042584) |
| 0.1 | 1.0 | GO:0005790 | smooth endoplasmic reticulum(GO:0005790) |
| 0.1 | 0.7 | GO:0043083 | synaptic cleft(GO:0043083) |
| 0.1 | 2.2 | GO:0046658 | anchored component of plasma membrane(GO:0046658) |
| 0.1 | 0.8 | GO:0036449 | microtubule minus-end(GO:0036449) |
| 0.1 | 1.0 | GO:0044224 | juxtaparanode region of axon(GO:0044224) |
| 0.1 | 0.6 | GO:0098982 | GABA-ergic synapse(GO:0098982) |
| 0.1 | 1.9 | GO:0043679 | axon terminus(GO:0043679) |
| 0.1 | 0.4 | GO:0005614 | interstitial matrix(GO:0005614) |
| 0.0 | 0.6 | GO:0048179 | activin receptor complex(GO:0048179) |
| 0.0 | 2.2 | GO:0099634 | postsynaptic density membrane(GO:0098839) postsynaptic specialization membrane(GO:0099634) |
| 0.0 | 0.3 | GO:0034464 | BBSome(GO:0034464) |
| 0.0 | 0.8 | GO:0005640 | nuclear outer membrane(GO:0005640) |
| 0.0 | 0.3 | GO:0031314 | extrinsic component of mitochondrial inner membrane(GO:0031314) |
| 0.0 | 2.4 | GO:0016323 | basolateral plasma membrane(GO:0016323) |
| 0.0 | 0.4 | GO:0044327 | dendritic spine head(GO:0044327) phagocytic vesicle(GO:0045335) |
| 0.0 | 1.1 | GO:0005834 | heterotrimeric G-protein complex(GO:0005834) |
| 0.0 | 0.6 | GO:0043204 | perikaryon(GO:0043204) |
| 0.0 | 0.9 | GO:0034707 | chloride channel complex(GO:0034707) |
| 0.0 | 1.2 | GO:0005871 | kinesin complex(GO:0005871) |
| 0.0 | 0.3 | GO:0044666 | MLL3/4 complex(GO:0044666) |
| 0.0 | 0.2 | GO:1990124 | messenger ribonucleoprotein complex(GO:1990124) |
| 0.0 | 2.7 | GO:0070382 | exocytic vesicle(GO:0070382) |
| 0.0 | 0.8 | GO:0005891 | voltage-gated calcium channel complex(GO:0005891) |
| 0.0 | 0.3 | GO:0044665 | MLL1/2 complex(GO:0044665) MLL1 complex(GO:0071339) |
| 0.0 | 0.4 | GO:0016514 | SWI/SNF complex(GO:0016514) |
Gene overrepresentation in molecular function category:
| Log-likelihood per target | Total log-likelihood | Term | Description |
|---|---|---|---|
| 0.6 | 1.9 | GO:1903136 | cuprous ion binding(GO:1903136) |
| 0.3 | 2.3 | GO:0001972 | retinoic acid binding(GO:0001972) |
| 0.2 | 1.4 | GO:0033192 | calcium-dependent protein serine/threonine phosphatase activity(GO:0004723) calmodulin-dependent protein phosphatase activity(GO:0033192) |
| 0.2 | 0.8 | GO:0004968 | gonadotropin-releasing hormone receptor activity(GO:0004968) |
| 0.2 | 2.4 | GO:0008510 | sodium:bicarbonate symporter activity(GO:0008510) |
| 0.1 | 1.1 | GO:0031826 | type 2A serotonin receptor binding(GO:0031826) |
| 0.1 | 1.5 | GO:0005332 | gamma-aminobutyric acid:sodium symporter activity(GO:0005332) |
| 0.1 | 2.2 | GO:0015026 | coreceptor activity(GO:0015026) |
| 0.1 | 1.0 | GO:0072320 | volume-sensitive chloride channel activity(GO:0072320) |
| 0.1 | 0.6 | GO:0016361 | activin receptor activity, type I(GO:0016361) |
| 0.1 | 1.2 | GO:0015280 | ligand-gated sodium channel activity(GO:0015280) |
| 0.1 | 0.7 | GO:0099530 | G-protein coupled receptor activity involved in regulation of postsynaptic membrane potential(GO:0099530) |
| 0.1 | 0.2 | GO:0030273 | melanin-concentrating hormone receptor activity(GO:0030273) |
| 0.1 | 0.3 | GO:0016635 | oxidoreductase activity, acting on the CH-CH group of donors, quinone or related compound as acceptor(GO:0016635) |
| 0.1 | 0.3 | GO:0031005 | filamin binding(GO:0031005) |
| 0.1 | 0.6 | GO:0016714 | oxidoreductase activity, acting on paired donors, with incorporation or reduction of molecular oxygen, reduced pteridine as one donor, and incorporation of one atom of oxygen(GO:0016714) |
| 0.1 | 3.1 | GO:0001786 | phosphatidylserine binding(GO:0001786) |
| 0.1 | 0.2 | GO:1990226 | histone methyltransferase binding(GO:1990226) |
| 0.1 | 0.6 | GO:0004706 | JUN kinase kinase kinase activity(GO:0004706) |
| 0.1 | 0.8 | GO:0030507 | spectrin binding(GO:0030507) |
| 0.1 | 0.5 | GO:0016933 | extracellular-glycine-gated ion channel activity(GO:0016933) extracellular-glycine-gated chloride channel activity(GO:0016934) |
| 0.1 | 1.0 | GO:0004033 | aldo-keto reductase (NADP) activity(GO:0004033) |
| 0.1 | 0.7 | GO:0005432 | calcium:sodium antiporter activity(GO:0005432) |
| 0.0 | 0.1 | GO:1990430 | extracellular matrix protein binding(GO:1990430) |
| 0.0 | 0.7 | GO:0004983 | neuropeptide Y receptor activity(GO:0004983) |
| 0.0 | 0.4 | GO:0004465 | lipoprotein lipase activity(GO:0004465) |
| 0.0 | 1.2 | GO:0008574 | ATP-dependent microtubule motor activity, plus-end-directed(GO:0008574) |
| 0.0 | 0.3 | GO:0001733 | galactosylceramide sulfotransferase activity(GO:0001733) galactose 3-O-sulfotransferase activity(GO:0050694) |
| 0.0 | 0.8 | GO:0004115 | 3',5'-cyclic-AMP phosphodiesterase activity(GO:0004115) |
| 0.0 | 0.6 | GO:0098882 | structural constituent of presynaptic active zone(GO:0098882) |
| 0.0 | 0.2 | GO:0034648 | histone demethylase activity (H3-dimethyl-K4 specific)(GO:0034648) |
| 0.0 | 2.3 | GO:0005245 | voltage-gated calcium channel activity(GO:0005245) |
| 0.0 | 0.9 | GO:0016493 | C-C chemokine receptor activity(GO:0016493) |
| 0.0 | 0.1 | GO:0033906 | hyaluronoglucuronidase activity(GO:0033906) |
| 0.0 | 0.1 | GO:0016519 | gastric inhibitory peptide receptor activity(GO:0016519) |
| 0.0 | 0.7 | GO:0008157 | protein phosphatase 1 binding(GO:0008157) |
| 0.0 | 0.3 | GO:0005005 | transmembrane-ephrin receptor activity(GO:0005005) |
| 0.0 | 0.5 | GO:0022842 | leak channel activity(GO:0022840) potassium ion leak channel activity(GO:0022841) narrow pore channel activity(GO:0022842) |
| 0.0 | 0.3 | GO:0047555 | 3',5'-cyclic-GMP phosphodiesterase activity(GO:0047555) |
| 0.0 | 0.5 | GO:0015377 | cation:chloride symporter activity(GO:0015377) potassium:chloride symporter activity(GO:0015379) |
| 0.0 | 0.4 | GO:0031267 | small GTPase binding(GO:0031267) |
| 0.0 | 1.7 | GO:0045296 | cadherin binding(GO:0045296) |
| 0.0 | 0.5 | GO:0016307 | phosphatidylinositol phosphate kinase activity(GO:0016307) |
| 0.0 | 0.6 | GO:0004712 | protein serine/threonine/tyrosine kinase activity(GO:0004712) |
| 0.0 | 0.2 | GO:0000900 | translation repressor activity, nucleic acid binding(GO:0000900) |
| 0.0 | 0.3 | GO:0042800 | histone methyltransferase activity (H3-K4 specific)(GO:0042800) |
| 0.0 | 0.5 | GO:0031491 | nucleosome binding(GO:0031491) |
| 0.0 | 0.3 | GO:0032266 | phosphatidylinositol-3-phosphate binding(GO:0032266) |
| 0.0 | 0.4 | GO:0004890 | GABA-A receptor activity(GO:0004890) |
| 0.0 | 0.7 | GO:0005044 | scavenger receptor activity(GO:0005044) |
Gene overrepresentation in curated gene sets: canonical pathways category:
| Log-likelihood per target | Total log-likelihood | Term | Description |
|---|---|---|---|
| 0.2 | 1.1 | ST PAC1 RECEPTOR PATHWAY | PAC1 Receptor Pathway |
| 0.1 | 1.9 | PID TCR CALCIUM PATHWAY | Calcium signaling in the CD4+ TCR pathway |
| 0.1 | 2.3 | PID HNF3A PATHWAY | FOXA1 transcription factor network |
| 0.1 | 2.2 | PID BMP PATHWAY | BMP receptor signaling |
| 0.0 | 0.6 | PID P38 MK2 PATHWAY | p38 signaling mediated by MAPKAP kinases |
| 0.0 | 0.7 | PID BETA CATENIN DEG PATHWAY | Degradation of beta catenin |
| 0.0 | 0.4 | PID NCADHERIN PATHWAY | N-cadherin signaling events |
| 0.0 | 0.6 | ST JNK MAPK PATHWAY | JNK MAPK Pathway |
Gene overrepresentation in curated gene sets: REACTOME pathways category:
| Log-likelihood per target | Total log-likelihood | Term | Description |
|---|---|---|---|
| 0.1 | 1.1 | REACTOME REGULATION OF INSULIN SECRETION BY ACETYLCHOLINE | Genes involved in Regulation of Insulin Secretion by Acetylcholine |
| 0.1 | 0.5 | REACTOME TANDEM PORE DOMAIN POTASSIUM CHANNELS | Genes involved in Tandem pore domain potassium channels |
| 0.1 | 1.4 | REACTOME DARPP 32 EVENTS | Genes involved in DARPP-32 events |
| 0.1 | 2.2 | REACTOME NETRIN1 SIGNALING | Genes involved in Netrin-1 signaling |
| 0.1 | 0.6 | REACTOME AMINE DERIVED HORMONES | Genes involved in Amine-derived hormones |
| 0.0 | 0.5 | REACTOME SYNTHESIS OF PIPS AT THE LATE ENDOSOME MEMBRANE | Genes involved in Synthesis of PIPs at the late endosome membrane |
| 0.0 | 0.5 | REACTOME SYNTHESIS OF PE | Genes involved in Synthesis of PE |
| 0.0 | 2.3 | REACTOME TRANSCRIPTIONAL REGULATION OF WHITE ADIPOCYTE DIFFERENTIATION | Genes involved in Transcriptional Regulation of White Adipocyte Differentiation |
| 0.0 | 0.2 | REACTOME P75 NTR RECEPTOR MEDIATED SIGNALLING | Genes involved in p75 NTR receptor-mediated signalling |
| 0.0 | 0.4 | REACTOME EFFECTS OF PIP2 HYDROLYSIS | Genes involved in Effects of PIP2 hydrolysis |
| 0.0 | 0.6 | REACTOME PPARA ACTIVATES GENE EXPRESSION | Genes involved in PPARA Activates Gene Expression |
| 0.0 | 0.4 | REACTOME SIGNALING BY ROBO RECEPTOR | Genes involved in Signaling by Robo receptor |
| 0.0 | 0.5 | REACTOME NUCLEAR RECEPTOR TRANSCRIPTION PATHWAY | Genes involved in Nuclear Receptor transcription pathway |