Project
PRJNA207719: Tissue specific transcriptome profiling
Navigation
Downloads
Results for foxf1+foxf2a+foxf2b
Z-value: 0.80
Motif logo
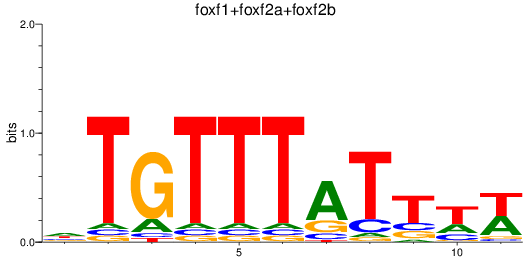
Transcription factors associated with foxf1+foxf2a+foxf2b
| Gene Symbol | Gene ID | Gene Info |
|---|---|---|
|
foxf1
|
ENSDARG00000015399 | forkhead box F1 |
|
foxf2a
|
ENSDARG00000017195 | forkhead box F2a |
|
foxf2b
|
ENSDARG00000070389 | forkhead box F2b |
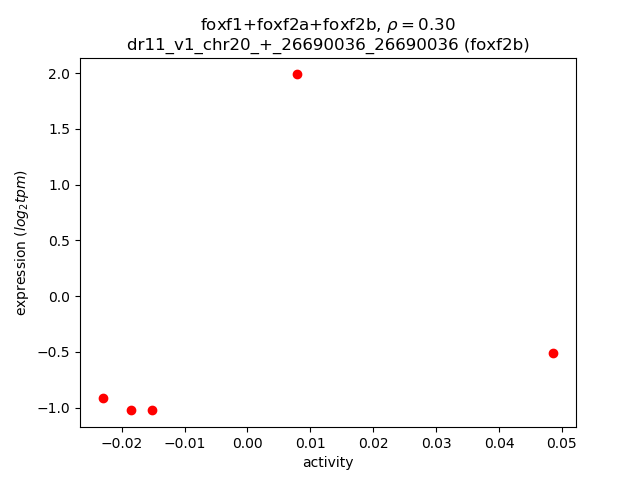
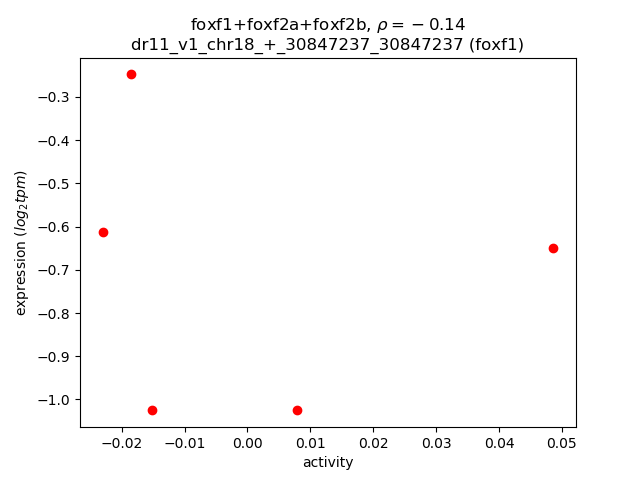
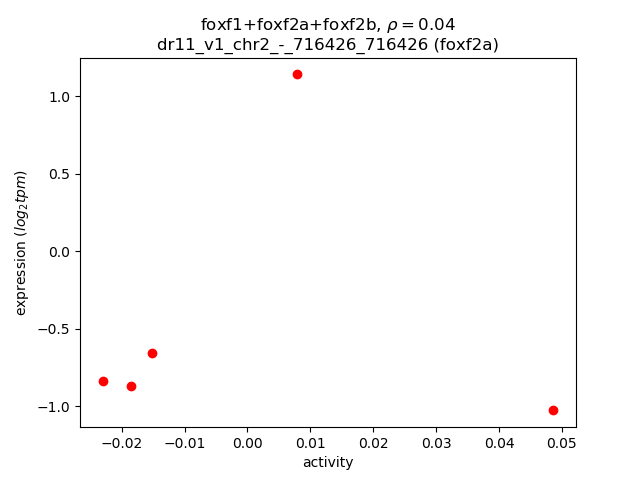
Activity-expression correlation:
| Gene | Promoter | Pearson corr. coef. | P-value | Plot |
|---|---|---|---|---|
| foxf2b | dr11_v1_chr20_+_26690036_26690036 | 0.30 | 6.2e-01 | Click! |
| foxf1 | dr11_v1_chr18_+_30847237_30847237 | -0.14 | 8.2e-01 | Click! |
| foxf2a | dr11_v1_chr2_-_716426_716426 | 0.04 | 9.5e-01 | Click! |
Activity profile of foxf1+foxf2a+foxf2b motif
Sorted Z-values of foxf1+foxf2a+foxf2b motif
| Promoter | Log-likelihood | Transcript | Gene | Gene Info |
|---|---|---|---|---|
| chr25_+_31276842 | 0.58 |
ENSDART00000187238
|
tnni2a.4
|
troponin I type 2a (skeletal, fast), tandem duplicate 4 |
| chr5_+_32222303 | 0.51 |
ENSDART00000051362
|
myhc4
|
myosin heavy chain 4 |
| chr12_-_17712393 | 0.47 |
ENSDART00000143534
ENSDART00000010144 |
pvalb2
|
parvalbumin 2 |
| chr10_+_36650222 | 0.39 |
ENSDART00000126963
|
ucp3
|
uncoupling protein 3 |
| chr5_+_37837245 | 0.38 |
ENSDART00000171617
|
epd
|
ependymin |
| chr25_+_31277415 | 0.38 |
ENSDART00000036275
|
tnni2a.4
|
troponin I type 2a (skeletal, fast), tandem duplicate 4 |
| chr14_+_51098036 | 0.37 |
ENSDART00000184118
|
CABZ01078594.1
|
|
| chr15_-_20933574 | 0.37 |
ENSDART00000152648
ENSDART00000152448 ENSDART00000152244 |
usp2a
|
ubiquitin specific peptidase 2a |
| chr1_+_41849152 | 0.34 |
ENSDART00000053685
|
smox
|
spermine oxidase |
| chr25_+_29160102 | 0.33 |
ENSDART00000162854
|
pkmb
|
pyruvate kinase M1/2b |
| chr13_+_38430466 | 0.31 |
ENSDART00000132691
|
adgrb3
|
adhesion G protein-coupled receptor B3 |
| chr4_+_8797197 | 0.26 |
ENSDART00000158671
|
sult4a1
|
sulfotransferase family 4A, member 1 |
| chr23_+_13533885 | 0.25 |
ENSDART00000144386
|
uckl1b
|
uridine-cytidine kinase 1-like 1b |
| chr6_-_32703317 | 0.25 |
ENSDART00000064833
|
mafaa
|
v-maf avian musculoaponeurotic fibrosarcoma oncogene homolog Aa |
| chr2_-_31798717 | 0.24 |
ENSDART00000170880
|
retreg1
|
reticulophagy regulator 1 |
| chr25_+_14087045 | 0.23 |
ENSDART00000155770
|
actc1c
|
actin, alpha, cardiac muscle 1c |
| chr17_+_23298928 | 0.23 |
ENSDART00000153652
|
zgc:165461
|
zgc:165461 |
| chr12_-_26064480 | 0.23 |
ENSDART00000158215
ENSDART00000171206 ENSDART00000171212 ENSDART00000182956 ENSDART00000186779 |
ldb3b
|
LIM domain binding 3b |
| chr8_-_53195500 | 0.22 |
ENSDART00000132000
|
gabrd
|
gamma-aminobutyric acid (GABA) A receptor, delta |
| chr7_-_66868543 | 0.22 |
ENSDART00000149680
|
ampd3a
|
adenosine monophosphate deaminase 3a |
| chr7_+_26138240 | 0.22 |
ENSDART00000193750
ENSDART00000184942 |
nat16
|
N-acetyltransferase 16 |
| chr25_-_31423493 | 0.21 |
ENSDART00000027661
|
myod1
|
myogenic differentiation 1 |
| chr19_-_47527093 | 0.21 |
ENSDART00000171379
ENSDART00000171140 ENSDART00000114886 |
scg5
|
secretogranin V |
| chr20_-_29475172 | 0.21 |
ENSDART00000183164
|
scg5
|
secretogranin V |
| chr20_-_29474859 | 0.21 |
ENSDART00000152906
ENSDART00000045249 |
scg5
|
secretogranin V |
| chr10_-_7756865 | 0.21 |
ENSDART00000114373
ENSDART00000125407 ENSDART00000016317 |
loxa
|
lysyl oxidase a |
| chr8_-_34065573 | 0.20 |
ENSDART00000186946
|
pbx3b
|
pre-B-cell leukemia homeobox 3b |
| chr6_-_55864687 | 0.20 |
ENSDART00000160991
|
cyp24a1
|
cytochrome P450, family 24, subfamily A, polypeptide 1 |
| chr23_+_24926407 | 0.20 |
ENSDART00000137486
|
klhl21
|
kelch-like family member 21 |
| chr8_-_42624454 | 0.20 |
ENSDART00000075550
|
kazald3
|
Kazal-type serine peptidase inhibitor domain 3 |
| chr9_-_28867562 | 0.19 |
ENSDART00000189597
ENSDART00000060321 |
zgc:91818
|
zgc:91818 |
| chr5_+_19314574 | 0.19 |
ENSDART00000133247
|
rusc2
|
RUN and SH3 domain containing 2 |
| chr19_-_47526737 | 0.19 |
ENSDART00000186636
|
scg5
|
secretogranin V |
| chr12_+_20641102 | 0.19 |
ENSDART00000152964
|
calcoco2
|
calcium binding and coiled-coil domain 2 |
| chr1_-_38756870 | 0.19 |
ENSDART00000130324
ENSDART00000148404 |
gpm6ab
|
glycoprotein M6Ab |
| chr7_+_46003449 | 0.19 |
ENSDART00000159700
ENSDART00000173625 |
si:ch211-260e23.9
|
si:ch211-260e23.9 |
| chr3_+_34683096 | 0.19 |
ENSDART00000084432
|
dusp3b
|
dual specificity phosphatase 3b |
| chr24_+_25692802 | 0.19 |
ENSDART00000190493
|
camk2n2
|
calcium/calmodulin-dependent protein kinase II inhibitor 2 |
| chr7_-_26087807 | 0.18 |
ENSDART00000052989
|
ache
|
acetylcholinesterase |
| chr13_+_28854438 | 0.17 |
ENSDART00000193407
ENSDART00000189554 |
CU639469.1
|
|
| chr7_+_52766211 | 0.17 |
ENSDART00000186191
|
ppip5k1a
|
diphosphoinositol pentakisphosphate kinase 1a |
| chr12_+_20641471 | 0.17 |
ENSDART00000133654
|
calcoco2
|
calcium binding and coiled-coil domain 2 |
| chr14_+_51056605 | 0.17 |
ENSDART00000159639
|
CABZ01078593.1
|
|
| chr4_+_16725960 | 0.17 |
ENSDART00000034441
|
tcp11l2
|
t-complex 11, testis-specific-like 2 |
| chr15_+_25681044 | 0.16 |
ENSDART00000077853
|
hic1
|
hypermethylated in cancer 1 |
| chr5_-_71722257 | 0.16 |
ENSDART00000013404
|
ak1
|
adenylate kinase 1 |
| chr6_+_24817852 | 0.16 |
ENSDART00000165609
|
barhl2
|
BarH-like homeobox 2 |
| chr1_+_14466860 | 0.16 |
ENSDART00000114097
|
stim2a
|
tromal interaction molecule 2a |
| chr14_+_35748385 | 0.16 |
ENSDART00000064617
ENSDART00000074671 ENSDART00000172803 |
gria2b
|
glutamate receptor, ionotropic, AMPA 2b |
| chr11_+_35364445 | 0.16 |
ENSDART00000125766
|
camkvb
|
CaM kinase-like vesicle-associated b |
| chr20_+_30490682 | 0.15 |
ENSDART00000184871
|
myt1la
|
myelin transcription factor 1-like, a |
| chr20_+_15982482 | 0.15 |
ENSDART00000020999
|
angptl1a
|
angiopoietin-like 1a |
| chr5_+_34622320 | 0.15 |
ENSDART00000141338
|
enc1
|
ectodermal-neural cortex 1 |
| chr14_+_35748206 | 0.15 |
ENSDART00000177391
|
gria2b
|
glutamate receptor, ionotropic, AMPA 2b |
| chr9_+_9112159 | 0.15 |
ENSDART00000165932
|
sik1
|
salt-inducible kinase 1 |
| chr20_+_30445971 | 0.15 |
ENSDART00000153150
|
myt1la
|
myelin transcription factor 1-like, a |
| chr15_-_18432673 | 0.15 |
ENSDART00000146853
|
ncam1b
|
neural cell adhesion molecule 1b |
| chr21_-_3770636 | 0.15 |
ENSDART00000053596
|
scamp1
|
secretory carrier membrane protein 1 |
| chr21_+_8341774 | 0.15 |
ENSDART00000129749
ENSDART00000055325 ENSDART00000133804 |
psmb7
|
proteasome subunit beta 7 |
| chr8_-_26792912 | 0.14 |
ENSDART00000139787
|
kazna
|
kazrin, periplakin interacting protein a |
| chr21_-_23305561 | 0.14 |
ENSDART00000181815
|
zbtb16a
|
zinc finger and BTB domain containing 16a |
| chr19_+_2275019 | 0.14 |
ENSDART00000136138
|
itgb8
|
integrin, beta 8 |
| chr17_-_26719821 | 0.14 |
ENSDART00000186813
|
calm1a
|
calmodulin 1a |
| chr14_-_33044955 | 0.14 |
ENSDART00000170626
|
kdrl
|
kinase insert domain receptor like |
| chr19_+_48049202 | 0.14 |
ENSDART00000027158
|
psmd3
|
proteasome 26S subunit, non-ATPase 3 |
| chr12_+_5081759 | 0.14 |
ENSDART00000164178
|
prrt2
|
proline-rich transmembrane protein 2 |
| chr4_+_74131530 | 0.14 |
ENSDART00000174125
|
CABZ01072523.1
|
|
| chr7_+_52761841 | 0.14 |
ENSDART00000111444
|
ppip5k1a
|
diphosphoinositol pentakisphosphate kinase 1a |
| chr15_+_16908085 | 0.14 |
ENSDART00000186870
|
ypel2b
|
yippee-like 2b |
| chr9_+_38967998 | 0.14 |
ENSDART00000135581
|
map2
|
microtubule-associated protein 2 |
| chr6_+_13787855 | 0.14 |
ENSDART00000182899
|
tmem198b
|
transmembrane protein 198b |
| chr14_+_17197132 | 0.13 |
ENSDART00000054598
|
rtn4rl2b
|
reticulon 4 receptor-like 2b |
| chr5_+_39504136 | 0.13 |
ENSDART00000121460
|
prdm8b
|
PR domain containing 8b |
| chr1_-_30039331 | 0.13 |
ENSDART00000086935
ENSDART00000143800 |
MARCH4 (1 of many)
|
zgc:153256 |
| chr19_-_24125457 | 0.13 |
ENSDART00000080632
|
zgc:64022
|
zgc:64022 |
| chr4_-_77624155 | 0.13 |
ENSDART00000099761
|
si:ch211-250m6.7
|
si:ch211-250m6.7 |
| chr1_-_10885269 | 0.12 |
ENSDART00000126518
ENSDART00000009886 |
dmd
|
dystrophin |
| chr1_-_26131088 | 0.12 |
ENSDART00000193973
ENSDART00000054209 |
cdkn2a/b
|
cyclin-dependent kinase inhibitor 2A/B (p15, inhibits CDK4) |
| chr9_+_6009077 | 0.12 |
ENSDART00000057484
|
st6gal2a
|
ST6 beta-galactosamide alpha-2,6-sialyltranferase 2a |
| chr8_-_14050758 | 0.12 |
ENSDART00000133922
|
atp2b3a
|
ATPase plasma membrane Ca2+ transporting 3a |
| chr22_+_18886209 | 0.12 |
ENSDART00000144402
|
fstl3
|
follistatin-like 3 (secreted glycoprotein) |
| chr8_+_11993150 | 0.12 |
ENSDART00000132492
ENSDART00000191519 ENSDART00000114432 |
ntng2a
|
netrin g2a |
| chr16_-_28856112 | 0.12 |
ENSDART00000078543
|
syt11b
|
synaptotagmin XIb |
| chr2_-_6262441 | 0.12 |
ENSDART00000092190
|
arl14
|
ADP-ribosylation factor-like 14 |
| chr1_-_50611031 | 0.12 |
ENSDART00000148285
|
ppm1k
|
protein phosphatase, Mg2+/Mn2+ dependent, 1K |
| chr1_-_49250490 | 0.12 |
ENSDART00000150386
|
si:ch73-6k14.2
|
si:ch73-6k14.2 |
| chr11_-_36350421 | 0.12 |
ENSDART00000141477
|
psma5
|
proteasome subunit alpha 5 |
| chr12_+_46960579 | 0.12 |
ENSDART00000149032
|
oat
|
ornithine aminotransferase |
| chr19_-_44091405 | 0.12 |
ENSDART00000132800
|
rad21b
|
RAD21 cohesin complex component b |
| chr6_-_7052595 | 0.12 |
ENSDART00000081761
ENSDART00000181351 |
bin1b
|
bridging integrator 1b |
| chr16_+_1334431 | 0.12 |
ENSDART00000024206
|
celf3b
|
cugbp, Elav-like family member 3b |
| chr4_-_77602685 | 0.11 |
ENSDART00000152922
|
si:dkey-61p9.11
|
si:dkey-61p9.11 |
| chr2_+_5563077 | 0.11 |
ENSDART00000111220
|
mb21d2
|
Mab-21 domain containing 2 |
| chr20_+_52774730 | 0.11 |
ENSDART00000014606
|
phactr1
|
phosphatase and actin regulator 1 |
| chr12_+_35316233 | 0.11 |
ENSDART00000178663
|
ndst2b
|
N-deacetylase/N-sulfotransferase (heparan glucosaminyl) 2b |
| chr6_-_30839763 | 0.11 |
ENSDART00000154228
|
sgip1a
|
SH3-domain GRB2-like (endophilin) interacting protein 1a |
| chr15_+_23550890 | 0.11 |
ENSDART00000009796
ENSDART00000152720 |
MARK4
|
si:dkey-31m14.7 |
| chr20_-_28800999 | 0.11 |
ENSDART00000049462
|
rab15
|
RAB15, member RAS oncogene family |
| chr23_-_29502287 | 0.11 |
ENSDART00000141075
ENSDART00000053807 |
kif1b
|
kinesin family member 1B |
| chr4_+_10365857 | 0.11 |
ENSDART00000138890
|
kcnd2
|
potassium voltage-gated channel, Shal-related subfamily, member 2 |
| chr3_+_35298078 | 0.11 |
ENSDART00000110126
|
cacng3b
|
calcium channel, voltage-dependent, gamma subunit 3b |
| chr10_+_15408501 | 0.11 |
ENSDART00000123818
ENSDART00000192395 ENSDART00000003839 |
nln
|
neurolysin (metallopeptidase M3 family) |
| chr5_+_4575800 | 0.11 |
ENSDART00000180952
|
cst14b.2
|
cystatin 14b, tandem duplicate 2 |
| chr24_-_14712427 | 0.10 |
ENSDART00000176316
|
jph1a
|
junctophilin 1a |
| chr12_+_29054907 | 0.10 |
ENSDART00000152936
|
gabrz
|
gamma-aminobutyric acid (GABA) A receptor, zeta |
| chr12_-_41619257 | 0.10 |
ENSDART00000162967
|
dpysl4
|
dihydropyrimidinase-like 4 |
| chr2_+_3595333 | 0.10 |
ENSDART00000041052
|
c1ql3b
|
complement component 1, q subcomponent-like 3b |
| chr25_-_11088839 | 0.10 |
ENSDART00000154748
|
sv2bb
|
synaptic vesicle glycoprotein 2Bb |
| chr4_-_11165611 | 0.10 |
ENSDART00000059489
|
prmt8b
|
protein arginine methyltransferase 8b |
| chr5_+_36611128 | 0.10 |
ENSDART00000097684
|
nova1
|
neuro-oncological ventral antigen 1 |
| chr9_-_49468701 | 0.10 |
ENSDART00000186293
|
xirp2b
|
xin actin binding repeat containing 2b |
| chr16_-_36748374 | 0.10 |
ENSDART00000133310
|
pik3r4
|
phosphoinositide-3-kinase, regulatory subunit 4 |
| chr10_-_20637098 | 0.10 |
ENSDART00000080391
|
sprn2
|
shadow of prion protein 2 |
| chr6_+_23809501 | 0.10 |
ENSDART00000168701
|
glulb
|
glutamate-ammonia ligase (glutamine synthase) b |
| chr2_+_24199276 | 0.10 |
ENSDART00000140575
|
map4l
|
microtubule associated protein 4 like |
| chr6_+_34028532 | 0.10 |
ENSDART00000155827
|
si:ch73-185c24.2
|
si:ch73-185c24.2 |
| chr16_-_26074529 | 0.10 |
ENSDART00000148653
ENSDART00000148923 |
tmem145
|
transmembrane protein 145 |
| chr6_-_35487413 | 0.10 |
ENSDART00000102461
|
rgs8
|
regulator of G protein signaling 8 |
| chr9_-_28867908 | 0.10 |
ENSDART00000185692
|
zgc:91818
|
zgc:91818 |
| chr12_+_31729075 | 0.10 |
ENSDART00000152973
|
RNF157
|
si:dkey-49c17.3 |
| chr7_+_25915089 | 0.10 |
ENSDART00000173648
|
hmgb3a
|
high mobility group box 3a |
| chr12_+_29055143 | 0.09 |
ENSDART00000076322
|
gabrz
|
gamma-aminobutyric acid (GABA) A receptor, zeta |
| chr3_+_60957512 | 0.09 |
ENSDART00000044096
|
helz
|
helicase with zinc finger |
| chr12_-_41618844 | 0.09 |
ENSDART00000160054
|
dpysl4
|
dihydropyrimidinase-like 4 |
| chr9_+_42607138 | 0.09 |
ENSDART00000138133
ENSDART00000002027 |
gulp1a
|
GULP, engulfment adaptor PTB domain containing 1a |
| chr7_-_26270014 | 0.09 |
ENSDART00000079347
|
serpine1
|
serpin peptidase inhibitor, clade E (nexin, plasminogen activator inhibitor type 1), member 1 |
| chr18_+_38775277 | 0.09 |
ENSDART00000186129
|
fam214a
|
family with sequence similarity 214, member A |
| chr11_-_45152702 | 0.09 |
ENSDART00000168066
|
afmid
|
arylformamidase |
| chr11_-_36350876 | 0.09 |
ENSDART00000146495
ENSDART00000020655 |
psma5
|
proteasome subunit alpha 5 |
| chr14_-_2348917 | 0.09 |
ENSDART00000159004
|
si:ch73-233f7.8
|
si:ch73-233f7.8 |
| chr9_+_2574122 | 0.09 |
ENSDART00000166326
ENSDART00000191822 |
CIR1
|
si:ch73-167c12.2 |
| chr13_-_27675212 | 0.09 |
ENSDART00000141035
|
rims1a
|
regulating synaptic membrane exocytosis 1a |
| chr19_-_41405187 | 0.09 |
ENSDART00000038038
ENSDART00000172350 |
sem1
|
SEM1, 26S proteasome complex subunit |
| chr16_+_47207691 | 0.09 |
ENSDART00000062507
|
ica1
|
islet cell autoantigen 1 |
| chr5_-_28029558 | 0.09 |
ENSDART00000078649
|
abcb9
|
ATP-binding cassette, sub-family B (MDR/TAP), member 9 |
| chr14_-_9522364 | 0.09 |
ENSDART00000054689
|
atoh8
|
atonal bHLH transcription factor 8 |
| chr12_+_19362335 | 0.09 |
ENSDART00000041711
|
gspt1
|
G1 to S phase transition 1 |
| chr24_-_19718077 | 0.09 |
ENSDART00000109107
ENSDART00000056082 |
csrnp1b
|
cysteine-serine-rich nuclear protein 1b |
| chr5_-_10946232 | 0.09 |
ENSDART00000163139
ENSDART00000031265 |
rtn4r
|
reticulon 4 receptor |
| chr11_-_24523161 | 0.09 |
ENSDART00000191936
|
plekhg5a
|
pleckstrin homology domain containing, family G (with RhoGef domain) member 5a |
| chr19_-_9503473 | 0.09 |
ENSDART00000091615
|
iffo1a
|
intermediate filament family orphan 1a |
| chr20_-_18736281 | 0.09 |
ENSDART00000142837
|
enpp5
|
ectonucleotide pyrophosphatase/phosphodiesterase 5 |
| chr18_+_29156827 | 0.08 |
ENSDART00000137587
ENSDART00000135633 |
ppfibp2a
|
PTPRF interacting protein, binding protein 2a (liprin beta 2) |
| chr17_+_33496067 | 0.08 |
ENSDART00000184724
|
pth2
|
parathyroid hormone 2 |
| chr22_+_12361317 | 0.08 |
ENSDART00000189963
ENSDART00000159614 |
r3hdm1
|
R3H domain containing 1 |
| chr15_+_20352123 | 0.08 |
ENSDART00000011030
ENSDART00000163532 ENSDART00000169537 ENSDART00000161047 |
il15l
|
interleukin 15, like |
| chr18_+_23193567 | 0.08 |
ENSDART00000190072
ENSDART00000171594 ENSDART00000181762 |
mef2aa
|
myocyte enhancer factor 2aa |
| chr25_-_25142387 | 0.08 |
ENSDART00000031814
|
tsg101a
|
tumor susceptibility 101a |
| chr16_+_18535618 | 0.08 |
ENSDART00000021596
|
rxrbb
|
retinoid x receptor, beta b |
| chr16_-_12953739 | 0.08 |
ENSDART00000103894
|
cacng8b
|
calcium channel, voltage-dependent, gamma subunit 8b |
| chr10_-_38243579 | 0.08 |
ENSDART00000150159
|
usp25
|
ubiquitin specific peptidase 25 |
| chr17_-_23412705 | 0.08 |
ENSDART00000126995
|
si:ch211-149k12.3
|
si:ch211-149k12.3 |
| chr17_+_45737992 | 0.08 |
ENSDART00000135073
ENSDART00000143525 ENSDART00000158165 ENSDART00000184167 ENSDART00000109525 |
aspg
|
asparaginase homolog (S. cerevisiae) |
| chr22_+_31821815 | 0.08 |
ENSDART00000159825
|
dock3
|
dedicator of cytokinesis 3 |
| chr10_-_11840353 | 0.08 |
ENSDART00000127581
|
trim23
|
tripartite motif containing 23 |
| chr8_+_4761244 | 0.08 |
ENSDART00000137252
ENSDART00000132139 ENSDART00000034968 ENSDART00000143139 |
ufd1l
|
ubiquitin recognition factor in ER associated degradation 1 |
| chr21_-_35428039 | 0.08 |
ENSDART00000193298
|
si:dkeyp-23e4.3
|
si:dkeyp-23e4.3 |
| chr5_-_42661012 | 0.08 |
ENSDART00000158339
|
pimr58
|
Pim proto-oncogene, serine/threonine kinase, related 58 |
| chr6_-_10780698 | 0.08 |
ENSDART00000151714
|
gpr155b
|
G protein-coupled receptor 155b |
| chr16_+_44906324 | 0.08 |
ENSDART00000074960
|
cd22
|
cd22 molecule |
| chr16_-_33817828 | 0.08 |
ENSDART00000188395
|
rspo1
|
R-spondin 1 |
| chr6_-_7052408 | 0.08 |
ENSDART00000150033
ENSDART00000149232 |
bin1b
|
bridging integrator 1b |
| chr18_-_14777092 | 0.08 |
ENSDART00000144660
|
mtss1la
|
metastasis suppressor 1-like a |
| chr11_+_25583950 | 0.08 |
ENSDART00000111961
|
ccdc120
|
coiled-coil domain containing 120 |
| chr6_-_39167732 | 0.08 |
ENSDART00000153626
|
apof
|
apolipoprotein F |
| chr5_+_67812062 | 0.07 |
ENSDART00000158611
|
zgc:175280
|
zgc:175280 |
| chr15_+_28685892 | 0.07 |
ENSDART00000155815
ENSDART00000060244 |
nova2
|
neuro-oncological ventral antigen 2 |
| chr15_+_23657051 | 0.07 |
ENSDART00000078336
|
klc3
|
kinesin light chain 3 |
| chr20_-_40717900 | 0.07 |
ENSDART00000181663
|
cx43
|
connexin 43 |
| chr12_-_2993095 | 0.07 |
ENSDART00000152316
|
si:dkey-202c14.3
|
si:dkey-202c14.3 |
| chr5_+_42092227 | 0.07 |
ENSDART00000097583
ENSDART00000171678 |
ubb
|
ubiquitin B |
| chr16_+_31853919 | 0.07 |
ENSDART00000133886
|
atn1
|
atrophin 1 |
| chr18_+_642889 | 0.07 |
ENSDART00000189007
|
CABZ01078320.1
|
|
| chr11_-_16215143 | 0.07 |
ENSDART00000027014
|
rab7
|
RAB7, member RAS oncogene family |
| chr6_-_40899618 | 0.07 |
ENSDART00000153949
ENSDART00000021969 |
zgc:172271
|
zgc:172271 |
| chr6_-_6487876 | 0.07 |
ENSDART00000137642
|
cep170ab
|
centrosomal protein 170Ab |
| chr11_+_30162407 | 0.07 |
ENSDART00000190333
ENSDART00000127502 |
cdkl5
|
cyclin-dependent kinase-like 5 |
| chr21_-_1799265 | 0.07 |
ENSDART00000066623
|
st8sia3
|
ST8 alpha-N-acetyl-neuraminide alpha-2,8-sialyltransferase 3 |
| chr1_+_2190714 | 0.07 |
ENSDART00000132126
|
mbnl2
|
muscleblind-like splicing regulator 2 |
| chr21_-_11632403 | 0.07 |
ENSDART00000171708
ENSDART00000138619 ENSDART00000136308 ENSDART00000144770 |
cast
|
calpastatin |
| chr14_-_26177156 | 0.07 |
ENSDART00000014149
|
fat2
|
FAT atypical cadherin 2 |
| chr8_+_8298439 | 0.07 |
ENSDART00000170566
|
srpk3
|
SRSF protein kinase 3 |
| chr7_-_41554047 | 0.07 |
ENSDART00000174144
|
plxdc2
|
plexin domain containing 2 |
| chr7_-_58952382 | 0.07 |
ENSDART00000167076
|
mrc1a
|
mannose receptor, C type 1a |
| chr3_-_18675688 | 0.07 |
ENSDART00000048218
|
slc5a11
|
solute carrier family 5 (sodium/inositol cotransporter), member 11 |
| chr11_-_8126223 | 0.07 |
ENSDART00000091617
ENSDART00000192391 ENSDART00000101561 |
ttll7
|
tubulin tyrosine ligase-like family, member 7 |
| chr6_-_32834385 | 0.07 |
ENSDART00000129803
|
zc3h3
|
zinc finger CCCH-type containing 3 |
| chr5_-_3960161 | 0.07 |
ENSDART00000111453
|
myo19
|
myosin XIX |
| chr1_+_53321878 | 0.07 |
ENSDART00000143909
|
tbc1d9
|
TBC1 domain family, member 9 (with GRAM domain) |
| chr3_-_61336841 | 0.07 |
ENSDART00000155414
|
tecpr1b
|
tectonin beta-propeller repeat containing 1b |
| chr14_-_6943934 | 0.07 |
ENSDART00000126279
|
clk4a
|
CDC-like kinase 4a |
| chr11_+_30663300 | 0.07 |
ENSDART00000161662
|
ttbk1a
|
tau tubulin kinase 1a |
| chr5_+_42400777 | 0.07 |
ENSDART00000183114
|
BX548073.8
|
|
| chr22_+_37534094 | 0.07 |
ENSDART00000065239
|
dnajc19
|
DnaJ (Hsp40) homolog, subfamily C, member 19 |
| chr22_+_10752787 | 0.06 |
ENSDART00000186542
|
lsm7
|
LSM7 homolog, U6 small nuclear RNA and mRNA degradation associated |
| chr17_-_42218652 | 0.06 |
ENSDART00000081396
ENSDART00000190007 |
nkx2.2a
|
NK2 homeobox 2a |
| chr7_-_22956889 | 0.06 |
ENSDART00000101447
|
tnfsf10l
|
TNF superfamily member 10, like |
| chr23_-_35483163 | 0.06 |
ENSDART00000138660
ENSDART00000113643 ENSDART00000189269 |
fbxo25
|
F-box protein 25 |
| chr5_-_40734045 | 0.06 |
ENSDART00000010896
|
isl1
|
ISL LIM homeobox 1 |
| chr21_-_32301109 | 0.06 |
ENSDART00000139890
|
clk4b
|
CDC-like kinase 4b |
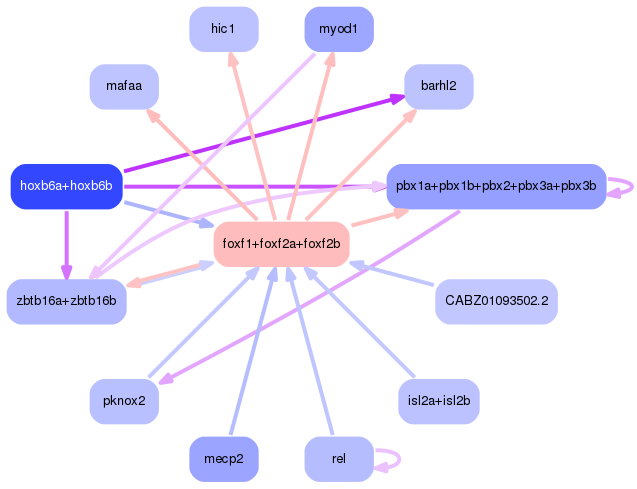
Network of associatons between targets according to the STRING database.

First level regulatory network of foxf1+foxf2a+foxf2b
Gene Ontology Analysis
Gene overrepresentation in biological process category:
| Log-likelihood per target | Total log-likelihood | Term | Description |
|---|---|---|---|
| 0.1 | 0.2 | GO:0002074 | extraocular skeletal muscle development(GO:0002074) |
| 0.1 | 0.2 | GO:0010430 | fatty acid omega-oxidation(GO:0010430) |
| 0.1 | 0.3 | GO:0016322 | neuron remodeling(GO:0016322) |
| 0.0 | 0.4 | GO:1990845 | adaptive thermogenesis(GO:1990845) |
| 0.0 | 0.2 | GO:1900619 | acetylcholine metabolic process(GO:0008291) acetate ester metabolic process(GO:1900619) |
| 0.0 | 0.1 | GO:0021530 | spinal cord oligodendrocyte cell fate specification(GO:0021530) |
| 0.0 | 0.1 | GO:0048917 | posterior lateral line ganglion development(GO:0048917) |
| 0.0 | 0.3 | GO:0044211 | CTP salvage(GO:0044211) |
| 0.0 | 0.1 | GO:2001014 | regulation of skeletal muscle cell differentiation(GO:2001014) |
| 0.0 | 0.1 | GO:0002184 | cytoplasmic translational termination(GO:0002184) |
| 0.0 | 0.2 | GO:0061709 | reticulophagy(GO:0061709) |
| 0.0 | 0.1 | GO:0060159 | regulation of dopamine receptor signaling pathway(GO:0060159) |
| 0.0 | 0.3 | GO:0006020 | inositol metabolic process(GO:0006020) |
| 0.0 | 0.2 | GO:0006172 | ADP biosynthetic process(GO:0006172) purine nucleoside diphosphate biosynthetic process(GO:0009136) purine ribonucleoside diphosphate biosynthetic process(GO:0009180) |
| 0.0 | 0.2 | GO:0032237 | activation of store-operated calcium channel activity(GO:0032237) positive regulation of store-operated calcium channel activity(GO:1901341) |
| 0.0 | 0.1 | GO:0030242 | pexophagy(GO:0030242) |
| 0.0 | 0.0 | GO:0042304 | regulation of fatty acid biosynthetic process(GO:0042304) |
| 0.0 | 0.7 | GO:0046883 | regulation of hormone secretion(GO:0046883) |
| 0.0 | 0.8 | GO:0003009 | skeletal muscle contraction(GO:0003009) |
| 0.0 | 0.2 | GO:0032264 | IMP salvage(GO:0032264) |
| 0.0 | 0.1 | GO:0001886 | endothelial cell morphogenesis(GO:0001886) |
| 0.0 | 0.0 | GO:0060843 | lymphatic endothelial cell fate commitment(GO:0060838) venous endothelial cell differentiation(GO:0060843) venous endothelial cell fate commitment(GO:0060845) |
| 0.0 | 0.2 | GO:1903318 | negative regulation of protein processing(GO:0010955) negative regulation of protein maturation(GO:1903318) |
| 0.0 | 0.1 | GO:0006542 | glutamine biosynthetic process(GO:0006542) |
| 0.0 | 0.0 | GO:0043370 | regulation of CD4-positive, alpha-beta T cell differentiation(GO:0043370) regulation of alpha-beta T cell differentiation(GO:0046637) |
| 0.0 | 0.1 | GO:0044210 | 'de novo' CTP biosynthetic process(GO:0044210) |
| 0.0 | 0.1 | GO:0055129 | proline biosynthetic process(GO:0006561) L-proline biosynthetic process(GO:0055129) |
| 0.0 | 0.1 | GO:1990414 | replication-born double-strand break repair via sister chromatid exchange(GO:1990414) |
| 0.0 | 0.1 | GO:0090467 | L-arginine import(GO:0043091) amino acid import across plasma membrane(GO:0089718) arginine import(GO:0090467) L-arginine import across plasma membrane(GO:0097638) L-arginine transport(GO:1902023) L-arginine import into cell(GO:1902765) amino acid import into cell(GO:1902837) L-arginine transmembrane transport(GO:1903400) arginine transmembrane transport(GO:1903826) |
| 0.0 | 0.2 | GO:0018057 | peptidyl-lysine oxidation(GO:0018057) |
| 0.0 | 0.2 | GO:0034629 | cellular protein complex localization(GO:0034629) |
| 0.0 | 0.2 | GO:0006208 | pyrimidine nucleobase catabolic process(GO:0006208) |
| 0.0 | 0.4 | GO:0010499 | proteasomal ubiquitin-independent protein catabolic process(GO:0010499) |
| 0.0 | 0.1 | GO:0019441 | tryptophan catabolic process to kynurenine(GO:0019441) |
| 0.0 | 0.2 | GO:0098943 | neurotransmitter receptor transport, postsynaptic endosome to lysosome(GO:0098943) |
| 0.0 | 0.1 | GO:0032926 | negative regulation of activin receptor signaling pathway(GO:0032926) |
| 0.0 | 0.1 | GO:0032481 | positive regulation of type I interferon production(GO:0032481) |
| 0.0 | 0.0 | GO:1903358 | regulation of Golgi organization(GO:1903358) |
| 0.0 | 0.0 | GO:1901376 | mycotoxin metabolic process(GO:0043385) aflatoxin metabolic process(GO:0046222) organic heteropentacyclic compound metabolic process(GO:1901376) |
| 0.0 | 0.1 | GO:0007525 | somatic muscle development(GO:0007525) |
| 0.0 | 0.1 | GO:0015014 | heparan sulfate proteoglycan biosynthetic process, polysaccharide chain biosynthetic process(GO:0015014) |
| 0.0 | 0.2 | GO:0043248 | proteasome assembly(GO:0043248) |
| 0.0 | 0.2 | GO:0045747 | positive regulation of Notch signaling pathway(GO:0045747) |
Gene overrepresentation in cellular component category:
| Log-likelihood per target | Total log-likelihood | Term | Description |
|---|---|---|---|
| 0.1 | 0.3 | GO:0043083 | synaptic cleft(GO:0043083) |
| 0.0 | 0.1 | GO:0032839 | dendrite cytoplasm(GO:0032839) |
| 0.0 | 0.1 | GO:0098753 | intrinsic component of the cytoplasmic side of the plasma membrane(GO:0031235) anchored component of the cytoplasmic side of the plasma membrane(GO:0098753) |
| 0.0 | 0.1 | GO:0018444 | translation release factor complex(GO:0018444) |
| 0.0 | 0.2 | GO:0005614 | interstitial matrix(GO:0005614) |
| 0.0 | 0.3 | GO:0008541 | proteasome regulatory particle, lid subcomplex(GO:0008541) |
| 0.0 | 0.1 | GO:0030314 | junctional membrane complex(GO:0030314) |
| 0.0 | 0.1 | GO:0034271 | phosphatidylinositol 3-kinase complex, class III, type I(GO:0034271) phosphatidylinositol 3-kinase complex, class III, type II(GO:0034272) |
| 0.0 | 0.1 | GO:0034098 | VCP-NPL4-UFD1 AAA ATPase complex(GO:0034098) |
| 0.0 | 0.1 | GO:0030892 | nuclear cohesin complex(GO:0000798) mitotic cohesin complex(GO:0030892) nuclear mitotic cohesin complex(GO:0034990) nuclear meiotic cohesin complex(GO:0034991) |
| 0.0 | 0.2 | GO:0019773 | proteasome core complex, alpha-subunit complex(GO:0019773) |
| 0.0 | 0.8 | GO:0005861 | troponin complex(GO:0005861) |
| 0.0 | 0.1 | GO:0042824 | MHC class I peptide loading complex(GO:0042824) |
| 0.0 | 0.1 | GO:1990726 | Lsm1-7-Pat1 complex(GO:1990726) |
| 0.0 | 0.0 | GO:0005947 | mitochondrial alpha-ketoglutarate dehydrogenase complex(GO:0005947) mitochondrial tricarboxylic acid cycle enzyme complex(GO:0030062) |
| 0.0 | 0.1 | GO:0001405 | presequence translocase-associated import motor(GO:0001405) |
| 0.0 | 0.2 | GO:0044295 | axonal growth cone(GO:0044295) |
| 0.0 | 0.5 | GO:1902710 | GABA receptor complex(GO:1902710) GABA-A receptor complex(GO:1902711) |
| 0.0 | 0.1 | GO:0097268 | cytoophidium(GO:0097268) |
| 0.0 | 0.5 | GO:0032281 | AMPA glutamate receptor complex(GO:0032281) |
| 0.0 | 0.1 | GO:0032593 | insulin-responsive compartment(GO:0032593) |
| 0.0 | 0.0 | GO:0090443 | FAR/SIN/STRIPAK complex(GO:0090443) |
| 0.0 | 0.8 | GO:0030141 | secretory granule(GO:0030141) |
Gene overrepresentation in molecular function category:
| Log-likelihood per target | Total log-likelihood | Term | Description |
|---|---|---|---|
| 0.1 | 0.4 | GO:0017077 | oxidative phosphorylation uncoupler activity(GO:0017077) |
| 0.1 | 0.3 | GO:0033857 | inositol heptakisphosphate kinase activity(GO:0000829) diphosphoinositol-pentakisphosphate kinase activity(GO:0033857) |
| 0.1 | 0.3 | GO:0046592 | polyamine oxidase activity(GO:0046592) |
| 0.1 | 0.3 | GO:0004743 | pyruvate kinase activity(GO:0004743) |
| 0.1 | 0.2 | GO:0070643 | vitamin D 25-hydroxylase activity(GO:0070643) |
| 0.0 | 0.2 | GO:0048156 | tau protein binding(GO:0048156) |
| 0.0 | 0.3 | GO:0004849 | uridine kinase activity(GO:0004849) |
| 0.0 | 0.2 | GO:0008427 | calcium-dependent protein kinase inhibitor activity(GO:0008427) calcium-dependent protein kinase regulator activity(GO:0010858) |
| 0.0 | 0.1 | GO:0004061 | arylformamidase activity(GO:0004061) |
| 0.0 | 0.1 | GO:0046978 | TAP1 binding(GO:0046978) |
| 0.0 | 0.2 | GO:0004104 | cholinesterase activity(GO:0004104) |
| 0.0 | 0.2 | GO:0070888 | E-box binding(GO:0070888) |
| 0.0 | 0.3 | GO:0004971 | AMPA glutamate receptor activity(GO:0004971) |
| 0.0 | 0.2 | GO:0047623 | AMP deaminase activity(GO:0003876) adenosine-phosphate deaminase activity(GO:0047623) |
| 0.0 | 0.1 | GO:0005250 | A-type (transient outward) potassium channel activity(GO:0005250) |
| 0.0 | 0.2 | GO:0004157 | dihydropyrimidinase activity(GO:0004157) |
| 0.0 | 0.1 | GO:0003835 | beta-galactoside alpha-2,6-sialyltransferase activity(GO:0003835) |
| 0.0 | 0.1 | GO:0035242 | protein-arginine omega-N asymmetric methyltransferase activity(GO:0035242) |
| 0.0 | 0.1 | GO:0004356 | glutamate-ammonia ligase activity(GO:0004356) ammonia ligase activity(GO:0016211) acid-ammonia (or amide) ligase activity(GO:0016880) |
| 0.0 | 0.1 | GO:0015016 | [heparan sulfate]-glucosamine N-sulfotransferase activity(GO:0015016) |
| 0.0 | 0.1 | GO:0003747 | translation release factor activity(GO:0003747) translation termination factor activity(GO:0008079) |
| 0.0 | 0.5 | GO:0004890 | GABA-A receptor activity(GO:0004890) |
| 0.0 | 0.1 | GO:0003883 | CTP synthase activity(GO:0003883) |
| 0.0 | 0.1 | GO:0030504 | inorganic diphosphate transmembrane transporter activity(GO:0030504) |
| 0.0 | 0.1 | GO:0044323 | retinoic acid-responsive element binding(GO:0044323) |
| 0.0 | 0.2 | GO:0004017 | adenylate kinase activity(GO:0004017) |
| 0.0 | 0.2 | GO:0004720 | protein-lysine 6-oxidase activity(GO:0004720) |
| 0.0 | 0.1 | GO:0004067 | asparaginase activity(GO:0004067) |
| 0.0 | 0.1 | GO:0005412 | glucose:sodium symporter activity(GO:0005412) |
| 0.0 | 0.2 | GO:0051371 | muscle alpha-actinin binding(GO:0051371) alpha-actinin binding(GO:0051393) |
| 0.0 | 0.1 | GO:0015189 | L-lysine transmembrane transporter activity(GO:0015189) |
Gene overrepresentation in curated gene sets: canonical pathways category:
| Log-likelihood per target | Total log-likelihood | Term | Description |
|---|---|---|---|
| 0.0 | 0.1 | PID INTEGRIN5 PATHWAY | Beta5 beta6 beta7 and beta8 integrin cell surface interactions |
Gene overrepresentation in curated gene sets: REACTOME pathways category:
| Log-likelihood per target | Total log-likelihood | Term | Description |
|---|---|---|---|
| 0.1 | 0.3 | REACTOME CYTOSOLIC SULFONATION OF SMALL MOLECULES | Genes involved in Cytosolic sulfonation of small molecules |
| 0.0 | 0.3 | REACTOME METABOLISM OF POLYAMINES | Genes involved in Metabolism of polyamines |
| 0.0 | 0.2 | REACTOME CRMPS IN SEMA3A SIGNALING | Genes involved in CRMPs in Sema3A signaling |
| 0.0 | 0.1 | REACTOME AMINO ACID SYNTHESIS AND INTERCONVERSION TRANSAMINATION | Genes involved in Amino acid synthesis and interconversion (transamination) |
| 0.0 | 0.5 | REACTOME CROSS PRESENTATION OF SOLUBLE EXOGENOUS ANTIGENS ENDOSOMES | Genes involved in Cross-presentation of soluble exogenous antigens (endosomes) |