Project
PRJNA207719: Tissue specific transcriptome profiling
Navigation
Downloads
Results for bhlhe41_tfeb_usf2_tfec_max_mnta+mntb_mitfa+mitfb_mlxipl_usf1_usf1l_mxi1_srebf1
Z-value: 1.37
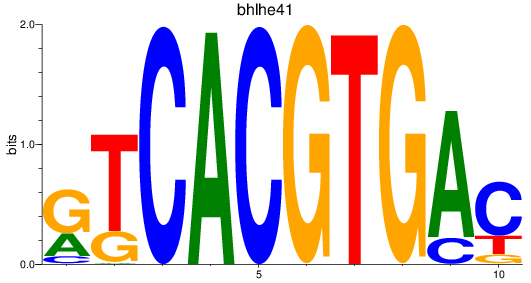
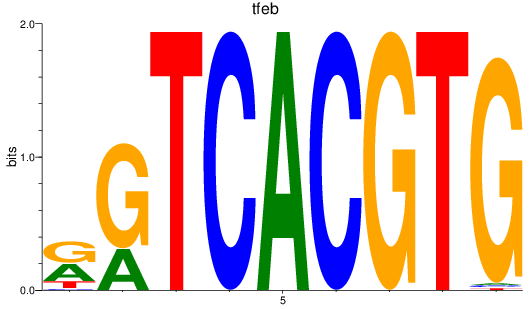
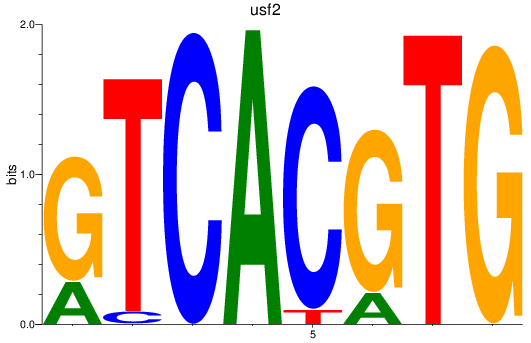
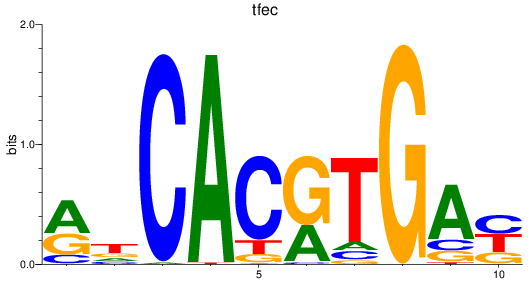
Motif logo
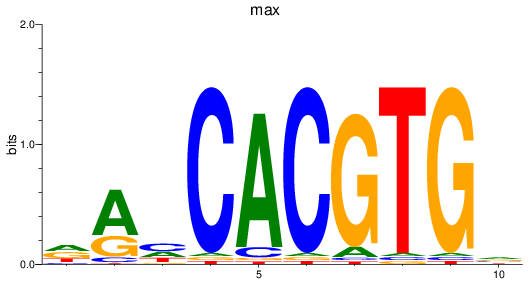
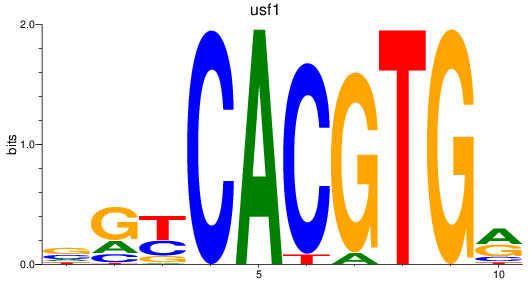
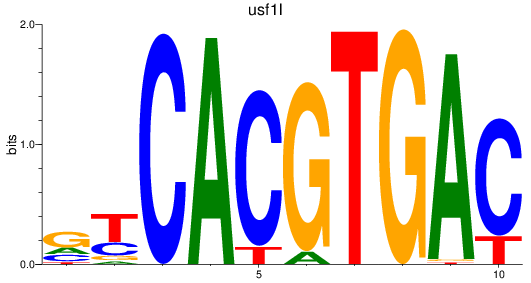
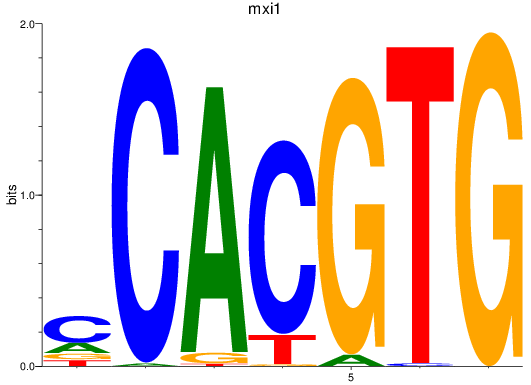
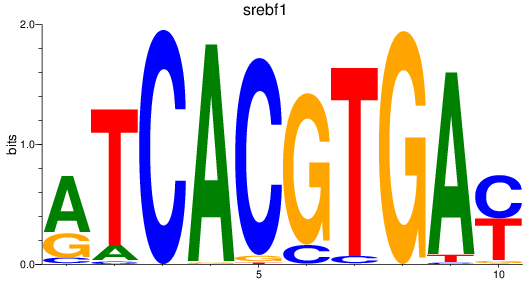
Transcription factors associated with bhlhe41_tfeb_usf2_tfec_max_mnta+mntb_mitfa+mitfb_mlxipl_usf1_usf1l_mxi1_srebf1
| Gene Symbol | Gene ID | Gene Info |
|---|---|---|
|
bhlhe41
|
ENSDARG00000041691 | basic helix-loop-helix family, member e41 |
|
bhlhe41
|
ENSDARG00000112123 | basic helix-loop-helix family, member e41 |
|
bhlhe41
|
ENSDARG00000114358 | basic helix-loop-helix family, member e41 |
|
tfeb
|
ENSDARG00000010794 | transcription factor EB |
|
usf2
|
ENSDARG00000020228 | upstream transcription factor 2, c-fos interacting |
|
tfec
|
ENSDARG00000098745 | transcription factor EC |
|
max
|
ENSDARG00000024844 | myc associated factor X |
|
mntb
|
ENSDARG00000073988 | MAX network transcriptional repressor b |
|
mnta
|
ENSDARG00000101859 | MAX network transcriptional repressor a |
|
mitfa
|
ENSDARG00000003732 | melanocyte inducing transcription factor a |
|
mitfb
|
ENSDARG00000037833 | melanocyte inducing transcription factor b |
|
mlxipl
|
ENSDARG00000089107 | MLX interacting protein like |
|
usf1
|
ENSDARG00000041689 | upstream transcription factor 1 |
|
usf1l
|
ENSDARG00000014463 | upstream transcription factor 1, like |
|
usf1l
|
ENSDARG00000109684 | upstream transcription factor 1, like |
|
usf1l
|
ENSDARG00000114279 | upstream transcription factor 1, like |
|
mxi1
|
ENSDARG00000040884 | max interactor 1, dimerization protein |
|
mxi1
|
ENSDARG00000111950 | max interactor 1, dimerization protein |
|
srebf1
|
ENSDARG00000067607 | sterol regulatory element binding transcription factor 1 |
Activity-expression correlation:
| Gene | Promoter | Pearson corr. coef. | P-value | Plot |
|---|---|---|---|---|
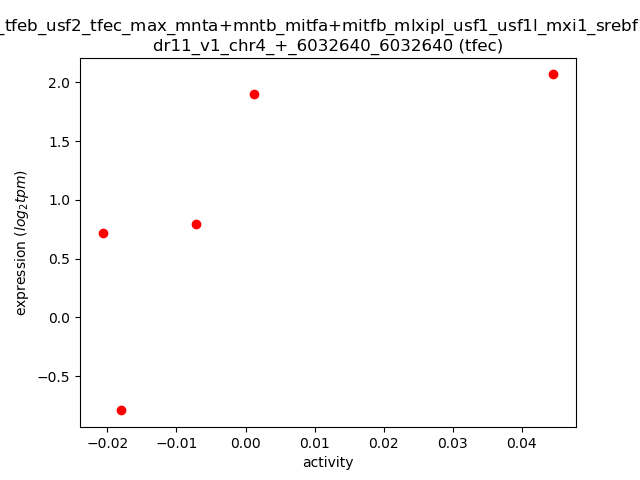
| tfec | dr11_v1_chr4_+_6032640_6032640 | 0.73 | 1.6e-01 | Click! |
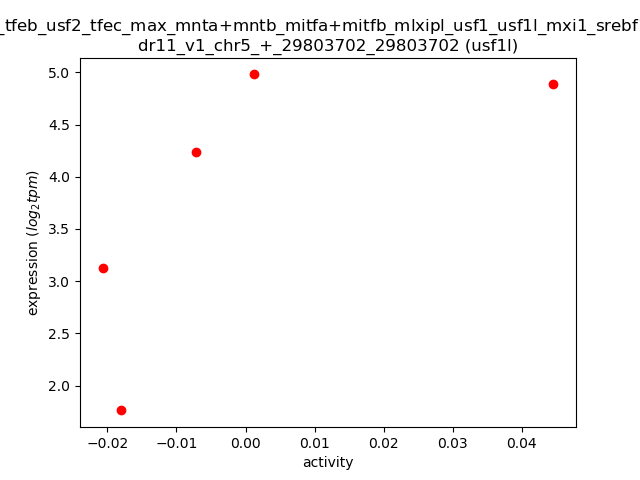
| usf1l | dr11_v1_chr5_+_29803702_29803702 | 0.68 | 2.1e-01 | Click! |
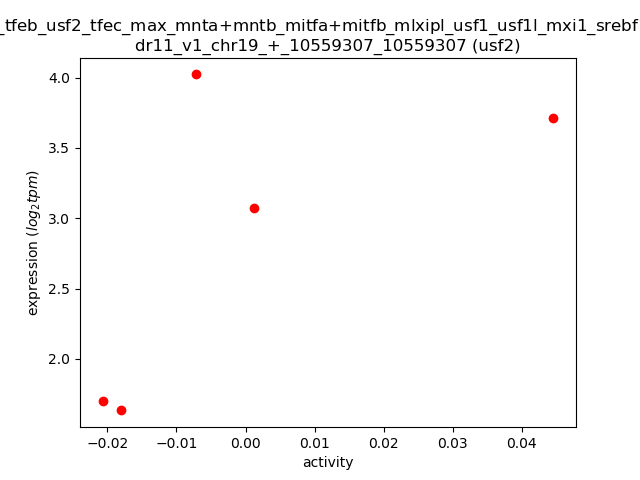
| usf2 | dr11_v1_chr19_+_10559307_10559307 | 0.65 | 2.4e-01 | Click! |
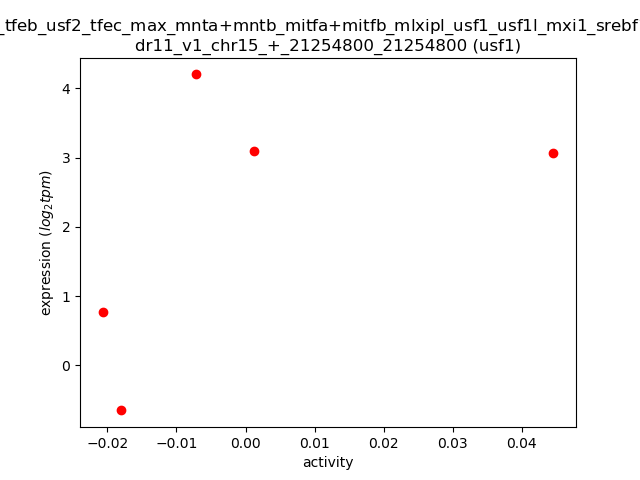
| usf1 | dr11_v1_chr15_+_21254800_21254800 | 0.51 | 3.8e-01 | Click! |
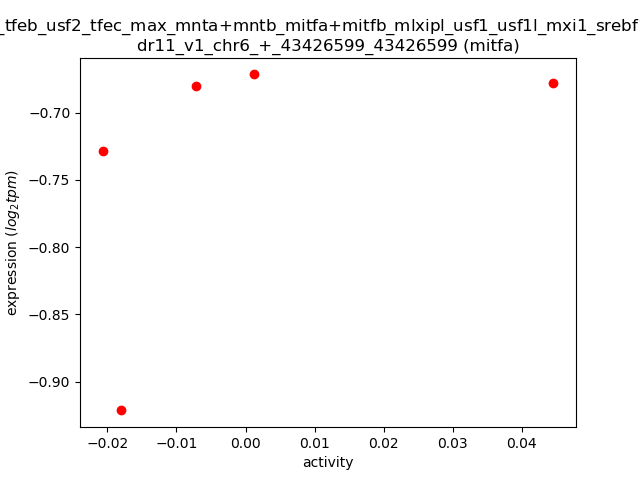
| mitfa | dr11_v1_chr6_+_43426599_43426599 | 0.48 | 4.1e-01 | Click! |
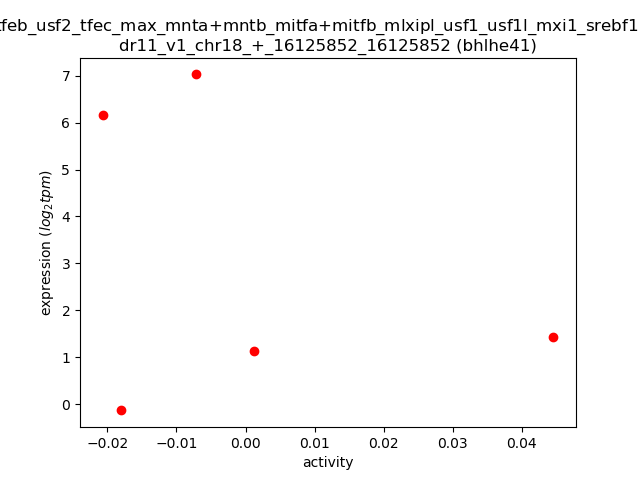
| bhlhe41 | dr11_v1_chr18_+_16125852_16125852 | -0.32 | 6.0e-01 | Click! |
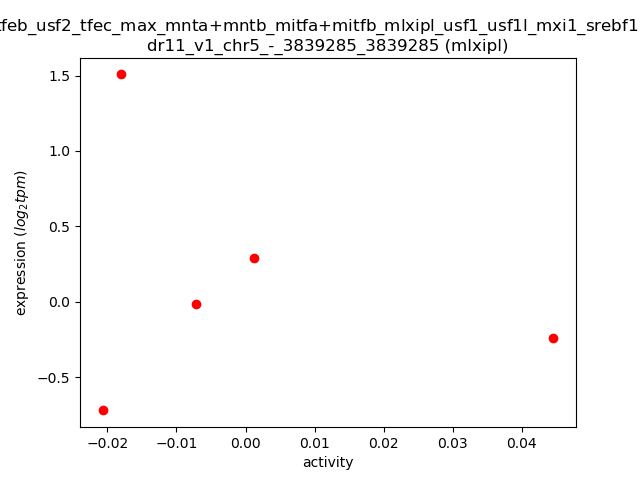
| mlxipl | dr11_v1_chr5_-_3839285_3839285 | -0.25 | 6.8e-01 | Click! |
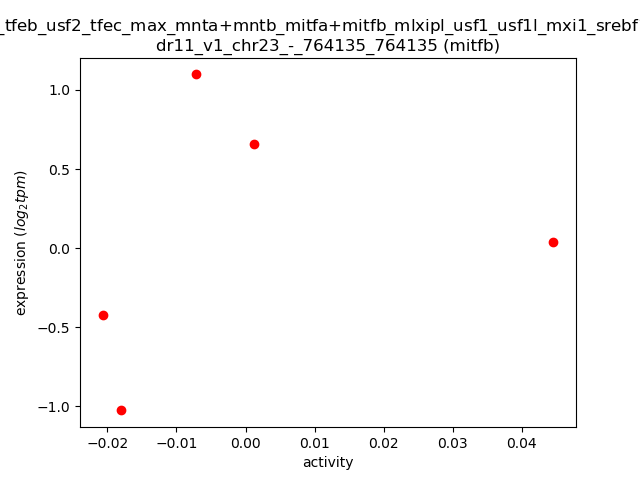
| mitfb | dr11_v1_chr23_-_764135_764135 | 0.25 | 6.9e-01 | Click! |
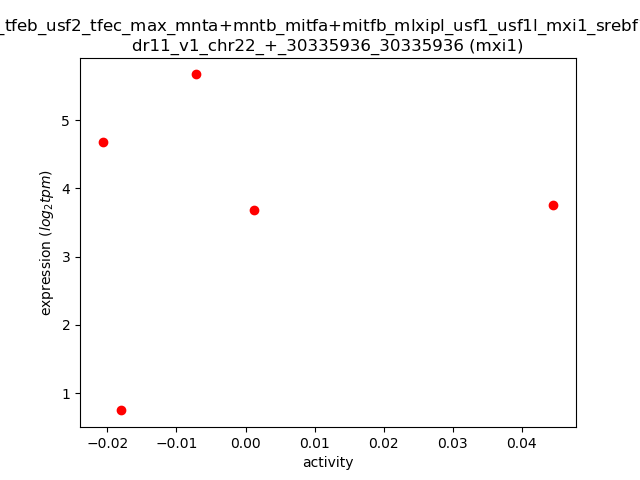
| mxi1 | dr11_v1_chr22_+_30335936_30335936 | 0.11 | 8.6e-01 | Click! |
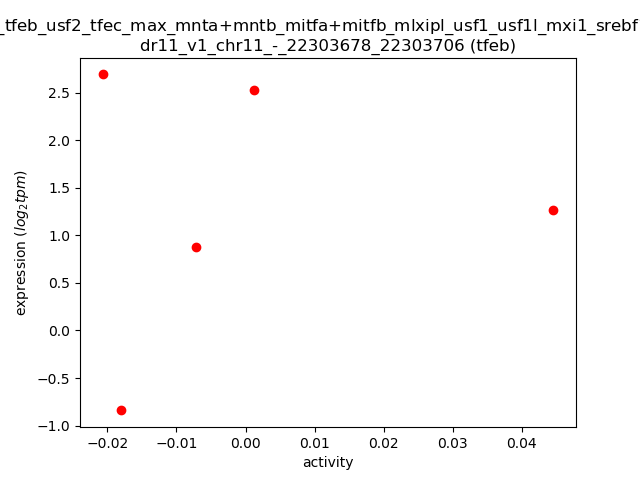
| tfeb | dr11_v1_chr11_-_22303678_22303706 | 0.08 | 8.9e-01 | Click! |
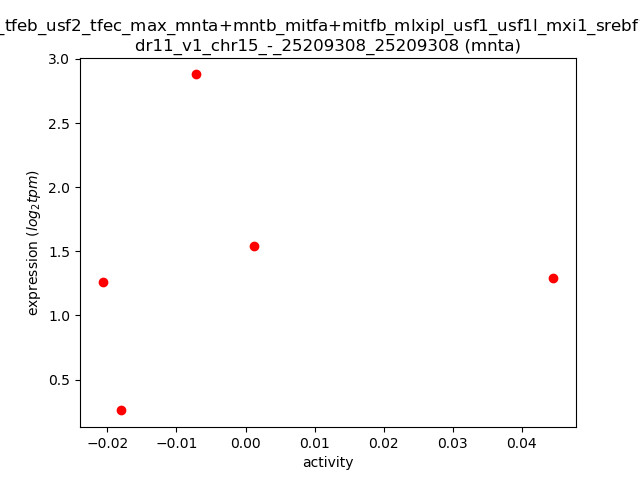
| mnta | dr11_v1_chr15_-_25209308_25209308 | 0.08 | 9.0e-01 | Click! |
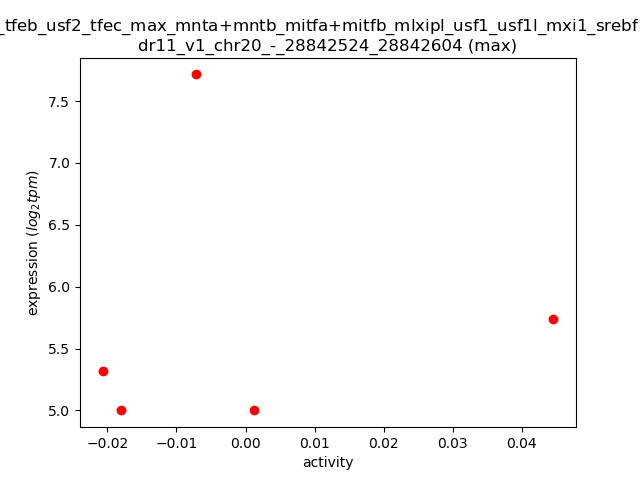
| max | dr11_v1_chr20_-_28842524_28842604 | 0.06 | 9.3e-01 | Click! |
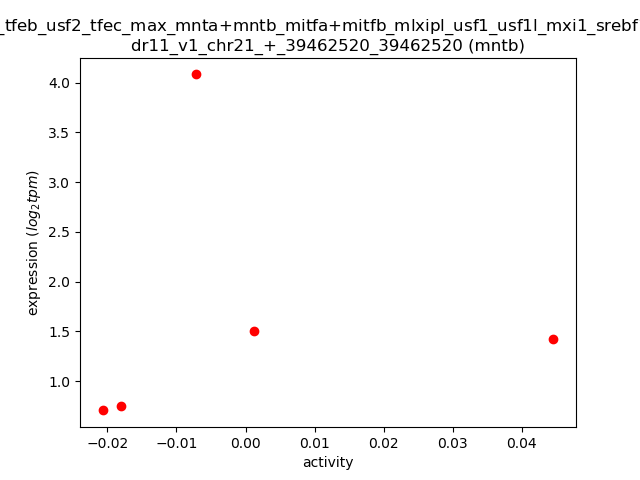
| mntb | dr11_v1_chr21_+_39462520_39462520 | 0.05 | 9.3e-01 | Click! |
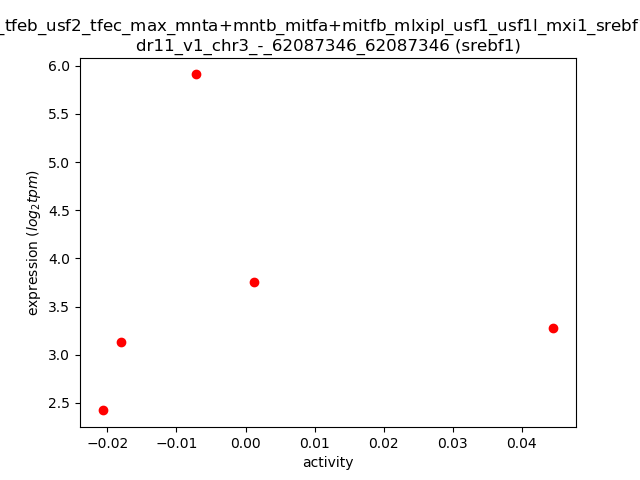
| srebf1 | dr11_v1_chr3_-_62087346_62087346 | 0.02 | 9.8e-01 | Click! |
Activity profile of bhlhe41_tfeb_usf2_tfec_max_mnta+mntb_mitfa+mitfb_mlxipl_usf1_usf1l_mxi1_srebf1 motif
Sorted Z-values of bhlhe41_tfeb_usf2_tfec_max_mnta+mntb_mitfa+mitfb_mlxipl_usf1_usf1l_mxi1_srebf1 motif
| Promoter | Log-likelihood | Transcript | Gene | Gene Info |
|---|---|---|---|---|
| chr12_+_20336070 | 1.06 |
ENSDART00000066385
|
zgc:163057
|
zgc:163057 |
| chr18_-_5509616 | 0.95 |
ENSDART00000142945
|
bloc1s6
|
biogenesis of lysosomal organelles complex-1, subunit 6, pallidin |
| chr20_-_39735952 | 0.90 |
ENSDART00000101049
ENSDART00000137485 ENSDART00000062402 |
tpd52l1
|
tumor protein D52-like 1 |
| chr6_+_12968101 | 0.81 |
ENSDART00000013781
|
mcm6
|
minichromosome maintenance complex component 6 |
| chr16_+_20895904 | 0.75 |
ENSDART00000052662
|
hoxa13b
|
homeobox A13b |
| chr20_-_37813863 | 0.72 |
ENSDART00000147529
|
batf3
|
basic leucine zipper transcription factor, ATF-like 3 |
| chr23_-_31913231 | 0.71 |
ENSDART00000146852
ENSDART00000085054 |
mtfr2
|
mitochondrial fission regulator 2 |
| chr7_-_8374950 | 0.66 |
ENSDART00000057101
|
aep1
|
aerolysin-like protein |
| chr7_-_67214972 | 0.66 |
ENSDART00000156861
|
swap70a
|
switching B cell complex subunit SWAP70a |
| chr5_-_4532516 | 0.64 |
ENSDART00000192398
|
cst14b.1
|
cystatin 14b, tandem duplicate 1 |
| chr18_+_44703343 | 0.62 |
ENSDART00000131510
|
b3gnt2l
|
UDP-GlcNAc:betaGal beta-1,3-N-acetylglucosaminyltransferase 2, like |
| chr9_-_12652984 | 0.62 |
ENSDART00000052256
|
sumo3b
|
small ubiquitin-like modifier 3b |
| chr5_+_27404946 | 0.59 |
ENSDART00000121886
ENSDART00000005025 |
hdr
|
hematopoietic death receptor |
| chr8_+_2487883 | 0.59 |
ENSDART00000101841
|
dynll1
|
dynein, light chain, LC8-type 1 |
| chr3_+_5083407 | 0.59 |
ENSDART00000146883
|
si:ch73-338o16.4
|
si:ch73-338o16.4 |
| chr18_-_3527988 | 0.57 |
ENSDART00000157669
|
capn5a
|
calpain 5a |
| chr9_-_5263947 | 0.56 |
ENSDART00000088342
|
cytip
|
cytohesin 1 interacting protein |
| chr18_-_3527686 | 0.55 |
ENSDART00000169049
|
capn5a
|
calpain 5a |
| chr23_+_31913292 | 0.55 |
ENSDART00000136910
|
armc1l
|
armadillo repeat containing 1, like |
| chr19_+_791538 | 0.55 |
ENSDART00000146554
ENSDART00000138406 |
tmem79a
|
transmembrane protein 79a |
| chr17_-_32426392 | 0.55 |
ENSDART00000148455
ENSDART00000149885 ENSDART00000179314 |
grhl1
|
grainyhead-like transcription factor 1 |
| chr17_-_114121 | 0.52 |
ENSDART00000172408
ENSDART00000157784 |
arhgap11a
|
Rho GTPase activating protein 11A |
| chr9_+_54178475 | 0.50 |
ENSDART00000104475
|
tmsb4x
|
thymosin, beta 4 x |
| chr23_+_32028574 | 0.50 |
ENSDART00000145501
ENSDART00000143121 ENSDART00000111877 |
tpx2
|
TPX2, microtubule-associated, homolog (Xenopus laevis) |
| chr19_-_7070691 | 0.49 |
ENSDART00000168755
|
tapbp.2
|
TAP binding protein (tapasin), tandem duplicate 2 |
| chr2_-_10386738 | 0.48 |
ENSDART00000016369
|
wls
|
wntless Wnt ligand secretion mediator |
| chr16_+_29514473 | 0.48 |
ENSDART00000034102
|
ctss2.2
|
cathepsin S, ortholog 2, tandem duplicate 2 |
| chr10_-_15053507 | 0.48 |
ENSDART00000157446
ENSDART00000170441 |
CLDN23
|
si:ch211-95j8.5 |
| chr8_-_31716302 | 0.48 |
ENSDART00000061832
|
si:dkey-46a10.3
|
si:dkey-46a10.3 |
| chr23_+_36095260 | 0.48 |
ENSDART00000127384
|
hoxc9a
|
homeobox C9a |
| chr20_+_38257766 | 0.48 |
ENSDART00000147485
ENSDART00000149160 |
ccl38.6
|
chemokine (C-C motif) ligand 38, duplicate 6 |
| chr2_+_16160906 | 0.47 |
ENSDART00000135783
|
selenoj
|
selenoprotein J |
| chr6_+_112579 | 0.47 |
ENSDART00000034505
|
ap1m2
|
adaptor-related protein complex 1, mu 2 subunit |
| chr13_+_25200105 | 0.46 |
ENSDART00000039640
|
ap3m1
|
adaptor-related protein complex 3, mu 1 subunit |
| chr8_-_39847791 | 0.45 |
ENSDART00000139224
ENSDART00000074163 |
zgc:174931
|
zgc:174931 |
| chr8_+_41229233 | 0.45 |
ENSDART00000131135
|
zgc:152830
|
zgc:152830 |
| chr7_-_19923249 | 0.44 |
ENSDART00000078694
|
zgc:110591
|
zgc:110591 |
| chr11_-_438492 | 0.44 |
ENSDART00000137121
ENSDART00000133784 |
nuf2
|
NUF2, NDC80 kinetochore complex component, homolog |
| chr16_-_26676685 | 0.43 |
ENSDART00000103431
|
esrp1
|
epithelial splicing regulatory protein 1 |
| chr25_+_245438 | 0.43 |
ENSDART00000004689
|
zgc:92481
|
zgc:92481 |
| chr1_-_59216197 | 0.42 |
ENSDART00000062426
|
lpar2b
|
lysophosphatidic acid receptor 2b |
| chr21_-_3700334 | 0.42 |
ENSDART00000137844
|
atp8b1
|
ATPase phospholipid transporting 8B1 |
| chr13_+_22717366 | 0.41 |
ENSDART00000134122
|
nfkb2
|
nuclear factor of kappa light polypeptide gene enhancer in B-cells 2 (p49/p100) |
| chr1_-_52447364 | 0.41 |
ENSDART00000140740
|
si:ch211-217k17.10
|
si:ch211-217k17.10 |
| chr15_-_17099560 | 0.40 |
ENSDART00000101724
|
mos
|
v-mos Moloney murine sarcoma viral oncogene homolog |
| chr10_+_16036573 | 0.40 |
ENSDART00000188757
|
lmnb1
|
lamin B1 |
| chr10_-_9089545 | 0.40 |
ENSDART00000080781
|
arl15b
|
ADP-ribosylation factor-like 15b |
| chr23_+_26079467 | 0.39 |
ENSDART00000129617
|
atp6ap1b
|
ATPase H+ transporting accessory protein 1b |
| chr5_+_26204561 | 0.39 |
ENSDART00000137178
|
marveld2b
|
MARVEL domain containing 2b |
| chr9_+_23770666 | 0.38 |
ENSDART00000182493
|
si:ch211-219a4.3
|
si:ch211-219a4.3 |
| chr18_-_15932704 | 0.38 |
ENSDART00000127769
|
plekhg7
|
pleckstrin homology domain containing, family G (with RhoGef domain) member 7 |
| chr23_-_5719453 | 0.37 |
ENSDART00000033093
|
lad1
|
ladinin |
| chr11_-_438294 | 0.37 |
ENSDART00000040812
|
nuf2
|
NUF2, NDC80 kinetochore complex component, homolog |
| chr18_-_1414760 | 0.37 |
ENSDART00000171881
|
PEPD
|
peptidase D |
| chr5_-_66798729 | 0.37 |
ENSDART00000113077
|
FERMT3 (1 of many)
|
im:7154036 |
| chr4_-_13921185 | 0.37 |
ENSDART00000143202
ENSDART00000080334 |
yaf2
|
YY1 associated factor 2 |
| chr7_-_55633475 | 0.37 |
ENSDART00000149478
|
galns
|
galactosamine (N-acetyl)-6-sulfatase |
| chr13_+_30696286 | 0.37 |
ENSDART00000192411
|
cxcl18a.1
|
chemokine (C-X-C motif) ligand 18a, duplicate 1 |
| chr16_+_41015163 | 0.37 |
ENSDART00000058586
|
dek
|
DEK proto-oncogene |
| chr10_-_2971407 | 0.36 |
ENSDART00000132526
|
marveld2a
|
MARVEL domain containing 2a |
| chr23_+_10146542 | 0.36 |
ENSDART00000048073
|
zgc:171775
|
zgc:171775 |
| chr23_+_17102960 | 0.36 |
ENSDART00000053414
|
commd7
|
COMM domain containing 7 |
| chr24_+_7631797 | 0.36 |
ENSDART00000187464
|
cavin1b
|
caveolae associated protein 1b |
| chr22_+_5120033 | 0.35 |
ENSDART00000169200
|
mibp
|
muscle-specific beta 1 integrin binding protein |
| chr14_-_15171435 | 0.35 |
ENSDART00000159148
ENSDART00000166622 |
si:dkey-77g12.1
|
si:dkey-77g12.1 |
| chr22_-_17677947 | 0.35 |
ENSDART00000139911
|
tjp3
|
tight junction protein 3 |
| chr20_+_7584211 | 0.35 |
ENSDART00000132481
ENSDART00000127975 ENSDART00000144551 |
bloc1s2
|
biogenesis of lysosomal organelles complex-1, subunit 2 |
| chr25_-_19608382 | 0.35 |
ENSDART00000022279
ENSDART00000135201 ENSDART00000147223 ENSDART00000190220 ENSDART00000184242 ENSDART00000166824 |
gtse1
|
G-2 and S-phase expressed 1 |
| chr8_+_17167876 | 0.35 |
ENSDART00000134665
|
cenph
|
centromere protein H |
| chr22_+_7439186 | 0.35 |
ENSDART00000190667
|
zgc:92041
|
zgc:92041 |
| chr14_+_52571134 | 0.34 |
ENSDART00000166708
|
rpl26
|
ribosomal protein L26 |
| chr10_+_36662640 | 0.34 |
ENSDART00000063359
|
ucp2
|
uncoupling protein 2 |
| chr11_-_44945636 | 0.34 |
ENSDART00000157658
|
orc2
|
origin recognition complex, subunit 2 |
| chr2_-_40191603 | 0.34 |
ENSDART00000180691
|
si:ch211-122l24.6
|
si:ch211-122l24.6 |
| chr10_+_41159241 | 0.34 |
ENSDART00000141657
|
anxa4
|
annexin A4 |
| chr23_+_44644911 | 0.34 |
ENSDART00000140799
|
zgc:85858
|
zgc:85858 |
| chr19_-_27334394 | 0.33 |
ENSDART00000052359
|
gtf2h4
|
general transcription factor IIH, polypeptide 4 |
| chr6_+_149405 | 0.33 |
ENSDART00000161154
|
fdx1l
|
ferredoxin 1-like |
| chr8_+_17168114 | 0.33 |
ENSDART00000183901
|
cenph
|
centromere protein H |
| chr13_+_7164345 | 0.33 |
ENSDART00000022051
|
gins1
|
GINS complex subunit 1 (Psf1 homolog) |
| chr21_-_39024754 | 0.33 |
ENSDART00000056878
|
traf4b
|
tnf receptor-associated factor 4b |
| chr6_-_10912424 | 0.32 |
ENSDART00000036456
|
cycsb
|
cytochrome c, somatic b |
| chr1_+_26605065 | 0.32 |
ENSDART00000011645
|
coro2a
|
coronin, actin binding protein, 2A |
| chr7_-_59054322 | 0.32 |
ENSDART00000165390
|
chmp5b
|
charged multivesicular body protein 5b |
| chr11_-_30636163 | 0.32 |
ENSDART00000140516
|
zgc:153665
|
zgc:153665 |
| chr14_+_23709543 | 0.32 |
ENSDART00000136909
|
gnpda1
|
glucosamine-6-phosphate deaminase 1 |
| chr20_+_46213553 | 0.32 |
ENSDART00000100532
|
stx7l
|
syntaxin 7-like |
| chr6_-_11073880 | 0.32 |
ENSDART00000035905
|
sumo3a
|
small ubiquitin-like modifier 3a |
| chr18_-_5527050 | 0.31 |
ENSDART00000145400
ENSDART00000132498 ENSDART00000146209 |
zgc:153317
|
zgc:153317 |
| chr16_-_5143124 | 0.31 |
ENSDART00000131876
ENSDART00000060630 |
ttk
|
ttk protein kinase |
| chr1_-_43727012 | 0.31 |
ENSDART00000181064
|
bdh2
|
3-hydroxybutyrate dehydrogenase, type 2 |
| chr23_+_28374458 | 0.31 |
ENSDART00000140058
ENSDART00000144240 |
zgc:153867
|
zgc:153867 |
| chr5_-_54714789 | 0.31 |
ENSDART00000063357
|
ccnb1
|
cyclin B1 |
| chr20_-_25626198 | 0.30 |
ENSDART00000126716
|
paics
|
phosphoribosylaminoimidazole carboxylase, phosphoribosylaminoimidazole succinocarboxamide synthetase |
| chr25_+_16601839 | 0.30 |
ENSDART00000008986
|
atp6v1e1a
|
ATPase H+ transporting V1 subunit E1a |
| chr20_-_25626428 | 0.30 |
ENSDART00000136475
|
paics
|
phosphoribosylaminoimidazole carboxylase, phosphoribosylaminoimidazole succinocarboxamide synthetase |
| chr8_-_21372446 | 0.30 |
ENSDART00000061481
ENSDART00000079293 |
ela2l
|
elastase 2 like |
| chr5_+_31811662 | 0.29 |
ENSDART00000023463
|
uap1l1
|
UDP-N-acetylglucosamine pyrophosphorylase 1, like 1 |
| chr20_+_32406011 | 0.29 |
ENSDART00000018640
ENSDART00000137910 |
snx3
|
sorting nexin 3 |
| chr7_+_49654588 | 0.29 |
ENSDART00000025451
ENSDART00000141934 |
rassf7b
|
Ras association (RalGDS/AF-6) domain family (N-terminal) member 7b |
| chr18_+_14693682 | 0.29 |
ENSDART00000132249
|
uri1
|
URI1, prefoldin-like chaperone |
| chr19_+_48176745 | 0.29 |
ENSDART00000164963
|
prdm1b
|
PR domain containing 1b, with ZNF domain |
| chr12_+_13282797 | 0.29 |
ENSDART00000137757
ENSDART00000152397 |
irf9
|
interferon regulatory factor 9 |
| chr3_-_4552590 | 0.29 |
ENSDART00000043148
ENSDART00000132224 |
ftr43
|
finTRIM family, member 43 |
| chr2_+_30787128 | 0.29 |
ENSDART00000189233
|
atp6v1h
|
ATPase H+ transporting V1 subunit H |
| chr12_-_4243268 | 0.28 |
ENSDART00000131275
|
zgc:92313
|
zgc:92313 |
| chr14_-_36437249 | 0.28 |
ENSDART00000016728
|
aga
|
aspartylglucosaminidase |
| chr11_+_25328199 | 0.28 |
ENSDART00000141478
ENSDART00000112209 |
fam83d
|
family with sequence similarity 83, member D |
| chr23_+_45025909 | 0.28 |
ENSDART00000188105
|
hmgb2b
|
high mobility group box 2b |
| chr8_+_7316568 | 0.28 |
ENSDART00000140874
|
selenoh
|
selenoprotein H |
| chr1_+_54043563 | 0.28 |
ENSDART00000149760
|
triobpa
|
TRIO and F-actin binding protein a |
| chr13_+_29292011 | 0.28 |
ENSDART00000115023
|
parga
|
poly (ADP-ribose) glycohydrolase a |
| chr20_+_15565926 | 0.28 |
ENSDART00000063917
|
si:dkey-86e18.1
|
si:dkey-86e18.1 |
| chr5_-_54714525 | 0.28 |
ENSDART00000150138
ENSDART00000150070 |
ccnb1
|
cyclin B1 |
| chr19_-_32500373 | 0.27 |
ENSDART00000052104
|
fuca1.1
|
alpha-L-fucosidase 1, tandem duplicate 1 |
| chr24_-_16917086 | 0.27 |
ENSDART00000110715
|
cmbl
|
carboxymethylenebutenolidase homolog (Pseudomonas) |
| chr17_-_51224800 | 0.27 |
ENSDART00000150089
|
psen1
|
presenilin 1 |
| chr2_-_10877765 | 0.27 |
ENSDART00000100607
|
cdc7
|
cell division cycle 7 homolog (S. cerevisiae) |
| chr13_-_37647209 | 0.27 |
ENSDART00000189102
|
si:dkey-188i13.10
|
si:dkey-188i13.10 |
| chr13_-_45201300 | 0.27 |
ENSDART00000074750
ENSDART00000180265 |
runx3
|
runt-related transcription factor 3 |
| chr21_-_15674802 | 0.27 |
ENSDART00000136666
|
mmp11b
|
matrix metallopeptidase 11b |
| chr22_-_27115241 | 0.27 |
ENSDART00000019442
|
xpnpep1
|
X-prolyl aminopeptidase (aminopeptidase P) 1, soluble |
| chr9_-_2572790 | 0.27 |
ENSDART00000135076
ENSDART00000016710 |
scrn3
|
secernin 3 |
| chr16_-_45178430 | 0.26 |
ENSDART00000165186
|
si:dkey-33i11.9
|
si:dkey-33i11.9 |
| chr2_+_30786773 | 0.26 |
ENSDART00000019029
ENSDART00000145681 |
atp6v1h
|
ATPase H+ transporting V1 subunit H |
| chr7_-_32629458 | 0.26 |
ENSDART00000001376
|
arl14ep
|
ADP-ribosylation factor-like 14 effector protein |
| chr22_-_10165446 | 0.26 |
ENSDART00000142012
|
rbck1
|
RanBP-type and C3HC4-type zinc finger containing 1 |
| chr11_+_42556395 | 0.26 |
ENSDART00000039206
|
rps23
|
ribosomal protein S23 |
| chr9_+_563547 | 0.26 |
ENSDART00000162761
|
CU984600.2
|
|
| chr17_+_32622933 | 0.25 |
ENSDART00000077418
|
ctsba
|
cathepsin Ba |
| chr25_+_10547228 | 0.25 |
ENSDART00000067678
|
zgc:110339
|
zgc:110339 |
| chr18_+_26422124 | 0.25 |
ENSDART00000060245
|
ctsh
|
cathepsin H |
| chr14_+_23709134 | 0.25 |
ENSDART00000191162
ENSDART00000179754 ENSDART00000054266 |
gnpda1
|
glucosamine-6-phosphate deaminase 1 |
| chr14_+_21685537 | 0.25 |
ENSDART00000128717
ENSDART00000144503 |
ran
|
RAN, member RAS oncogene family |
| chr17_+_44441042 | 0.25 |
ENSDART00000142123
|
ap5m1
|
adaptor-related protein complex 5, mu 1 subunit |
| chr17_-_37395460 | 0.25 |
ENSDART00000148160
ENSDART00000075975 |
crip1
|
cysteine-rich protein 1 |
| chr3_+_36617024 | 0.25 |
ENSDART00000189957
|
pdxdc1
|
pyridoxal-dependent decarboxylase domain containing 1 |
| chr4_-_7673165 | 0.25 |
ENSDART00000028171
|
lta4h
|
leukotriene A4 hydrolase |
| chr21_+_7298687 | 0.25 |
ENSDART00000187746
|
CU929160.1
|
|
| chr4_-_992063 | 0.24 |
ENSDART00000181630
ENSDART00000183898 ENSDART00000160902 |
naga
|
N-acetylgalactosaminidase, alpha |
| chr7_+_19817306 | 0.24 |
ENSDART00000044425
|
BX957278.1
|
|
| chr5_+_20366453 | 0.24 |
ENSDART00000193141
|
coro1ca
|
coronin, actin binding protein, 1Ca |
| chr5_+_57320113 | 0.24 |
ENSDART00000036331
|
atp6v1g1
|
ATPase H+ transporting V1 subunit G1 |
| chr14_-_35414559 | 0.24 |
ENSDART00000145033
|
rnaseh2c
|
ribonuclease H2, subunit C |
| chr1_+_10318089 | 0.24 |
ENSDART00000029774
|
pip4p1b
|
phosphatidylinositol-4,5-bisphosphate 4-phosphatase 1b |
| chr8_-_25817106 | 0.24 |
ENSDART00000099364
|
taf10
|
TAF10 RNA polymerase II, TATA box binding protein (TBP)-associated factor |
| chr20_-_25631256 | 0.24 |
ENSDART00000048164
|
paics
|
phosphoribosylaminoimidazole carboxylase, phosphoribosylaminoimidazole succinocarboxamide synthetase |
| chr16_+_23961276 | 0.24 |
ENSDART00000192754
|
apoeb
|
apolipoprotein Eb |
| chr3_-_6441619 | 0.24 |
ENSDART00000157771
ENSDART00000166758 |
sumo2b
|
small ubiquitin-like modifier 2b |
| chr7_+_26466826 | 0.24 |
ENSDART00000058908
|
mpdu1b
|
mannose-P-dolichol utilization defect 1b |
| chr24_-_27419198 | 0.23 |
ENSDART00000141124
|
ccl34b.4
|
chemokine (C-C motif) ligand 34b, duplicate 4 |
| chr5_-_12560569 | 0.23 |
ENSDART00000133587
|
wsb2
|
WD repeat and SOCS box containing 2 |
| chr15_+_1534644 | 0.23 |
ENSDART00000130413
|
smc4
|
structural maintenance of chromosomes 4 |
| chr16_+_23960933 | 0.23 |
ENSDART00000146077
|
apoeb
|
apolipoprotein Eb |
| chr25_-_6447835 | 0.23 |
ENSDART00000012820
|
snupn
|
snurportin 1 |
| chr10_-_15644904 | 0.23 |
ENSDART00000138389
ENSDART00000101191 ENSDART00000186559 ENSDART00000122170 |
smc5
|
structural maintenance of chromosomes 5 |
| chr4_-_5831522 | 0.23 |
ENSDART00000008898
|
foxm1
|
forkhead box M1 |
| chr20_-_20821783 | 0.23 |
ENSDART00000152577
ENSDART00000027603 ENSDART00000145601 |
ckbb
|
creatine kinase, brain b |
| chr16_+_33143503 | 0.23 |
ENSDART00000058471
ENSDART00000179385 |
rhbdl2
|
rhomboid, veinlet-like 2 (Drosophila) |
| chr1_-_43727418 | 0.22 |
ENSDART00000133715
ENSDART00000074597 ENSDART00000132542 ENSDART00000181792 |
bdh2
SLC9B2
|
3-hydroxybutyrate dehydrogenase, type 2 si:dkey-162b23.4 |
| chr23_+_36063599 | 0.22 |
ENSDART00000103147
|
hoxc12a
|
homeobox C12a |
| chr23_-_29556844 | 0.22 |
ENSDART00000138021
|
rbp7a
|
retinol binding protein 7a, cellular |
| chr7_+_57109214 | 0.22 |
ENSDART00000135068
ENSDART00000098412 |
enosf1
|
enolase superfamily member 1 |
| chr12_-_9516981 | 0.22 |
ENSDART00000106285
|
si:ch211-207i20.3
|
si:ch211-207i20.3 |
| chr25_+_34014523 | 0.22 |
ENSDART00000182856
|
anxa2a
|
annexin A2a |
| chr19_+_19772765 | 0.22 |
ENSDART00000182028
ENSDART00000161019 |
hoxa3a
|
homeobox A3a |
| chr16_+_12022543 | 0.22 |
ENSDART00000012673
|
gnb3a
|
guanine nucleotide binding protein (G protein), beta polypeptide 3a |
| chr5_-_67365006 | 0.22 |
ENSDART00000136116
|
unga
|
uracil DNA glycosylase a |
| chr14_+_94946 | 0.22 |
ENSDART00000165766
ENSDART00000163778 |
mcm7
|
minichromosome maintenance complex component 7 |
| chr6_-_55423220 | 0.22 |
ENSDART00000158929
|
ctsa
|
cathepsin A |
| chr10_-_29768556 | 0.22 |
ENSDART00000052787
|
vps11
|
vacuolar protein sorting 11 |
| chr10_+_16036246 | 0.21 |
ENSDART00000141586
ENSDART00000135868 ENSDART00000065037 ENSDART00000124502 |
lmnb1
|
lamin B1 |
| chr3_-_18805225 | 0.21 |
ENSDART00000133471
ENSDART00000131758 |
msrb1a
|
methionine sulfoxide reductase B1a |
| chr24_-_7995748 | 0.21 |
ENSDART00000158566
|
bloc1s5
|
biogenesis of lysosomal organelles complex-1, subunit 5, muted |
| chr10_+_20070178 | 0.21 |
ENSDART00000027612
ENSDART00000145264 ENSDART00000172713 |
xpo7
|
exportin 7 |
| chr23_-_19486571 | 0.21 |
ENSDART00000009092
|
fam208ab
|
family with sequence similarity 208, member Ab |
| chr25_-_6223567 | 0.21 |
ENSDART00000067512
|
psma4
|
proteasome subunit alpha 4 |
| chr1_-_59252973 | 0.21 |
ENSDART00000167061
|
si:ch1073-286c18.5
|
si:ch1073-286c18.5 |
| chr7_+_22293894 | 0.21 |
ENSDART00000056790
|
tmem256
|
transmembrane protein 256 |
| chr13_+_25199849 | 0.21 |
ENSDART00000139209
ENSDART00000130876 |
ap3m1
|
adaptor-related protein complex 3, mu 1 subunit |
| chr1_+_34496855 | 0.21 |
ENSDART00000012873
|
klf12a
|
Kruppel-like factor 12a |
| chr11_+_6281647 | 0.21 |
ENSDART00000002459
|
ctns
|
cystinosin, lysosomal cystine transporter |
| chr6_-_37422841 | 0.21 |
ENSDART00000138351
|
cth
|
cystathionase (cystathionine gamma-lyase) |
| chr15_-_28596507 | 0.21 |
ENSDART00000156800
|
si:ch211-225b7.5
|
si:ch211-225b7.5 |
| chr18_-_26894732 | 0.21 |
ENSDART00000147735
ENSDART00000188938 |
BX470164.1
si:dkey-24l11.2
|
si:dkey-24l11.2 |
| chr7_-_33351485 | 0.20 |
ENSDART00000146420
|
anp32a
|
acidic (leucine-rich) nuclear phosphoprotein 32 family, member A |
| chr8_+_13106760 | 0.20 |
ENSDART00000029308
|
itgb4
|
integrin, beta 4 |
| chr20_+_2589414 | 0.20 |
ENSDART00000043626
|
il20ra
|
interleukin 20 receptor, alpha |
| chr15_+_19838458 | 0.20 |
ENSDART00000101204
|
alcamb
|
activated leukocyte cell adhesion molecule b |
| chr8_+_13389115 | 0.20 |
ENSDART00000184428
ENSDART00000154266 ENSDART00000049469 |
jak3
|
Janus kinase 3 (a protein tyrosine kinase, leukocyte) |
| chr15_-_43327911 | 0.20 |
ENSDART00000077386
|
prss16
|
protease, serine, 16 (thymus) |
| chr14_+_16287968 | 0.20 |
ENSDART00000106593
|
prpf19
|
pre-mRNA processing factor 19 |
| chr3_+_34120191 | 0.20 |
ENSDART00000020017
ENSDART00000151700 |
aldh3b1
|
aldehyde dehydrogenase 3 family, member B1 |
| chr9_-_27868267 | 0.20 |
ENSDART00000079502
|
dbr1
|
debranching RNA lariats 1 |
| chr4_-_17669881 | 0.20 |
ENSDART00000066997
|
dram1
|
DNA-damage regulated autophagy modulator 1 |
| chr3_-_15734358 | 0.19 |
ENSDART00000137325
|
mvp
|
major vault protein |
| chr15_-_43625549 | 0.19 |
ENSDART00000168589
|
ctsc
|
cathepsin C |
| chr9_-_11587070 | 0.19 |
ENSDART00000030995
|
umps
|
uridine monophosphate synthetase |
| chr5_+_50913357 | 0.19 |
ENSDART00000092938
|
col4a3bpa
|
collagen, type IV, alpha 3 (Goodpasture antigen) binding protein a |
| chr9_+_54686686 | 0.19 |
ENSDART00000066198
|
rab9a
|
RAB9A, member RAS oncogene family |
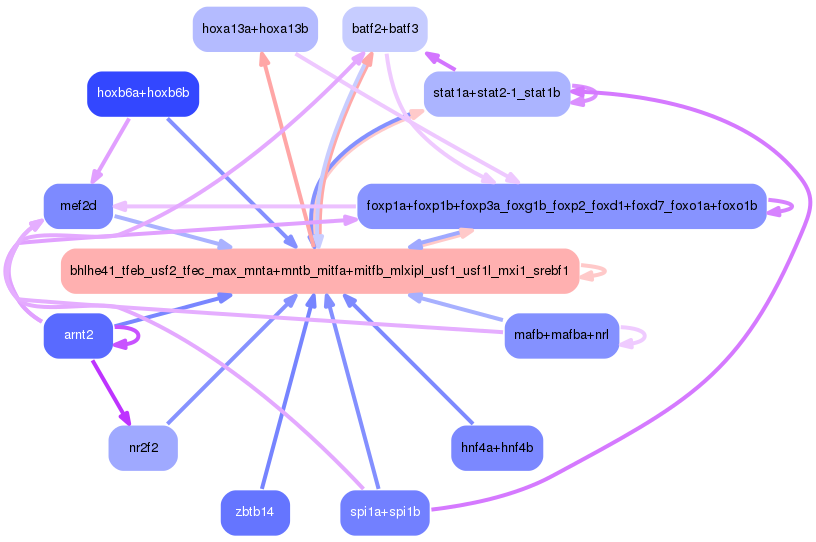
Network of associatons between targets according to the STRING database.

First level regulatory network of bhlhe41_tfeb_usf2_tfec_max_mnta+mntb_mitfa+mitfb_mlxipl_usf1_usf1l_mxi1_srebf1
Gene Ontology Analysis
Gene overrepresentation in biological process category:
| Log-likelihood per target | Total log-likelihood | Term | Description |
|---|---|---|---|
| 0.2 | 0.7 | GO:1902102 | meiotic cell cycle phase transition(GO:0044771) metaphase/anaphase transition of meiotic cell cycle(GO:0044785) regulation of meiotic cell cycle phase transition(GO:1901993) negative regulation of meiotic cell cycle phase transition(GO:1901994) regulation of metaphase/anaphase transition of meiotic cell cycle(GO:1902102) negative regulation of metaphase/anaphase transition of meiotic cell cycle(GO:1902103) regulation of meiotic chromosome separation(GO:1905132) negative regulation of meiotic chromosome separation(GO:1905133) |
| 0.2 | 0.7 | GO:0071830 | chylomicron remnant clearance(GO:0034382) triglyceride-rich lipoprotein particle clearance(GO:0071830) intermediate-density lipoprotein particle clearance(GO:0071831) |
| 0.2 | 0.6 | GO:0006041 | glucosamine metabolic process(GO:0006041) glucosamine catabolic process(GO:0006043) |
| 0.2 | 0.7 | GO:0061015 | RNA import into nucleus(GO:0006404) snRNA import into nucleus(GO:0061015) |
| 0.2 | 0.5 | GO:0061355 | Wnt protein secretion(GO:0061355) |
| 0.1 | 0.6 | GO:0036462 | TRAIL-activated apoptotic signaling pathway(GO:0036462) |
| 0.1 | 1.4 | GO:0006189 | 'de novo' IMP biosynthetic process(GO:0006189) |
| 0.1 | 0.5 | GO:1901492 | positive regulation of lymphangiogenesis(GO:1901492) |
| 0.1 | 1.2 | GO:1902299 | pre-replicative complex assembly involved in nuclear cell cycle DNA replication(GO:0006267) pre-replicative complex assembly(GO:0036388) pre-replicative complex assembly involved in cell cycle DNA replication(GO:1902299) |
| 0.1 | 0.3 | GO:0019418 | sulfide oxidation(GO:0019418) sulfide oxidation, using sulfide:quinone oxidoreductase(GO:0070221) |
| 0.1 | 0.3 | GO:0000350 | generation of catalytic spliceosome for second transesterification step(GO:0000350) |
| 0.1 | 0.6 | GO:0048069 | eye pigmentation(GO:0048069) |
| 0.1 | 0.5 | GO:1901207 | regulation of heart looping(GO:1901207) |
| 0.1 | 0.5 | GO:0003334 | keratinocyte development(GO:0003334) |
| 0.1 | 0.8 | GO:0051315 | attachment of mitotic spindle microtubules to kinetochore(GO:0051315) |
| 0.1 | 0.5 | GO:0019184 | nonribosomal peptide biosynthetic process(GO:0019184) |
| 0.1 | 0.2 | GO:0071236 | cellular response to antibiotic(GO:0071236) cellular response to toxic substance(GO:0097237) |
| 0.1 | 0.5 | GO:2000580 | positive regulation of microtubule motor activity(GO:2000576) regulation of ATP-dependent microtubule motor activity, plus-end-directed(GO:2000580) positive regulation of ATP-dependent microtubule motor activity, plus-end-directed(GO:2000582) |
| 0.1 | 0.6 | GO:0016137 | glycoside metabolic process(GO:0016137) glycoside catabolic process(GO:0016139) |
| 0.1 | 0.3 | GO:0007250 | activation of NF-kappaB-inducing kinase activity(GO:0007250) |
| 0.1 | 0.2 | GO:0070072 | proton-transporting V-type ATPase complex assembly(GO:0070070) vacuolar proton-transporting V-type ATPase complex assembly(GO:0070072) |
| 0.1 | 0.3 | GO:0051563 | smooth endoplasmic reticulum calcium ion homeostasis(GO:0051563) |
| 0.1 | 0.5 | GO:0060017 | parathyroid gland development(GO:0060017) |
| 0.1 | 0.5 | GO:0060036 | notochord cell vacuolation(GO:0060036) |
| 0.1 | 0.2 | GO:0000393 | spliceosomal conformational changes to generate catalytic conformation(GO:0000393) |
| 0.1 | 0.6 | GO:0007080 | mitotic metaphase plate congression(GO:0007080) |
| 0.1 | 0.3 | GO:0097510 | base-excision repair, AP site formation via deaminated base removal(GO:0097510) |
| 0.1 | 0.2 | GO:0090148 | membrane fission(GO:0090148) |
| 0.1 | 0.2 | GO:0009162 | deoxyribonucleoside monophosphate metabolic process(GO:0009162) |
| 0.1 | 0.5 | GO:0042989 | sequestering of actin monomers(GO:0042989) |
| 0.1 | 0.2 | GO:0006097 | glyoxylate cycle(GO:0006097) |
| 0.1 | 1.0 | GO:0015671 | oxygen transport(GO:0015671) |
| 0.1 | 0.3 | GO:0097039 | protein linear polyubiquitination(GO:0097039) |
| 0.1 | 0.2 | GO:0006168 | adenine salvage(GO:0006168) adenine metabolic process(GO:0046083) adenine biosynthetic process(GO:0046084) |
| 0.0 | 0.2 | GO:0031584 | activation of phospholipase D activity(GO:0031584) |
| 0.0 | 0.2 | GO:0006691 | leukotriene metabolic process(GO:0006691) leukotriene biosynthetic process(GO:0019370) |
| 0.0 | 0.3 | GO:0051310 | metaphase plate congression(GO:0051310) |
| 0.0 | 0.2 | GO:1903232 | melanosome assembly(GO:1903232) |
| 0.0 | 0.9 | GO:2001235 | positive regulation of apoptotic signaling pathway(GO:2001235) |
| 0.0 | 0.4 | GO:1902038 | positive regulation of hematopoietic stem cell differentiation(GO:1902038) |
| 0.0 | 0.1 | GO:0006864 | pyrimidine nucleotide transport(GO:0006864) mitochondrial pyrimidine nucleotide import(GO:1990519) |
| 0.0 | 0.3 | GO:0000727 | double-strand break repair via break-induced replication(GO:0000727) |
| 0.0 | 0.1 | GO:0019852 | L-ascorbic acid metabolic process(GO:0019852) water-soluble vitamin biosynthetic process(GO:0042364) |
| 0.0 | 0.2 | GO:0034219 | carbohydrate transmembrane transport(GO:0034219) |
| 0.0 | 0.1 | GO:0015760 | hexose phosphate transport(GO:0015712) glucose-6-phosphate transport(GO:0015760) |
| 0.0 | 0.5 | GO:0060236 | regulation of mitotic spindle organization(GO:0060236) |
| 0.0 | 0.6 | GO:0051383 | kinetochore organization(GO:0051383) |
| 0.0 | 0.2 | GO:0030101 | natural killer cell activation(GO:0030101) |
| 0.0 | 0.5 | GO:0033260 | nuclear DNA replication(GO:0033260) |
| 0.0 | 0.3 | GO:1900026 | positive regulation of substrate adhesion-dependent cell spreading(GO:1900026) |
| 0.0 | 0.3 | GO:0006361 | transcription initiation from RNA polymerase I promoter(GO:0006361) |
| 0.0 | 0.1 | GO:0006004 | fucose metabolic process(GO:0006004) |
| 0.0 | 0.4 | GO:0006048 | UDP-N-acetylglucosamine biosynthetic process(GO:0006048) |
| 0.0 | 0.1 | GO:0009838 | abscission(GO:0009838) mitotic cytokinesis checkpoint(GO:0044878) |
| 0.0 | 0.4 | GO:0032088 | negative regulation of NF-kappaB transcription factor activity(GO:0032088) |
| 0.0 | 0.5 | GO:0030311 | poly-N-acetyllactosamine metabolic process(GO:0030309) poly-N-acetyllactosamine biosynthetic process(GO:0030311) |
| 0.0 | 0.2 | GO:0048260 | positive regulation of receptor-mediated endocytosis(GO:0048260) protein localization to early endosome(GO:1902946) |
| 0.0 | 0.1 | GO:0000379 | tRNA-type intron splice site recognition and cleavage(GO:0000379) |
| 0.0 | 0.1 | GO:1903504 | regulation of spindle checkpoint(GO:0090231) regulation of mitotic cell cycle spindle assembly checkpoint(GO:0090266) regulation of mitotic spindle checkpoint(GO:1903504) |
| 0.0 | 0.2 | GO:1902369 | negative regulation of RNA catabolic process(GO:1902369) |
| 0.0 | 0.3 | GO:0009263 | deoxyribonucleotide biosynthetic process(GO:0009263) |
| 0.0 | 0.1 | GO:0006272 | leading strand elongation(GO:0006272) |
| 0.0 | 0.4 | GO:0030104 | water homeostasis(GO:0030104) |
| 0.0 | 0.1 | GO:0002532 | production of molecular mediator involved in inflammatory response(GO:0002532) |
| 0.0 | 0.2 | GO:0019509 | L-methionine biosynthetic process from methylthioadenosine(GO:0019509) amino acid salvage(GO:0043102) L-methionine biosynthetic process(GO:0071265) L-methionine salvage(GO:0071267) |
| 0.0 | 0.2 | GO:0009312 | oligosaccharide biosynthetic process(GO:0009312) |
| 0.0 | 0.0 | GO:0071514 | genetic imprinting(GO:0071514) |
| 0.0 | 0.9 | GO:0016925 | protein sumoylation(GO:0016925) |
| 0.0 | 0.1 | GO:0000973 | posttranscriptional tethering of RNA polymerase II gene DNA at nuclear periphery(GO:0000973) |
| 0.0 | 0.1 | GO:0015670 | carbon dioxide transport(GO:0015670) |
| 0.0 | 0.1 | GO:0098535 | de novo centriole assembly(GO:0098535) |
| 0.0 | 0.3 | GO:0002483 | antigen processing and presentation of endogenous peptide antigen(GO:0002483) antigen processing and presentation of endogenous antigen(GO:0019883) antigen processing and presentation of endogenous peptide antigen via MHC class I(GO:0019885) |
| 0.0 | 0.2 | GO:0006177 | GMP biosynthetic process(GO:0006177) GMP metabolic process(GO:0046037) |
| 0.0 | 0.2 | GO:0072488 | ammonium transmembrane transport(GO:0072488) |
| 0.0 | 0.4 | GO:0006689 | ganglioside catabolic process(GO:0006689) |
| 0.0 | 0.2 | GO:0021885 | forebrain cell migration(GO:0021885) |
| 0.0 | 0.1 | GO:0048389 | intermediate mesoderm development(GO:0048389) |
| 0.0 | 0.4 | GO:0036353 | histone H2A-K119 monoubiquitination(GO:0036353) |
| 0.0 | 0.1 | GO:1904398 | positive regulation of neuromuscular junction development(GO:1904398) |
| 0.0 | 0.1 | GO:0044205 | 'de novo' UMP biosynthetic process(GO:0044205) |
| 0.0 | 0.2 | GO:0034498 | early endosome to Golgi transport(GO:0034498) |
| 0.0 | 1.1 | GO:0048247 | lymphocyte chemotaxis(GO:0048247) |
| 0.0 | 0.1 | GO:1903426 | regulation of reactive oxygen species biosynthetic process(GO:1903426) |
| 0.0 | 0.3 | GO:0006517 | protein deglycosylation(GO:0006517) |
| 0.0 | 0.1 | GO:0071169 | establishment of protein localization to chromosome(GO:0070199) establishment of protein localization to chromatin(GO:0071169) |
| 0.0 | 0.2 | GO:0006398 | mRNA 3'-end processing by stem-loop binding and cleavage(GO:0006398) |
| 0.0 | 0.1 | GO:0060334 | regulation of response to interferon-gamma(GO:0060330) regulation of interferon-gamma-mediated signaling pathway(GO:0060334) |
| 0.0 | 0.1 | GO:0002432 | granuloma formation(GO:0002432) chronic inflammatory response(GO:0002544) regulation of granuloma formation(GO:0002631) regulation of chronic inflammatory response(GO:0002676) |
| 0.0 | 0.1 | GO:0055091 | phospholipid homeostasis(GO:0055091) |
| 0.0 | 0.4 | GO:0006270 | DNA replication initiation(GO:0006270) |
| 0.0 | 0.1 | GO:0051037 | histone displacement(GO:0001207) regulation of transcription involved in meiotic cell cycle(GO:0051037) positive regulation of transcription involved in meiotic cell cycle(GO:0051039) |
| 0.0 | 0.1 | GO:0016446 | somatic diversification of immune receptors via somatic mutation(GO:0002566) somatic hypermutation of immunoglobulin genes(GO:0016446) |
| 0.0 | 0.2 | GO:0019346 | homoserine metabolic process(GO:0009092) cysteine biosynthetic process via cystathionine(GO:0019343) cysteine biosynthetic process(GO:0019344) transsulfuration(GO:0019346) |
| 0.0 | 0.1 | GO:0042256 | mature ribosome assembly(GO:0042256) assembly of large subunit precursor of preribosome(GO:1902626) |
| 0.0 | 0.1 | GO:0031120 | snRNA pseudouridine synthesis(GO:0031120) |
| 0.0 | 0.4 | GO:0034243 | regulation of transcription elongation from RNA polymerase II promoter(GO:0034243) |
| 0.0 | 0.2 | GO:2001045 | negative regulation of integrin-mediated signaling pathway(GO:2001045) |
| 0.0 | 0.2 | GO:0070293 | renal absorption(GO:0070293) |
| 0.0 | 0.2 | GO:2001271 | negative regulation of execution phase of apoptosis(GO:1900118) regulation of cysteine-type endopeptidase activity involved in execution phase of apoptosis(GO:2001270) negative regulation of cysteine-type endopeptidase activity involved in execution phase of apoptosis(GO:2001271) |
| 0.0 | 0.1 | GO:2000009 | regulation of protein localization to cell surface(GO:2000008) negative regulation of protein localization to cell surface(GO:2000009) |
| 0.0 | 0.1 | GO:0034244 | negative regulation of DNA-templated transcription, elongation(GO:0032785) negative regulation of transcription elongation from RNA polymerase II promoter(GO:0034244) |
| 0.0 | 0.3 | GO:0007076 | mitotic chromosome condensation(GO:0007076) |
| 0.0 | 0.2 | GO:1990845 | adaptive thermogenesis(GO:1990845) |
| 0.0 | 0.1 | GO:0002369 | T cell cytokine production(GO:0002369) |
| 0.0 | 0.3 | GO:0070816 | phosphorylation of RNA polymerase II C-terminal domain(GO:0070816) |
| 0.0 | 0.2 | GO:0071557 | histone H3-K27 demethylation(GO:0071557) |
| 0.0 | 0.8 | GO:0000266 | mitochondrial fission(GO:0000266) |
| 0.0 | 0.1 | GO:0006384 | transcription initiation from RNA polymerase III promoter(GO:0006384) |
| 0.0 | 0.1 | GO:0051754 | meiotic sister chromatid cohesion, centromeric(GO:0051754) |
| 0.0 | 0.1 | GO:0005997 | xylulose metabolic process(GO:0005997) |
| 0.0 | 0.1 | GO:0045721 | negative regulation of gluconeogenesis(GO:0045721) |
| 0.0 | 0.1 | GO:1903358 | regulation of Golgi organization(GO:1903358) |
| 0.0 | 0.1 | GO:0070126 | mitochondrial translational termination(GO:0070126) |
| 0.0 | 0.1 | GO:0006585 | dopamine biosynthetic process from tyrosine(GO:0006585) dopamine biosynthetic process(GO:0042416) |
| 0.0 | 0.2 | GO:0006611 | protein export from nucleus(GO:0006611) |
| 0.0 | 0.3 | GO:0035970 | peptidyl-threonine dephosphorylation(GO:0035970) |
| 0.0 | 0.1 | GO:0021559 | auditory receptor cell fate commitment(GO:0009912) trigeminal nerve development(GO:0021559) inner ear receptor cell fate commitment(GO:0060120) |
| 0.0 | 0.4 | GO:0032511 | late endosome to vacuole transport via multivesicular body sorting pathway(GO:0032511) |
| 0.0 | 0.1 | GO:0038093 | Fc receptor signaling pathway(GO:0038093) |
| 0.0 | 0.1 | GO:1901255 | nucleotide-excision repair involved in interstrand cross-link repair(GO:1901255) |
| 0.0 | 0.1 | GO:0018344 | protein geranylgeranylation(GO:0018344) |
| 0.0 | 0.1 | GO:2000767 | positive regulation of cytoplasmic translation(GO:2000767) |
| 0.0 | 0.1 | GO:0098974 | postsynaptic actin cytoskeleton organization(GO:0098974) |
| 0.0 | 0.1 | GO:1904031 | positive regulation of cyclin-dependent protein serine/threonine kinase activity(GO:0045737) positive regulation of cyclin-dependent protein kinase activity(GO:1904031) |
| 0.0 | 0.1 | GO:0006307 | DNA dealkylation involved in DNA repair(GO:0006307) |
| 0.0 | 0.1 | GO:0050907 | detection of chemical stimulus involved in sensory perception(GO:0050907) |
| 0.0 | 0.1 | GO:0048478 | replication fork protection(GO:0048478) |
| 0.0 | 0.2 | GO:0071156 | regulation of cell cycle arrest(GO:0071156) |
| 0.0 | 0.1 | GO:0061010 | gall bladder development(GO:0061010) |
| 0.0 | 0.1 | GO:1902024 | L-histidine transmembrane transport(GO:0089709) L-histidine transport(GO:1902024) |
| 0.0 | 0.1 | GO:0046900 | tetrahydrofolylpolyglutamate metabolic process(GO:0046900) |
| 0.0 | 0.0 | GO:0005981 | regulation of glycogen catabolic process(GO:0005981) |
| 0.0 | 0.2 | GO:0031848 | protection from non-homologous end joining at telomere(GO:0031848) telomere maintenance in response to DNA damage(GO:0043247) |
| 0.0 | 0.1 | GO:0000290 | deadenylation-dependent decapping of nuclear-transcribed mRNA(GO:0000290) |
| 0.0 | 0.1 | GO:0045938 | positive regulation of circadian sleep/wake cycle, sleep(GO:0045938) |
| 0.0 | 0.0 | GO:0098773 | skin epidermis development(GO:0098773) |
| 0.0 | 0.1 | GO:0043011 | myeloid dendritic cell activation(GO:0001773) myeloid dendritic cell differentiation(GO:0043011) |
| 0.0 | 0.5 | GO:0030574 | collagen catabolic process(GO:0030574) multicellular organism catabolic process(GO:0044243) |
| 0.0 | 0.1 | GO:0090155 | regulation of sphingolipid biosynthetic process(GO:0090153) negative regulation of sphingolipid biosynthetic process(GO:0090155) negative regulation of ceramide biosynthetic process(GO:1900060) regulation of membrane lipid metabolic process(GO:1905038) regulation of ceramide biosynthetic process(GO:2000303) |
| 0.0 | 0.0 | GO:0045002 | double-strand break repair via single-strand annealing(GO:0045002) |
| 0.0 | 0.0 | GO:0009211 | pyrimidine deoxyribonucleoside triphosphate metabolic process(GO:0009211) |
| 0.0 | 0.4 | GO:0006783 | heme biosynthetic process(GO:0006783) |
| 0.0 | 0.0 | GO:0050787 | response to mercury ion(GO:0046689) detoxification of mercury ion(GO:0050787) |
| 0.0 | 0.5 | GO:0010499 | proteasomal ubiquitin-independent protein catabolic process(GO:0010499) |
| 0.0 | 0.0 | GO:0010525 | regulation of transposition, RNA-mediated(GO:0010525) negative regulation of transposition, RNA-mediated(GO:0010526) transposition, RNA-mediated(GO:0032197) positive regulation of neuron apoptotic process(GO:0043525) positive regulation of neuron death(GO:1901216) |
| 0.0 | 0.4 | GO:0045454 | cell redox homeostasis(GO:0045454) |
| 0.0 | 0.1 | GO:2000171 | negative regulation of dendrite development(GO:2000171) |
| 0.0 | 0.0 | GO:1903644 | regulation of protein folding(GO:1903332) positive regulation of protein folding(GO:1903334) regulation of chaperone-mediated protein folding(GO:1903644) positive regulation of chaperone-mediated protein folding(GO:1903646) |
| 0.0 | 0.1 | GO:0030718 | germ-line stem cell population maintenance(GO:0030718) |
| 0.0 | 0.1 | GO:0031998 | regulation of fatty acid beta-oxidation(GO:0031998) |
| 0.0 | 0.0 | GO:0008611 | ether lipid biosynthetic process(GO:0008611) glycerol ether biosynthetic process(GO:0046504) cellular lipid biosynthetic process(GO:0097384) ether biosynthetic process(GO:1901503) |
| 0.0 | 0.2 | GO:0032435 | negative regulation of proteasomal ubiquitin-dependent protein catabolic process(GO:0032435) negative regulation of proteasomal protein catabolic process(GO:1901799) negative regulation of proteolysis involved in cellular protein catabolic process(GO:1903051) |
| 0.0 | 0.2 | GO:0035999 | tetrahydrofolate interconversion(GO:0035999) |
| 0.0 | 0.4 | GO:0009225 | nucleotide-sugar metabolic process(GO:0009225) |
| 0.0 | 0.1 | GO:0006269 | DNA replication, synthesis of RNA primer(GO:0006269) |
| 0.0 | 0.1 | GO:0007220 | Notch receptor processing(GO:0007220) |
| 0.0 | 0.1 | GO:0070584 | mitochondrion morphogenesis(GO:0070584) |
| 0.0 | 0.1 | GO:0006348 | chromatin silencing at telomere(GO:0006348) |
| 0.0 | 0.1 | GO:0009954 | proximal/distal pattern formation(GO:0009954) |
| 0.0 | 0.4 | GO:0016180 | snRNA processing(GO:0016180) |
| 0.0 | 0.5 | GO:0030968 | endoplasmic reticulum unfolded protein response(GO:0030968) |
| 0.0 | 0.0 | GO:0043968 | histone H2A acetylation(GO:0043968) |
| 0.0 | 0.1 | GO:1904668 | positive regulation of ubiquitin protein ligase activity(GO:1904668) |
| 0.0 | 0.1 | GO:0010447 | response to acidic pH(GO:0010447) |
| 0.0 | 0.3 | GO:0010923 | negative regulation of phosphatase activity(GO:0010923) |
| 0.0 | 0.1 | GO:0006607 | NLS-bearing protein import into nucleus(GO:0006607) |
| 0.0 | 0.2 | GO:0090557 | establishment of endothelial intestinal barrier(GO:0090557) |
| 0.0 | 0.0 | GO:0043653 | mitochondrial fragmentation involved in apoptotic process(GO:0043653) |
| 0.0 | 0.4 | GO:0050821 | protein stabilization(GO:0050821) |
| 0.0 | 0.1 | GO:0006012 | galactose metabolic process(GO:0006012) |
| 0.0 | 0.1 | GO:0034427 | nuclear-transcribed mRNA catabolic process, exonucleolytic, 3'-5'(GO:0034427) |
| 0.0 | 0.0 | GO:0009447 | polyamine catabolic process(GO:0006598) putrescine catabolic process(GO:0009447) |
| 0.0 | 0.1 | GO:0000056 | ribosomal small subunit export from nucleus(GO:0000056) |
| 0.0 | 0.0 | GO:0019262 | N-acetylneuraminate catabolic process(GO:0019262) |
| 0.0 | 0.1 | GO:0017145 | stem cell division(GO:0017145) |
| 0.0 | 0.2 | GO:0019367 | fatty acid elongation, saturated fatty acid(GO:0019367) fatty acid elongation, unsaturated fatty acid(GO:0019368) fatty acid elongation, monounsaturated fatty acid(GO:0034625) fatty acid elongation, polyunsaturated fatty acid(GO:0034626) |
| 0.0 | 0.1 | GO:0032024 | positive regulation of insulin secretion(GO:0032024) |
| 0.0 | 0.6 | GO:0006892 | post-Golgi vesicle-mediated transport(GO:0006892) |
| 0.0 | 0.1 | GO:0072028 | nephron morphogenesis(GO:0072028) |
| 0.0 | 0.1 | GO:1904356 | regulation of telomere maintenance via telomere lengthening(GO:1904356) |
| 0.0 | 0.1 | GO:2000758 | positive regulation of protein acetylation(GO:1901985) positive regulation of peptidyl-lysine acetylation(GO:2000758) |
| 0.0 | 0.0 | GO:0060631 | regulation of meiosis I(GO:0060631) |
| 0.0 | 0.0 | GO:1990481 | mRNA pseudouridine synthesis(GO:1990481) |
| 0.0 | 0.2 | GO:0031581 | hemidesmosome assembly(GO:0031581) |
Gene overrepresentation in cellular component category:
| Log-likelihood per target | Total log-likelihood | Term | Description |
|---|---|---|---|
| 0.2 | 0.6 | GO:0097125 | cyclin B1-CDK1 complex(GO:0097125) |
| 0.2 | 0.7 | GO:0034363 | intermediate-density lipoprotein particle(GO:0034363) |
| 0.1 | 0.8 | GO:0031262 | Ndc80 complex(GO:0031262) |
| 0.1 | 0.5 | GO:0061689 | tricellular tight junction(GO:0061689) |
| 0.1 | 0.5 | GO:0005880 | nuclear microtubule(GO:0005880) |
| 0.1 | 1.1 | GO:0031838 | haptoglobin-hemoglobin complex(GO:0031838) |
| 0.1 | 0.5 | GO:0000221 | vacuolar proton-transporting V-type ATPase, V1 domain(GO:0000221) |
| 0.1 | 0.5 | GO:0030915 | Smc5-Smc6 complex(GO:0030915) |
| 0.1 | 1.2 | GO:0042555 | MCM complex(GO:0042555) |
| 0.1 | 0.2 | GO:0098556 | cytoplasmic side of rough endoplasmic reticulum membrane(GO:0098556) |
| 0.1 | 0.3 | GO:0000811 | GINS complex(GO:0000811) |
| 0.1 | 0.4 | GO:0033181 | plasma membrane proton-transporting V-type ATPase complex(GO:0033181) |
| 0.1 | 0.8 | GO:0005664 | origin recognition complex(GO:0000808) nuclear origin of replication recognition complex(GO:0005664) |
| 0.1 | 0.2 | GO:0032299 | ribonuclease H2 complex(GO:0032299) |
| 0.1 | 0.3 | GO:0043198 | dendritic shaft(GO:0043198) |
| 0.1 | 0.6 | GO:0030904 | retromer complex(GO:0030904) |
| 0.1 | 0.2 | GO:0098574 | cytoplasmic side of lysosomal membrane(GO:0098574) |
| 0.0 | 0.3 | GO:0000439 | core TFIIH complex(GO:0000439) |
| 0.0 | 0.2 | GO:0031085 | BLOC-3 complex(GO:0031085) |
| 0.0 | 1.6 | GO:0030119 | AP-type membrane coat adaptor complex(GO:0030119) |
| 0.0 | 0.3 | GO:0030897 | HOPS complex(GO:0030897) |
| 0.0 | 0.6 | GO:0005868 | cytoplasmic dynein complex(GO:0005868) |
| 0.0 | 0.9 | GO:0031083 | BLOC-1 complex(GO:0031083) |
| 0.0 | 0.1 | GO:0032044 | DSIF complex(GO:0032044) |
| 0.0 | 0.2 | GO:0071006 | U2-type catalytic step 1 spliceosome(GO:0071006) catalytic step 1 spliceosome(GO:0071012) |
| 0.0 | 0.2 | GO:0008622 | epsilon DNA polymerase complex(GO:0008622) |
| 0.0 | 0.2 | GO:0097134 | cyclin E1-CDK2 complex(GO:0097134) |
| 0.0 | 0.3 | GO:0016272 | prefoldin complex(GO:0016272) |
| 0.0 | 0.2 | GO:0005658 | alpha DNA polymerase:primase complex(GO:0005658) |
| 0.0 | 0.5 | GO:0033178 | proton-transporting two-sector ATPase complex, catalytic domain(GO:0033178) |
| 0.0 | 0.2 | GO:0035101 | FACT complex(GO:0035101) |
| 0.0 | 0.5 | GO:0032588 | trans-Golgi network membrane(GO:0032588) |
| 0.0 | 0.4 | GO:0005751 | mitochondrial respiratory chain complex IV(GO:0005751) |
| 0.0 | 0.7 | GO:0046930 | pore complex(GO:0046930) |
| 0.0 | 0.1 | GO:0000214 | tRNA-intron endonuclease complex(GO:0000214) |
| 0.0 | 0.3 | GO:0019773 | proteasome core complex, alpha-subunit complex(GO:0019773) |
| 0.0 | 0.1 | GO:0061673 | mitotic spindle astral microtubule(GO:0061673) |
| 0.0 | 0.1 | GO:0005968 | Rab-protein geranylgeranyltransferase complex(GO:0005968) |
| 0.0 | 0.1 | GO:0032301 | MutSalpha complex(GO:0032301) |
| 0.0 | 0.2 | GO:0030670 | phagocytic vesicle membrane(GO:0030670) |
| 0.0 | 0.3 | GO:0097431 | mitotic spindle pole(GO:0097431) |
| 0.0 | 0.1 | GO:0001405 | presequence translocase-associated import motor(GO:0001405) |
| 0.0 | 0.1 | GO:0000818 | nuclear MIS12/MIND complex(GO:0000818) |
| 0.0 | 0.0 | GO:0031082 | BLOC complex(GO:0031082) |
| 0.0 | 0.2 | GO:0071797 | LUBAC complex(GO:0071797) |
| 0.0 | 0.1 | GO:0090443 | FAR/SIN/STRIPAK complex(GO:0090443) |
| 0.0 | 0.8 | GO:0016605 | PML body(GO:0016605) |
| 0.0 | 0.1 | GO:0098837 | postsynaptic recycling endosome(GO:0098837) |
| 0.0 | 0.1 | GO:0070390 | transcription export complex 2(GO:0070390) |
| 0.0 | 0.1 | GO:0031428 | box C/D snoRNP complex(GO:0031428) |
| 0.0 | 0.1 | GO:0072588 | box H/ACA snoRNP complex(GO:0031429) box H/ACA RNP complex(GO:0072588) |
| 0.0 | 0.4 | GO:0035102 | PRC1 complex(GO:0035102) |
| 0.0 | 0.1 | GO:0005854 | nascent polypeptide-associated complex(GO:0005854) |
| 0.0 | 0.1 | GO:1990131 | EGO complex(GO:0034448) Gtr1-Gtr2 GTPase complex(GO:1990131) |
| 0.0 | 0.1 | GO:0005663 | DNA replication factor C complex(GO:0005663) |
| 0.0 | 0.1 | GO:0031080 | nuclear pore outer ring(GO:0031080) |
| 0.0 | 0.1 | GO:0070765 | gamma-secretase complex(GO:0070765) |
| 0.0 | 0.1 | GO:0097255 | R2TP complex(GO:0097255) |
| 0.0 | 0.1 | GO:0032797 | SMN complex(GO:0032797) |
| 0.0 | 0.2 | GO:0014704 | intercalated disc(GO:0014704) |
| 0.0 | 0.1 | GO:0070209 | ASTRA complex(GO:0070209) |
| 0.0 | 0.1 | GO:0035339 | SPOTS complex(GO:0035339) |
| 0.0 | 0.1 | GO:0031258 | lamellipodium membrane(GO:0031258) |
| 0.0 | 0.1 | GO:1902737 | dendritic spine neck(GO:0044326) dendritic filopodium(GO:1902737) |
| 0.0 | 0.1 | GO:0019815 | B cell receptor complex(GO:0019815) |
| 0.0 | 0.1 | GO:0070419 | nonhomologous end joining complex(GO:0070419) |
| 0.0 | 0.9 | GO:0000777 | condensed chromosome kinetochore(GO:0000777) |
| 0.0 | 0.0 | GO:0072380 | TRC complex(GO:0072380) |
| 0.0 | 0.2 | GO:0005956 | protein kinase CK2 complex(GO:0005956) |
| 0.0 | 0.1 | GO:0000110 | nucleotide-excision repair factor 1 complex(GO:0000110) |
| 0.0 | 0.0 | GO:0032777 | Piccolo NuA4 histone acetyltransferase complex(GO:0032777) |
| 0.0 | 0.1 | GO:0031526 | brush border membrane(GO:0031526) |
| 0.0 | 0.6 | GO:0030496 | midbody(GO:0030496) |
| 0.0 | 0.1 | GO:0071540 | eukaryotic translation initiation factor 3 complex, eIF3e(GO:0071540) |
| 0.0 | 0.1 | GO:0070652 | HAUS complex(GO:0070652) |
| 0.0 | 0.0 | GO:1990879 | CST complex(GO:1990879) |
| 0.0 | 0.1 | GO:0055087 | Ski complex(GO:0055087) |
| 0.0 | 0.2 | GO:0044665 | MLL1/2 complex(GO:0044665) MLL1 complex(GO:0071339) |
| 0.0 | 0.1 | GO:0032021 | NELF complex(GO:0032021) |
| 0.0 | 0.2 | GO:0044666 | MLL3/4 complex(GO:0044666) |
| 0.0 | 0.1 | GO:0044613 | nuclear pore central transport channel(GO:0044613) |
| 0.0 | 0.3 | GO:0005881 | cytoplasmic microtubule(GO:0005881) |
| 0.0 | 0.1 | GO:0033557 | Slx1-Slx4 complex(GO:0033557) |
| 0.0 | 0.1 | GO:1990923 | PET complex(GO:1990923) |
Gene overrepresentation in molecular function category:
| Log-likelihood per target | Total log-likelihood | Term | Description |
|---|---|---|---|
| 0.3 | 1.0 | GO:0004639 | phosphoribosylaminoimidazolesuccinocarboxamide synthase activity(GO:0004639) |
| 0.2 | 1.2 | GO:1990518 | ATP-dependent 3'-5' DNA helicase activity(GO:0043140) single-stranded DNA-dependent ATP-dependent 3'-5' DNA helicase activity(GO:1990518) |
| 0.2 | 0.7 | GO:0048030 | disaccharide binding(GO:0048030) |
| 0.2 | 0.7 | GO:0043395 | heparan sulfate proteoglycan binding(GO:0043395) |
| 0.2 | 0.6 | GO:0004342 | glucosamine-6-phosphate deaminase activity(GO:0004342) |
| 0.1 | 0.3 | GO:0004560 | alpha-L-fucosidase activity(GO:0004560) fucosidase activity(GO:0015928) |
| 0.1 | 0.4 | GO:0008117 | sphinganine-1-phosphate aldolase activity(GO:0008117) |
| 0.1 | 1.1 | GO:0031720 | haptoglobin binding(GO:0031720) |
| 0.1 | 0.3 | GO:0043739 | G/U mismatch-specific uracil-DNA glycosylase activity(GO:0043739) |
| 0.1 | 0.3 | GO:0070224 | sulfide:quinone oxidoreductase activity(GO:0070224) |
| 0.1 | 0.4 | GO:0051059 | NF-kappaB binding(GO:0051059) |
| 0.1 | 0.4 | GO:0042134 | rRNA primary transcript binding(GO:0042134) |
| 0.1 | 0.4 | GO:0070004 | cysteine-type exopeptidase activity(GO:0070004) |
| 0.1 | 0.3 | GO:0017077 | oxidative phosphorylation uncoupler activity(GO:0017077) |
| 0.1 | 0.3 | GO:0004649 | poly(ADP-ribose) glycohydrolase activity(GO:0004649) |
| 0.1 | 0.3 | GO:0000099 | sulfur amino acid transmembrane transporter activity(GO:0000099) |
| 0.1 | 0.2 | GO:0004301 | epoxide hydrolase activity(GO:0004301) |
| 0.1 | 0.4 | GO:0003977 | UDP-N-acetylglucosamine diphosphorylase activity(GO:0003977) |
| 0.1 | 0.2 | GO:0004557 | alpha-galactosidase activity(GO:0004557) |
| 0.1 | 0.7 | GO:0043515 | kinetochore binding(GO:0043515) |
| 0.1 | 0.3 | GO:0033745 | L-methionine-(R)-S-oxide reductase activity(GO:0033745) |
| 0.1 | 1.0 | GO:0031386 | protein tag(GO:0031386) |
| 0.1 | 0.5 | GO:0050262 | ribosylnicotinamide kinase activity(GO:0050262) |
| 0.1 | 0.2 | GO:0004904 | interferon receptor activity(GO:0004904) |
| 0.1 | 0.3 | GO:0004185 | serine-type carboxypeptidase activity(GO:0004185) |
| 0.1 | 0.2 | GO:0004450 | isocitrate dehydrogenase (NADP+) activity(GO:0004450) |
| 0.0 | 0.1 | GO:0015218 | pyrimidine nucleotide transmembrane transporter activity(GO:0015218) |
| 0.0 | 0.3 | GO:0004748 | ribonucleoside-diphosphate reductase activity, thioredoxin disulfide as acceptor(GO:0004748) oxidoreductase activity, acting on CH or CH2 groups, disulfide as acceptor(GO:0016728) ribonucleoside-diphosphate reductase activity(GO:0061731) |
| 0.0 | 0.1 | GO:0015315 | hexose phosphate transmembrane transporter activity(GO:0015119) organophosphate:inorganic phosphate antiporter activity(GO:0015315) hexose-phosphate:inorganic phosphate antiporter activity(GO:0015526) glucose 6-phosphate:inorganic phosphate antiporter activity(GO:0061513) |
| 0.0 | 0.1 | GO:0047453 | ATP-dependent NAD(P)H-hydrate dehydratase activity(GO:0047453) ADP-dependent NAD(P)H-hydrate dehydratase activity(GO:0052855) |
| 0.0 | 0.1 | GO:0042806 | fucose binding(GO:0042806) |
| 0.0 | 0.6 | GO:0070915 | lysophosphatidic acid receptor activity(GO:0070915) |
| 0.0 | 1.2 | GO:0004198 | calcium-dependent cysteine-type endopeptidase activity(GO:0004198) |
| 0.0 | 0.5 | GO:0008532 | N-acetyllactosaminide beta-1,3-N-acetylglucosaminyltransferase activity(GO:0008532) |
| 0.0 | 0.1 | GO:0031752 | D5 dopamine receptor binding(GO:0031752) |
| 0.0 | 0.7 | GO:0008239 | dipeptidyl-peptidase activity(GO:0008239) |
| 0.0 | 0.3 | GO:0042500 | aspartic endopeptidase activity, intramembrane cleaving(GO:0042500) |
| 0.0 | 0.1 | GO:0003999 | adenine phosphoribosyltransferase activity(GO:0003999) |
| 0.0 | 0.1 | GO:0043734 | DNA-N1-methyladenine dioxygenase activity(GO:0043734) |
| 0.0 | 0.2 | GO:0003938 | IMP dehydrogenase activity(GO:0003938) |
| 0.0 | 0.1 | GO:0070182 | DNA polymerase binding(GO:0070182) |
| 0.0 | 0.1 | GO:0008397 | sterol 12-alpha-hydroxylase activity(GO:0008397) |
| 0.0 | 0.3 | GO:0034597 | phosphatidylinositol-4,5-bisphosphate 4-phosphatase activity(GO:0034597) |
| 0.0 | 0.2 | GO:0047066 | phospholipid-hydroperoxide glutathione peroxidase activity(GO:0047066) |
| 0.0 | 1.0 | GO:0070006 | metalloaminopeptidase activity(GO:0070006) |
| 0.0 | 0.5 | GO:0061608 | nuclear import signal receptor activity(GO:0061608) |
| 0.0 | 0.1 | GO:0004422 | hypoxanthine phosphoribosyltransferase activity(GO:0004422) |
| 0.0 | 0.3 | GO:0005049 | nuclear export signal receptor activity(GO:0005049) nucleocytoplasmic transporter activity(GO:0005487) |
| 0.0 | 0.1 | GO:0016892 | endoribonuclease activity, producing 3'-phosphomonoesters(GO:0016892) |
| 0.0 | 0.1 | GO:0004365 | glyceraldehyde-3-phosphate dehydrogenase (NAD+) (phosphorylating) activity(GO:0004365) glyceraldehyde-3-phosphate dehydrogenase (NAD(P)+) (phosphorylating) activity(GO:0043891) |
| 0.0 | 0.1 | GO:0047961 | glycine N-acyltransferase activity(GO:0047961) |
| 0.0 | 0.4 | GO:0043015 | gamma-tubulin binding(GO:0043015) |
| 0.0 | 0.2 | GO:0004329 | formate-tetrahydrofolate ligase activity(GO:0004329) |
| 0.0 | 0.1 | GO:0004663 | Rab geranylgeranyltransferase activity(GO:0004663) |
| 0.0 | 0.1 | GO:0019238 | cyclohydrolase activity(GO:0019238) |
| 0.0 | 0.5 | GO:0003785 | actin monomer binding(GO:0003785) |
| 0.0 | 0.1 | GO:0032138 | guanine/thymine mispair binding(GO:0032137) single base insertion or deletion binding(GO:0032138) single thymine insertion binding(GO:0032143) oxidized DNA binding(GO:0032356) oxidized purine DNA binding(GO:0032357) mismatch repair complex binding(GO:0032404) MutLalpha complex binding(GO:0032405) |
| 0.0 | 0.1 | GO:0034513 | box H/ACA snoRNA binding(GO:0034513) |
| 0.0 | 0.3 | GO:0047631 | ADP-ribose diphosphatase activity(GO:0047631) |
| 0.0 | 0.1 | GO:0043531 | ADP binding(GO:0043531) |
| 0.0 | 0.2 | GO:0004499 | N,N-dimethylaniline monooxygenase activity(GO:0004499) |
| 0.0 | 0.2 | GO:0071558 | histone demethylase activity (H3-K27 specific)(GO:0071558) |
| 0.0 | 1.3 | GO:0008009 | chemokine activity(GO:0008009) |
| 0.0 | 0.8 | GO:0004869 | cysteine-type endopeptidase inhibitor activity(GO:0004869) |
| 0.0 | 0.4 | GO:0003688 | DNA replication origin binding(GO:0003688) |
| 0.0 | 0.5 | GO:0098748 | clathrin adaptor activity(GO:0035615) endocytic adaptor activity(GO:0098748) |
| 0.0 | 0.3 | GO:0008330 | protein tyrosine/threonine phosphatase activity(GO:0008330) |
| 0.0 | 0.3 | GO:0044183 | protein binding involved in protein folding(GO:0044183) |
| 0.0 | 0.5 | GO:0016628 | oxidoreductase activity, acting on the CH-CH group of donors, NAD or NADP as acceptor(GO:0016628) |
| 0.0 | 0.3 | GO:0008553 | hydrogen-exporting ATPase activity, phosphorylative mechanism(GO:0008553) |
| 0.0 | 0.1 | GO:0003978 | UDP-glucose 4-epimerase activity(GO:0003978) |
| 0.0 | 0.1 | GO:0019777 | Atg12 transferase activity(GO:0019777) |
| 0.0 | 0.3 | GO:0070003 | threonine-type endopeptidase activity(GO:0004298) threonine-type peptidase activity(GO:0070003) |
| 0.0 | 0.1 | GO:0016863 | intramolecular oxidoreductase activity, transposing C=C bonds(GO:0016863) |
| 0.0 | 0.1 | GO:0004740 | pyruvate dehydrogenase (acetyl-transferring) kinase activity(GO:0004740) |
| 0.0 | 0.1 | GO:0070180 | large ribosomal subunit rRNA binding(GO:0070180) |
| 0.0 | 0.1 | GO:0003913 | DNA photolyase activity(GO:0003913) |
| 0.0 | 0.2 | GO:0055102 | phospholipase inhibitor activity(GO:0004859) lipase inhibitor activity(GO:0055102) |
| 0.0 | 0.1 | GO:0016531 | copper chaperone activity(GO:0016531) |
| 0.0 | 0.5 | GO:0045505 | dynein intermediate chain binding(GO:0045505) |
| 0.0 | 0.1 | GO:0017050 | D-erythro-sphingosine kinase activity(GO:0017050) |
| 0.0 | 0.4 | GO:0004065 | arylsulfatase activity(GO:0004065) |
| 0.0 | 0.1 | GO:0008597 | calcium-dependent protein serine/threonine phosphatase regulator activity(GO:0008597) |
| 0.0 | 0.1 | GO:0004300 | enoyl-CoA hydratase activity(GO:0004300) |
| 0.0 | 0.3 | GO:0001671 | ATPase activator activity(GO:0001671) |
| 0.0 | 0.1 | GO:0070181 | small ribosomal subunit rRNA binding(GO:0070181) |
| 0.0 | 0.1 | GO:0008026 | ATP-dependent DNA helicase activity(GO:0004003) ATP-dependent helicase activity(GO:0008026) purine NTP-dependent helicase activity(GO:0070035) |
| 0.0 | 0.1 | GO:0070513 | death domain binding(GO:0070513) |
| 0.0 | 0.4 | GO:0004129 | cytochrome-c oxidase activity(GO:0004129) heme-copper terminal oxidase activity(GO:0015002) oxidoreductase activity, acting on a heme group of donors(GO:0016675) oxidoreductase activity, acting on a heme group of donors, oxygen as acceptor(GO:0016676) |
| 0.0 | 0.0 | GO:0035243 | protein-arginine omega-N symmetric methyltransferase activity(GO:0035243) |
| 0.0 | 0.1 | GO:0016936 | galactoside binding(GO:0016936) |
| 0.0 | 0.1 | GO:0000702 | oxidized base lesion DNA N-glycosylase activity(GO:0000702) |
| 0.0 | 0.1 | GO:0004028 | 3-chloroallyl aldehyde dehydrogenase activity(GO:0004028) |
| 0.0 | 0.1 | GO:0035312 | 5'-3' exodeoxyribonuclease activity(GO:0035312) |
| 0.0 | 0.5 | GO:0017147 | Wnt-protein binding(GO:0017147) |
| 0.0 | 0.0 | GO:0047690 | aspartyltransferase activity(GO:0047690) |
| 0.0 | 0.2 | GO:0008301 | DNA binding, bending(GO:0008301) |
| 0.0 | 0.2 | GO:0016018 | cyclosporin A binding(GO:0016018) |
| 0.0 | 0.4 | GO:0032266 | phosphatidylinositol-3-phosphate binding(GO:0032266) |
| 0.0 | 0.1 | GO:0004565 | beta-galactosidase activity(GO:0004565) |
| 0.0 | 0.1 | GO:0003993 | acid phosphatase activity(GO:0003993) |
| 0.0 | 0.1 | GO:0005351 | sugar:proton symporter activity(GO:0005351) cation:sugar symporter activity(GO:0005402) sucrose:proton symporter activity(GO:0008506) sucrose transmembrane transporter activity(GO:0008515) disaccharide transmembrane transporter activity(GO:0015154) oligosaccharide transmembrane transporter activity(GO:0015157) |
| 0.0 | 0.2 | GO:0072542 | phosphatase activator activity(GO:0019211) protein phosphatase activator activity(GO:0072542) |
| 0.0 | 0.1 | GO:0008142 | oxysterol binding(GO:0008142) |
| 0.0 | 0.1 | GO:0033170 | DNA clamp loader activity(GO:0003689) protein-DNA loading ATPase activity(GO:0033170) |
| 0.0 | 0.1 | GO:0080019 | fatty-acyl-CoA reductase (alcohol-forming) activity(GO:0080019) |
| 0.0 | 0.1 | GO:0004510 | tryptophan 5-monooxygenase activity(GO:0004510) |
| 0.0 | 0.1 | GO:0043023 | ribosomal large subunit binding(GO:0043023) |
| 0.0 | 0.1 | GO:0004719 | protein-L-isoaspartate (D-aspartate) O-methyltransferase activity(GO:0004719) |
| 0.0 | 0.4 | GO:0005164 | tumor necrosis factor receptor binding(GO:0005164) |
| 0.0 | 0.1 | GO:0004035 | alkaline phosphatase activity(GO:0004035) |
| 0.0 | 0.1 | GO:0047429 | nucleoside-triphosphate diphosphatase activity(GO:0047429) |
| 0.0 | 0.1 | GO:0001046 | core promoter sequence-specific DNA binding(GO:0001046) core promoter binding(GO:0001047) |
| 0.0 | 0.7 | GO:0016538 | cyclin-dependent protein serine/threonine kinase regulator activity(GO:0016538) |
| 0.0 | 0.2 | GO:0102338 | fatty acid elongase activity(GO:0009922) 3-oxo-arachidoyl-CoA synthase activity(GO:0102336) 3-oxo-cerotoyl-CoA synthase activity(GO:0102337) 3-oxo-lignoceronyl-CoA synthase activity(GO:0102338) |
| 0.0 | 0.0 | GO:0016748 | succinyltransferase activity(GO:0016748) |
| 0.0 | 0.1 | GO:0052796 | exo-alpha-(2->3)-sialidase activity(GO:0052794) exo-alpha-(2->6)-sialidase activity(GO:0052795) exo-alpha-(2->8)-sialidase activity(GO:0052796) |
| 0.0 | 0.1 | GO:0010485 | H4 histone acetyltransferase activity(GO:0010485) |
| 0.0 | 0.5 | GO:0030295 | kinase activator activity(GO:0019209) protein kinase activator activity(GO:0030295) |
| 0.0 | 0.1 | GO:0034714 | type III transforming growth factor beta receptor binding(GO:0034714) |
| 0.0 | 0.1 | GO:0016416 | carnitine O-palmitoyltransferase activity(GO:0004095) O-palmitoyltransferase activity(GO:0016416) |
| 0.0 | 0.1 | GO:0050699 | WW domain binding(GO:0050699) |
| 0.0 | 0.2 | GO:1990841 | promoter-specific chromatin binding(GO:1990841) |
| 0.0 | 0.1 | GO:0008429 | phosphatidylethanolamine binding(GO:0008429) |
Gene overrepresentation in curated gene sets: canonical pathways category:
| Log-likelihood per target | Total log-likelihood | Term | Description |
|---|---|---|---|
| 0.1 | 0.7 | PID TCR CALCIUM PATHWAY | Calcium signaling in the CD4+ TCR pathway |
| 0.0 | 0.2 | ST JAK STAT PATHWAY | Jak-STAT Pathway |
| 0.0 | 0.3 | ST TYPE I INTERFERON PATHWAY | Type I Interferon (alpha/beta IFN) Pathway |
| 0.0 | 0.9 | PID AURORA A PATHWAY | Aurora A signaling |
| 0.0 | 0.3 | PID INTEGRIN4 PATHWAY | Alpha6 beta4 integrin-ligand interactions |
| 0.0 | 1.0 | PID FOXM1 PATHWAY | FOXM1 transcription factor network |
| 0.0 | 0.4 | PID SYNDECAN 3 PATHWAY | Syndecan-3-mediated signaling events |
| 0.0 | 0.3 | PID ALK2 PATHWAY | ALK2 signaling events |
| 0.0 | 0.1 | SA PROGRAMMED CELL DEATH | Programmed cell death, or apoptosis, eliminates damaged or unneeded cells. |
| 0.0 | 0.6 | PID IL12 2PATHWAY | IL12-mediated signaling events |
| 0.0 | 0.6 | PID CASPASE PATHWAY | Caspase cascade in apoptosis |
| 0.0 | 0.3 | PID FRA PATHWAY | Validated transcriptional targets of AP1 family members Fra1 and Fra2 |
| 0.0 | 0.0 | SA PTEN PATHWAY | PTEN is a tumor suppressor that dephosphorylates the lipid messenger phosphatidylinositol triphosphate. |
| 0.0 | 0.3 | PID MYC PATHWAY | C-MYC pathway |
| 0.0 | 0.4 | PID ATR PATHWAY | ATR signaling pathway |
| 0.0 | 0.3 | PID DNA PK PATHWAY | DNA-PK pathway in nonhomologous end joining |
| 0.0 | 0.3 | ST WNT BETA CATENIN PATHWAY | Wnt/beta-catenin Pathway |
Gene overrepresentation in curated gene sets: REACTOME pathways category:
| Log-likelihood per target | Total log-likelihood | Term | Description |
|---|---|---|---|
| 0.1 | 1.5 | REACTOME UNWINDING OF DNA | Genes involved in Unwinding of DNA |
| 0.1 | 1.5 | REACTOME PURINE RIBONUCLEOSIDE MONOPHOSPHATE BIOSYNTHESIS | Genes involved in Purine ribonucleoside monophosphate biosynthesis |
| 0.1 | 0.1 | REACTOME MRNA DECAY BY 3 TO 5 EXORIBONUCLEASE | Genes involved in mRNA Decay by 3' to 5' Exoribonuclease |
| 0.1 | 1.3 | REACTOME E2F ENABLED INHIBITION OF PRE REPLICATION COMPLEX FORMATION | Genes involved in E2F-enabled inhibition of pre-replication complex formation |
| 0.1 | 1.0 | REACTOME INSULIN RECEPTOR RECYCLING | Genes involved in Insulin receptor recycling |
| 0.1 | 0.6 | REACTOME ACTIVATION OF BH3 ONLY PROTEINS | Genes involved in Activation of BH3-only proteins |
| 0.0 | 0.5 | REACTOME NEF MEDIATED DOWNREGULATION OF MHC CLASS I COMPLEX CELL SURFACE EXPRESSION | Genes involved in Nef mediated downregulation of MHC class I complex cell surface expression |
| 0.0 | 0.3 | REACTOME MICRORNA MIRNA BIOGENESIS | Genes involved in MicroRNA (miRNA) Biogenesis |
| 0.0 | 0.4 | REACTOME SIGNALING BY NOTCH4 | Genes involved in Signaling by NOTCH4 |
| 0.0 | 1.4 | REACTOME GOLGI ASSOCIATED VESICLE BIOGENESIS | Genes involved in Golgi Associated Vesicle Biogenesis |
| 0.0 | 0.7 | REACTOME DEPOSITION OF NEW CENPA CONTAINING NUCLEOSOMES AT THE CENTROMERE | Genes involved in Deposition of New CENPA-containing Nucleosomes at the Centromere |
| 0.0 | 0.6 | REACTOME ACTIVATION OF THE PRE REPLICATIVE COMPLEX | Genes involved in Activation of the pre-replicative complex |
| 0.0 | 0.1 | REACTOME TRANSLOCATION OF ZAP 70 TO IMMUNOLOGICAL SYNAPSE | Genes involved in Translocation of ZAP-70 to Immunological synapse |
| 0.0 | 0.7 | REACTOME APOPTOTIC CLEAVAGE OF CELLULAR PROTEINS | Genes involved in Apoptotic cleavage of cellular proteins |
| 0.0 | 1.5 | REACTOME MITOTIC PROMETAPHASE | Genes involved in Mitotic Prometaphase |
| 0.0 | 0.4 | REACTOME RIP MEDIATED NFKB ACTIVATION VIA DAI | Genes involved in RIP-mediated NFkB activation via DAI |
| 0.0 | 0.1 | REACTOME INTRINSIC PATHWAY FOR APOPTOSIS | Genes involved in Intrinsic Pathway for Apoptosis |
| 0.0 | 0.2 | REACTOME SLBP DEPENDENT PROCESSING OF REPLICATION DEPENDENT HISTONE PRE MRNAS | Genes involved in SLBP Dependent Processing of Replication-Dependent Histone Pre-mRNAs |
| 0.0 | 0.3 | REACTOME G1 S SPECIFIC TRANSCRIPTION | Genes involved in G1/S-Specific Transcription |
| 0.0 | 1.1 | REACTOME RNA POL II PRE TRANSCRIPTION EVENTS | Genes involved in RNA Polymerase II Pre-transcription Events |
| 0.0 | 0.2 | REACTOME IL 7 SIGNALING | Genes involved in Interleukin-7 signaling |
| 0.0 | 0.0 | REACTOME MRNA CAPPING | Genes involved in mRNA Capping |
| 0.0 | 0.0 | REACTOME NRIF SIGNALS CELL DEATH FROM THE NUCLEUS | Genes involved in NRIF signals cell death from the nucleus |
| 0.0 | 0.8 | REACTOME MHC CLASS II ANTIGEN PRESENTATION | Genes involved in MHC class II antigen presentation |
| 0.0 | 0.6 | REACTOME CDT1 ASSOCIATION WITH THE CDC6 ORC ORIGIN COMPLEX | Genes involved in CDT1 association with the CDC6:ORC:origin complex |
| 0.0 | 0.1 | REACTOME SIGNAL TRANSDUCTION BY L1 | Genes involved in Signal transduction by L1 |
| 0.0 | 0.2 | REACTOME METABOLISM OF PORPHYRINS | Genes involved in Metabolism of porphyrins |
| 0.0 | 0.6 | REACTOME ASSOCIATION OF TRIC CCT WITH TARGET PROTEINS DURING BIOSYNTHESIS | Genes involved in Association of TriC/CCT with target proteins during biosynthesis |
| 0.0 | 0.3 | REACTOME SULFUR AMINO ACID METABOLISM | Genes involved in Sulfur amino acid metabolism |
| 0.0 | 0.3 | REACTOME PEROXISOMAL LIPID METABOLISM | Genes involved in Peroxisomal lipid metabolism |
| 0.0 | 0.3 | REACTOME EXTENSION OF TELOMERES | Genes involved in Extension of Telomeres |
| 0.0 | 0.6 | REACTOME FORMATION OF THE TERNARY COMPLEX AND SUBSEQUENTLY THE 43S COMPLEX | Genes involved in Formation of the ternary complex, and subsequently, the 43S complex |
| 0.0 | 0.3 | REACTOME INTERFERON GAMMA SIGNALING | Genes involved in Interferon gamma signaling |
| 0.0 | 0.1 | REACTOME REGULATION OF PYRUVATE DEHYDROGENASE PDH COMPLEX | Genes involved in Regulation of pyruvate dehydrogenase (PDH) complex |
| 0.0 | 0.1 | REACTOME KERATAN SULFATE DEGRADATION | Genes involved in Keratan sulfate degradation |
| 0.0 | 0.8 | REACTOME PEPTIDE CHAIN ELONGATION | Genes involved in Peptide chain elongation |
| 0.0 | 0.2 | REACTOME PREFOLDIN MEDIATED TRANSFER OF SUBSTRATE TO CCT TRIC | Genes involved in Prefoldin mediated transfer of substrate to CCT/TriC |
| 0.0 | 0.3 | REACTOME REGULATION OF MRNA STABILITY BY PROTEINS THAT BIND AU RICH ELEMENTS | Genes involved in Regulation of mRNA Stability by Proteins that Bind AU-rich Elements |
| 0.0 | 0.2 | REACTOME PYRIMIDINE METABOLISM | Genes involved in Pyrimidine metabolism |
| 0.0 | 0.0 | REACTOME ACTIVATION OF IRF3 IRF7 MEDIATED BY TBK1 IKK EPSILON | Genes involved in Activation of IRF3/IRF7 mediated by TBK1/IKK epsilon |
| 0.0 | 0.1 | REACTOME TIGHT JUNCTION INTERACTIONS | Genes involved in Tight junction interactions |