Project
PRJNA195909:zebrafish embryo and larva development
Navigation
Downloads
Results for tfcp2+tfcp2l1+ubp1
Z-value: 1.37
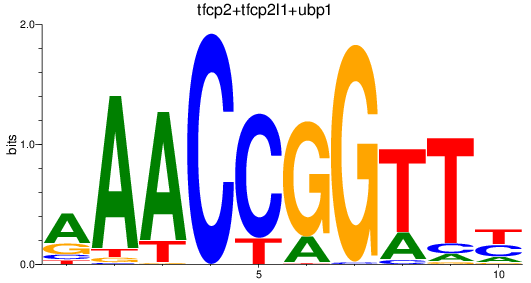
Motif logo
Transcription factors associated with tfcp2+tfcp2l1+ubp1
| Gene Symbol | Gene ID | Gene Info |
|---|---|---|
|
ubp1
|
ENSDARG00000018000 | upstream binding protein 1 |
|
tfcp2l1
|
ENSDARG00000029497 | transcription factor CP2-like 1 |
|
tfcp2
|
ENSDARG00000060306 | transcription factor CP2 |
Activity-expression correlation:
| Gene | Promoter | Pearson corr. coef. | P-value | Plot |
|---|---|---|---|---|
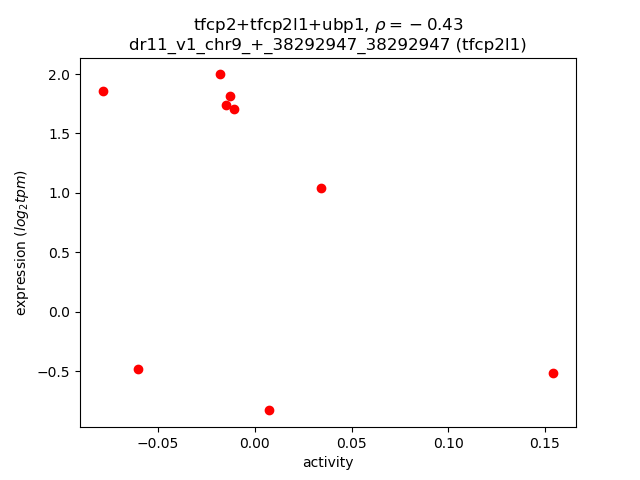
| tfcp2l1 | dr11_v1_chr9_+_38292947_38292947 | -0.43 | 2.5e-01 | Click! |
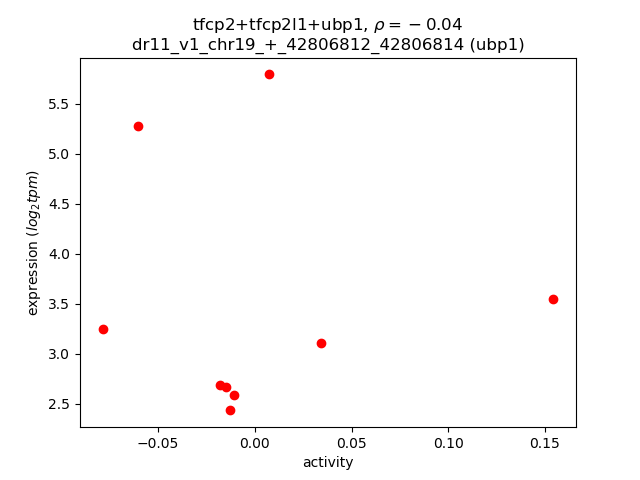
| ubp1 | dr11_v1_chr19_+_42806812_42806814 | -0.04 | 9.2e-01 | Click! |
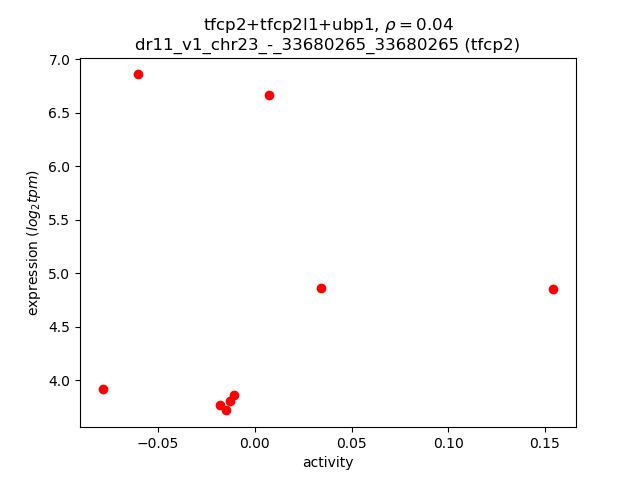
| tfcp2 | dr11_v1_chr23_-_33680265_33680265 | 0.04 | 9.2e-01 | Click! |
Activity profile of tfcp2+tfcp2l1+ubp1 motif
Sorted Z-values of tfcp2+tfcp2l1+ubp1 motif
| Promoter | Log-likelihood | Transcript | Gene | Gene Info |
|---|---|---|---|---|
| chr5_-_68795063 | 2.06 |
ENSDART00000016307
|
her1
|
hairy-related 1 |
| chr22_+_22021936 | 1.51 |
ENSDART00000149586
|
gna15.1
|
guanine nucleotide binding protein (G protein), alpha 15 (Gq class), tandem duplicate 1 |
| chr10_-_15048781 | 1.29 |
ENSDART00000038401
ENSDART00000155674 |
si:ch211-95j8.2
|
si:ch211-95j8.2 |
| chr13_+_18533005 | 1.26 |
ENSDART00000136024
|
ftr14l
|
finTRIM family, member 14-like |
| chr7_-_38792543 | 1.10 |
ENSDART00000157416
|
si:dkey-23n7.10
|
si:dkey-23n7.10 |
| chr13_+_28495419 | 1.06 |
ENSDART00000025583
|
fgf8a
|
fibroblast growth factor 8a |
| chr3_-_27647845 | 1.04 |
ENSDART00000151625
|
si:ch211-157c3.4
|
si:ch211-157c3.4 |
| chr4_-_48636872 | 1.03 |
ENSDART00000168605
|
znf1063
|
zinc finger protein 1063 |
| chr17_+_51743908 | 1.00 |
ENSDART00000149039
ENSDART00000148869 |
odc1
|
ornithine decarboxylase 1 |
| chr24_+_38671054 | 0.96 |
ENSDART00000154214
|
si:ch73-70c5.1
|
si:ch73-70c5.1 |
| chr12_-_7607114 | 0.93 |
ENSDART00000158095
|
slc16a9b
|
solute carrier family 16, member 9b |
| chr15_-_601971 | 0.92 |
ENSDART00000188882
|
alox5b.3
|
arachidonate 5-lipoxygenase b, tandem duplicate 3 |
| chr16_-_6424816 | 0.91 |
ENSDART00000164864
ENSDART00000141860 |
mboat1
|
membrane bound O-acyltransferase domain containing 1 |
| chr21_+_25688388 | 0.90 |
ENSDART00000125709
|
bicdl2
|
bicaudal-D-related protein 2 |
| chr21_+_25625026 | 0.89 |
ENSDART00000134678
|
ovol1b
|
ovo-like zinc finger 1b |
| chr21_-_13149453 | 0.88 |
ENSDART00000172578
|
si:dkey-228b2.6
|
si:dkey-228b2.6 |
| chr10_+_39084354 | 0.85 |
ENSDART00000158245
|
si:ch73-1a9.3
|
si:ch73-1a9.3 |
| chr16_+_23961276 | 0.84 |
ENSDART00000192754
|
apoeb
|
apolipoprotein Eb |
| chr1_-_46706639 | 0.81 |
ENSDART00000074519
|
kpna3
|
karyopherin alpha 3 (importin alpha 4) |
| chr3_-_29977495 | 0.80 |
ENSDART00000077111
|
hsd17b14
|
hydroxysteroid (17-beta) dehydrogenase 14 |
| chr8_-_3312384 | 0.79 |
ENSDART00000035965
|
fut9b
|
fucosyltransferase 9b |
| chr4_-_49069087 | 0.78 |
ENSDART00000150622
|
si:ch211-234c11.3
|
si:ch211-234c11.3 |
| chr4_+_42078825 | 0.72 |
ENSDART00000164496
|
znf1060
|
zinc finger protein 1060 |
| chr1_-_53685090 | 0.72 |
ENSDART00000162751
|
xpo1a
|
exportin 1 (CRM1 homolog, yeast) a |
| chr5_+_30741730 | 0.71 |
ENSDART00000098246
ENSDART00000186992 ENSDART00000182533 |
ftr83
|
finTRIM family, member 83 |
| chr16_+_29509133 | 0.69 |
ENSDART00000112116
|
ctss2.1
|
cathepsin S, ortholog2, tandem duplicate 1 |
| chr10_-_7988396 | 0.67 |
ENSDART00000141445
ENSDART00000024282 |
ewsr1a
|
EWS RNA-binding protein 1a |
| chr4_-_50434519 | 0.66 |
ENSDART00000150372
|
znf1061
|
zinc finger protein 1061 |
| chr25_-_34670413 | 0.65 |
ENSDART00000073440
|
DNAJA4
|
DnaJ heat shock protein family (Hsp40) member A4 |
| chr21_-_37973081 | 0.65 |
ENSDART00000136569
|
ripply1
|
ripply transcriptional repressor 1 |
| chr8_-_32805214 | 0.64 |
ENSDART00000131597
|
zgc:194839
|
zgc:194839 |
| chr14_-_31087830 | 0.64 |
ENSDART00000002250
|
hs6st2
|
heparan sulfate 6-O-sulfotransferase 2 |
| chr3_-_26204867 | 0.64 |
ENSDART00000103748
|
gdpd3a
|
glycerophosphodiester phosphodiesterase domain containing 3a |
| chr15_-_5901514 | 0.63 |
ENSDART00000155252
|
si:ch73-281n10.2
|
si:ch73-281n10.2 |
| chr21_-_32436679 | 0.62 |
ENSDART00000076974
|
gfpt2
|
glutamine-fructose-6-phosphate transaminase 2 |
| chr20_+_10166297 | 0.61 |
ENSDART00000141877
|
kcnk10a
|
potassium channel, subfamily K, member 10a |
| chr22_+_18349794 | 0.60 |
ENSDART00000186580
|
gatad2ab
|
GATA zinc finger domain containing 2Ab |
| chr15_-_34892664 | 0.58 |
ENSDART00000153787
ENSDART00000099721 |
rnf183
|
ring finger protein 183 |
| chr21_-_37733571 | 0.58 |
ENSDART00000176214
|
mpp1
|
membrane protein, palmitoylated 1 |
| chr4_-_16124417 | 0.57 |
ENSDART00000128079
ENSDART00000077664 |
atp2b1a
|
ATPase plasma membrane Ca2+ transporting 1a |
| chr21_-_37733287 | 0.54 |
ENSDART00000157826
|
mpp1
|
membrane protein, palmitoylated 1 |
| chr4_+_33191390 | 0.53 |
ENSDART00000150429
|
si:dkey-247i3.6
|
si:dkey-247i3.6 |
| chr7_-_26436436 | 0.53 |
ENSDART00000019035
ENSDART00000123395 |
her8a
|
hairy-related 8a |
| chr23_+_7471072 | 0.52 |
ENSDART00000135551
|
si:ch211-200e2.1
|
si:ch211-200e2.1 |
| chr14_+_17137023 | 0.51 |
ENSDART00000080712
|
slc43a3b
|
solute carrier family 43, member 3b |
| chr22_+_27284462 | 0.51 |
ENSDART00000164660
|
si:ch73-103b2.1
|
si:ch73-103b2.1 |
| chr7_-_40656148 | 0.51 |
ENSDART00000142315
|
nom1
|
nucleolar protein with MIF4G domain 1 |
| chr20_-_25631256 | 0.51 |
ENSDART00000048164
|
paics
|
phosphoribosylaminoimidazole carboxylase, phosphoribosylaminoimidazole succinocarboxamide synthetase |
| chr20_-_39367895 | 0.51 |
ENSDART00000136476
ENSDART00000021788 ENSDART00000180784 |
pbk
|
PDZ binding kinase |
| chr1_-_49361905 | 0.50 |
ENSDART00000144349
ENSDART00000184496 |
si:dkeyp-80c12.8
|
si:dkeyp-80c12.8 |
| chr17_-_33416020 | 0.50 |
ENSDART00000140149
|
ccdc28a
|
coiled-coil domain containing 28A |
| chr8_+_53051701 | 0.50 |
ENSDART00000131514
|
nadka
|
NAD kinase a |
| chr5_+_15203421 | 0.49 |
ENSDART00000040826
|
tbx1
|
T-box 1 |
| chr11_+_44579865 | 0.49 |
ENSDART00000173425
|
nid1b
|
nidogen 1b |
| chr15_+_22014029 | 0.48 |
ENSDART00000079504
|
ankk1
|
ankyrin repeat and kinase domain containing 1 |
| chr25_+_30196039 | 0.48 |
ENSDART00000005299
|
hsd17b12a
|
hydroxysteroid (17-beta) dehydrogenase 12a |
| chr3_+_1150348 | 0.47 |
ENSDART00000148524
|
nol12
|
nucleolar protein 12 |
| chr4_-_64141714 | 0.47 |
ENSDART00000128628
|
BX914205.3
|
|
| chr8_-_13541514 | 0.47 |
ENSDART00000063834
|
zgc:86586
|
zgc:86586 |
| chr4_+_18963822 | 0.46 |
ENSDART00000066975
ENSDART00000066973 |
impdh1b
|
IMP (inosine 5'-monophosphate) dehydrogenase 1b |
| chr3_-_53092509 | 0.46 |
ENSDART00000062081
|
lpar2a
|
lysophosphatidic acid receptor 2a |
| chr4_-_77979432 | 0.46 |
ENSDART00000049170
|
zgc:85975
|
zgc:85975 |
| chr6_+_41452979 | 0.46 |
ENSDART00000007353
|
wdr82
|
WD repeat domain 82 |
| chr4_-_35989745 | 0.46 |
ENSDART00000162568
|
znf1125
|
zinc finger protein 1125 |
| chr4_+_43074375 | 0.45 |
ENSDART00000150732
|
znf1137
|
zinc finger protein 1137 |
| chr4_+_6032640 | 0.45 |
ENSDART00000157487
|
tfec
|
transcription factor EC |
| chr7_+_57088920 | 0.45 |
ENSDART00000024076
|
scamp2l
|
secretory carrier membrane protein 2, like |
| chr12_+_38878830 | 0.45 |
ENSDART00000156926
|
si:ch211-39f2.3
|
si:ch211-39f2.3 |
| chr25_-_17368231 | 0.44 |
ENSDART00000189291
|
cyp2x6
|
cytochrome P450, family 2, subfamily X, polypeptide 6 |
| chr10_+_36662640 | 0.44 |
ENSDART00000063359
|
ucp2
|
uncoupling protein 2 |
| chr15_-_34668485 | 0.44 |
ENSDART00000186605
|
bag6
|
BCL2 associated athanogene 6 |
| chr7_-_56606752 | 0.44 |
ENSDART00000138714
|
sult5a1
|
sulfotransferase family 5A, member 1 |
| chr6_+_58915889 | 0.44 |
ENSDART00000083628
|
ddit3
|
DNA-damage-inducible transcript 3 |
| chr14_+_9421510 | 0.43 |
ENSDART00000123652
|
hmgn6
|
high mobility group nucleosome binding domain 6 |
| chr7_+_57089354 | 0.42 |
ENSDART00000140702
|
scamp2l
|
secretory carrier membrane protein 2, like |
| chr13_-_36535128 | 0.42 |
ENSDART00000043312
|
srsf5a
|
serine/arginine-rich splicing factor 5a |
| chr12_+_30233977 | 0.42 |
ENSDART00000188135
|
afap1l2
|
actin filament associated protein 1-like 2 |
| chr11_+_7580079 | 0.42 |
ENSDART00000091550
ENSDART00000193223 ENSDART00000193386 |
adgrl2a
|
adhesion G protein-coupled receptor L2a |
| chr3_-_7524363 | 0.41 |
ENSDART00000162970
|
znf1001
|
zinc finger protein 1001 |
| chr3_+_32425202 | 0.41 |
ENSDART00000156464
|
prr12b
|
proline rich 12b |
| chr24_-_9979342 | 0.41 |
ENSDART00000138576
ENSDART00000191206 |
zgc:171977
|
zgc:171977 |
| chr16_-_27224246 | 0.40 |
ENSDART00000103257
|
alg2
|
asparagine-linked glycosylation 2 (alpha-1,3-mannosyltransferase) |
| chr13_-_24260609 | 0.40 |
ENSDART00000138747
|
urb2
|
URB2 ribosome biogenesis 2 homolog (S. cerevisiae) |
| chr23_+_18779043 | 0.40 |
ENSDART00000158267
|
emp3b
|
epithelial membrane protein 3b |
| chr2_-_25143373 | 0.40 |
ENSDART00000160108
|
nceh1a
|
neutral cholesterol ester hydrolase 1a |
| chr19_-_17304866 | 0.39 |
ENSDART00000160433
ENSDART00000190798 ENSDART00000171284 |
sf3a3
|
splicing factor 3a, subunit 3 |
| chr5_-_28041715 | 0.39 |
ENSDART00000078660
|
zgc:113436
|
zgc:113436 |
| chr12_+_46634736 | 0.39 |
ENSDART00000008009
|
trim16
|
tripartite motif containing 16 |
| chr4_-_67712607 | 0.38 |
ENSDART00000162955
|
znf1091
|
zinc finger protein 1091 |
| chr12_+_30234209 | 0.38 |
ENSDART00000102081
|
afap1l2
|
actin filament associated protein 1-like 2 |
| chr16_+_27224369 | 0.38 |
ENSDART00000136980
|
sec61b
|
Sec61 translocon beta subunit |
| chr3_-_1388936 | 0.38 |
ENSDART00000171278
|
ddx47
|
DEAD (Asp-Glu-Ala-Asp) box polypeptide 47 |
| chr8_-_52715911 | 0.38 |
ENSDART00000168241
|
tubb2b
|
tubulin, beta 2b |
| chr3_+_6469754 | 0.37 |
ENSDART00000185809
|
NUP85 (1 of many)
|
nucleoporin 85 |
| chr4_-_42015883 | 0.36 |
ENSDART00000163399
|
znf1145
|
zinc finger protein 1145 |
| chr11_-_308838 | 0.36 |
ENSDART00000112538
|
poc1a
|
POC1 centriolar protein A |
| chr7_+_48806420 | 0.36 |
ENSDART00000083431
|
cpt1aa
|
carnitine palmitoyltransferase 1Aa (liver) |
| chr4_+_13452437 | 0.35 |
ENSDART00000145069
|
dyrk2
|
dual-specificity tyrosine-(Y)-phosphorylation regulated kinase 2 |
| chr4_-_58846245 | 0.35 |
ENSDART00000170777
|
si:dkey-28i19.1
|
si:dkey-28i19.1 |
| chr16_+_51180938 | 0.35 |
ENSDART00000169022
|
hmgn2
|
high mobility group nucleosomal binding domain 2 |
| chr8_-_13029297 | 0.35 |
ENSDART00000144305
|
dennd2da
|
DENN/MADD domain containing 2Da |
| chr3_-_38783951 | 0.34 |
ENSDART00000155518
|
znf281a
|
zinc finger protein 281a |
| chr12_+_27024676 | 0.34 |
ENSDART00000153104
|
msl1b
|
male-specific lethal 1 homolog b (Drosophila) |
| chr7_+_19835569 | 0.34 |
ENSDART00000149812
|
ovol1a
|
ovo-like zinc finger 1a |
| chr9_-_45602978 | 0.33 |
ENSDART00000139019
ENSDART00000085763 |
agr1
|
anterior gradient 1 |
| chr14_-_31862657 | 0.33 |
ENSDART00000172870
ENSDART00000007927 ENSDART00000134748 ENSDART00000128730 |
rbmx
|
RNA binding motif protein, X-linked |
| chr4_+_13452907 | 0.33 |
ENSDART00000186116
|
dyrk2
|
dual-specificity tyrosine-(Y)-phosphorylation regulated kinase 2 |
| chr7_+_22792895 | 0.33 |
ENSDART00000184407
|
rbm4.3
|
RNA binding motif protein 4.3 |
| chr14_+_33329420 | 0.32 |
ENSDART00000171090
ENSDART00000164062 |
sowahd
|
sosondowah ankyrin repeat domain family d |
| chr6_+_54248705 | 0.32 |
ENSDART00000162469
|
pacsin1b
|
protein kinase C and casein kinase substrate in neurons 1b |
| chr14_+_52481288 | 0.32 |
ENSDART00000169164
ENSDART00000159297 |
tcerg1a
|
transcription elongation regulator 1a (CA150) |
| chr13_+_13033837 | 0.32 |
ENSDART00000079558
|
letm1
|
leucine zipper-EF-hand containing transmembrane protein 1 |
| chr15_+_25024685 | 0.32 |
ENSDART00000188889
|
BX908796.7
|
|
| chr5_+_26204561 | 0.32 |
ENSDART00000137178
|
marveld2b
|
MARVEL domain containing 2b |
| chr21_-_2565825 | 0.32 |
ENSDART00000169633
|
col4a3bpb
|
collagen, type IV, alpha 3 (Goodpasture antigen) binding protein b |
| chr4_-_193762 | 0.31 |
ENSDART00000169667
|
ptpro
|
protein tyrosine phosphatase, receptor type, O |
| chr5_+_19712011 | 0.31 |
ENSDART00000131924
|
fam222a
|
family with sequence similarity 222, member A |
| chr4_-_22519516 | 0.31 |
ENSDART00000130409
ENSDART00000186258 ENSDART00000002851 ENSDART00000123801 |
kdm7aa
|
lysine (K)-specific demethylase 7Aa |
| chr1_-_51474974 | 0.30 |
ENSDART00000152719
|
spred2a
|
sprouty-related, EVH1 domain containing 2a |
| chr1_-_55183088 | 0.30 |
ENSDART00000100619
|
LUC7L2
|
zgc:158803 |
| chr5_-_54712159 | 0.30 |
ENSDART00000149207
|
ccnb1
|
cyclin B1 |
| chr12_+_27156943 | 0.30 |
ENSDART00000153030
ENSDART00000001737 |
skap1
|
src kinase associated phosphoprotein 1 |
| chr4_+_38937575 | 0.29 |
ENSDART00000150385
|
znf997
|
zinc finger protein 997 |
| chr14_-_42997145 | 0.29 |
ENSDART00000172801
|
pcdh10b
|
protocadherin 10b |
| chr13_-_12006007 | 0.29 |
ENSDART00000111438
|
mgea5
|
meningioma expressed antigen 5 (hyaluronidase) |
| chr24_+_5935377 | 0.29 |
ENSDART00000191989
ENSDART00000185932 ENSDART00000131768 |
abi1a
|
abl-interactor 1a |
| chr6_-_56111829 | 0.29 |
ENSDART00000154397
|
gcnt7
|
glucosaminyl (N-acetyl) transferase family member 7 |
| chr6_-_35401282 | 0.28 |
ENSDART00000127612
|
rgs5a
|
regulator of G protein signaling 5a |
| chr11_+_6116503 | 0.28 |
ENSDART00000176170
|
nr2f6b
|
nuclear receptor subfamily 2, group F, member 6b |
| chr25_-_13728111 | 0.28 |
ENSDART00000169865
|
lcat
|
lecithin-cholesterol acyltransferase |
| chr6_+_72040 | 0.28 |
ENSDART00000122957
|
crygm4
|
crystallin, gamma M4 |
| chr2_+_327081 | 0.28 |
ENSDART00000155595
|
zgc:174263
|
zgc:174263 |
| chr5_-_36592307 | 0.27 |
ENSDART00000126927
ENSDART00000051196 |
taf1
|
TAF1 RNA polymerase II, TATA box binding protein (TBP)-associated factor |
| chr23_-_9492055 | 0.27 |
ENSDART00000139688
|
soga1
|
suppressor of glucose, autophagy associated 1 |
| chr10_+_44692272 | 0.27 |
ENSDART00000157458
|
ubc
|
ubiquitin C |
| chr21_-_36396334 | 0.27 |
ENSDART00000183627
|
mrpl22
|
mitochondrial ribosomal protein L22 |
| chr2_-_30611389 | 0.27 |
ENSDART00000142500
|
ctnnd2b
|
catenin (cadherin-associated protein), delta 2b |
| chr21_+_36396864 | 0.27 |
ENSDART00000137309
|
gemin5
|
gem (nuclear organelle) associated protein 5 |
| chr16_+_27224068 | 0.26 |
ENSDART00000059013
|
sec61b
|
Sec61 translocon beta subunit |
| chr6_+_3864040 | 0.26 |
ENSDART00000013743
|
gorasp2
|
golgi reassembly stacking protein 2 |
| chr19_+_7154500 | 0.25 |
ENSDART00000035967
ENSDART00000160894 |
brd2a
|
bromodomain containing 2a |
| chr16_-_27224000 | 0.25 |
ENSDART00000126347
|
alg2
|
asparagine-linked glycosylation 2 (alpha-1,3-mannosyltransferase) |
| chr15_-_4596623 | 0.25 |
ENSDART00000132227
|
eif4h
|
eukaryotic translation initiation factor 4h |
| chr12_+_48841182 | 0.25 |
ENSDART00000109315
ENSDART00000185609 ENSDART00000187217 |
dlg5b.1
|
discs, large homolog 5b (Drosophila), tandem duplicate 1 |
| chr18_-_7448047 | 0.24 |
ENSDART00000193213
ENSDART00000131940 ENSDART00000186944 ENSDART00000052803 |
si:dkey-30c15.10
|
si:dkey-30c15.10 |
| chr3_-_40162843 | 0.24 |
ENSDART00000129664
ENSDART00000025285 |
drg2
|
developmentally regulated GTP binding protein 2 |
| chr5_+_58665648 | 0.24 |
ENSDART00000167481
|
zgc:194948
|
zgc:194948 |
| chr4_-_26035770 | 0.24 |
ENSDART00000124514
|
usp44
|
ubiquitin specific peptidase 44 |
| chr7_+_73670137 | 0.24 |
ENSDART00000050357
|
btr12
|
bloodthirsty-related gene family, member 12 |
| chr22_+_18319230 | 0.24 |
ENSDART00000184747
ENSDART00000184649 |
gatad2ab
|
GATA zinc finger domain containing 2Ab |
| chr23_-_9492266 | 0.23 |
ENSDART00000091852
|
soga1
|
suppressor of glucose, autophagy associated 1 |
| chr8_+_36554816 | 0.23 |
ENSDART00000126687
|
sf3a1
|
splicing factor 3a, subunit 1 |
| chr17_-_33415740 | 0.23 |
ENSDART00000135218
|
ccdc28a
|
coiled-coil domain containing 28A |
| chr8_-_36554675 | 0.23 |
ENSDART00000132804
ENSDART00000078746 |
ccdc157
|
coiled-coil domain containing 157 |
| chr20_-_22193190 | 0.23 |
ENSDART00000047624
|
tmem165
|
transmembrane protein 165 |
| chr23_-_21446985 | 0.23 |
ENSDART00000044080
|
her12
|
hairy-related 12 |
| chr11_-_36350876 | 0.23 |
ENSDART00000146495
ENSDART00000020655 |
psma5
|
proteasome subunit alpha 5 |
| chr22_-_38459316 | 0.23 |
ENSDART00000149683
ENSDART00000098461 |
ptk7a
|
protein tyrosine kinase 7a |
| chr14_+_6535426 | 0.23 |
ENSDART00000055961
|
thg1l
|
tRNA-histidine guanylyltransferase 1-like |
| chr9_+_21260314 | 0.23 |
ENSDART00000145943
|
ska3
|
spindle and kinetochore associated complex subunit 3 |
| chr11_-_309420 | 0.22 |
ENSDART00000173185
|
poc1a
|
POC1 centriolar protein A |
| chr8_+_22327251 | 0.22 |
ENSDART00000075129
|
lrrc47
|
leucine rich repeat containing 47 |
| chr22_+_18319666 | 0.22 |
ENSDART00000033103
|
gatad2ab
|
GATA zinc finger domain containing 2Ab |
| chr12_-_21681509 | 0.22 |
ENSDART00000112726
|
eme1
|
essential meiotic structure-specific endonuclease 1 |
| chr15_-_21014270 | 0.21 |
ENSDART00000154019
|
si:ch211-212c13.10
|
si:ch211-212c13.10 |
| chr7_-_59256806 | 0.21 |
ENSDART00000167955
|
m1ap
|
meiosis 1 associated protein |
| chr12_-_4475890 | 0.21 |
ENSDART00000092492
|
si:ch211-173d10.1
|
si:ch211-173d10.1 |
| chr21_-_2310355 | 0.21 |
ENSDART00000183326
|
si:ch211-241b2.1
|
si:ch211-241b2.1 |
| chr5_-_67750907 | 0.21 |
ENSDART00000172097
|
b4galt4
|
UDP-Gal:betaGlcNAc beta 1,4- galactosyltransferase, polypeptide 4 |
| chr8_-_29822527 | 0.21 |
ENSDART00000167487
|
slc20a2
|
solute carrier family 20 (phosphate transporter), member 2 |
| chr21_+_30007566 | 0.21 |
ENSDART00000149124
ENSDART00000150071 |
ttc1
|
tetratricopeptide repeat domain 1 |
| chr20_-_14012859 | 0.20 |
ENSDART00000152429
|
si:ch211-22i13.2
|
si:ch211-22i13.2 |
| chr5_+_50953240 | 0.20 |
ENSDART00000148501
ENSDART00000149892 ENSDART00000190312 |
col4a3bpa
|
collagen, type IV, alpha 3 (Goodpasture antigen) binding protein a |
| chr3_-_23575007 | 0.20 |
ENSDART00000155282
ENSDART00000087726 |
igf2bp1
|
insulin-like growth factor 2 mRNA binding protein 1 |
| chr18_+_5172848 | 0.19 |
ENSDART00000190642
|
CABZ01080599.1
|
|
| chr2_-_58075414 | 0.19 |
ENSDART00000161920
|
nectin4
|
nectin cell adhesion molecule 4 |
| chr14_+_28438947 | 0.19 |
ENSDART00000006489
|
acsl4a
|
acyl-CoA synthetase long chain family member 4a |
| chr18_+_33725576 | 0.19 |
ENSDART00000146816
|
si:dkey-145c18.5
|
si:dkey-145c18.5 |
| chr1_-_11104805 | 0.19 |
ENSDART00000147648
|
knl1
|
kinetochore scaffold 1 |
| chr2_+_47906240 | 0.19 |
ENSDART00000122206
|
ftr23
|
finTRIM family, member 23 |
| chr6_+_4387150 | 0.19 |
ENSDART00000181283
|
rbm26
|
RNA binding motif protein 26 |
| chr10_-_36793412 | 0.19 |
ENSDART00000185966
|
dhrs13a.2
|
dehydrogenase/reductase (SDR family) member 13a, tandem duplicate 2 |
| chr11_-_36350421 | 0.19 |
ENSDART00000141477
|
psma5
|
proteasome subunit alpha 5 |
| chr11_+_3246059 | 0.19 |
ENSDART00000161529
|
timeless
|
timeless circadian clock |
| chr7_-_54430505 | 0.19 |
ENSDART00000167905
|
ano1
|
anoctamin 1, calcium activated chloride channel |
| chr21_-_13668358 | 0.19 |
ENSDART00000180323
|
pnpla7a
|
patatin-like phospholipase domain containing 7a |
| chr5_+_20319519 | 0.19 |
ENSDART00000004217
|
coro1ca
|
coronin, actin binding protein, 1Ca |
| chr12_-_10476448 | 0.19 |
ENSDART00000106172
|
rac1a
|
Rac family small GTPase 1a |
| chr10_-_6587066 | 0.19 |
ENSDART00000171833
|
chd1
|
chromodomain helicase DNA binding protein 1 |
| chr6_-_27108844 | 0.18 |
ENSDART00000073883
|
dtymk
|
deoxythymidylate kinase (thymidylate kinase) |
| chr15_+_12429206 | 0.18 |
ENSDART00000168997
|
tmprss4a
|
transmembrane protease, serine 4a |
| chr6_+_52927651 | 0.18 |
ENSDART00000141094
|
si:dkeyp-3f10.11
|
si:dkeyp-3f10.11 |
| chr17_+_23255365 | 0.18 |
ENSDART00000180277
|
AL935174.5
|
|
| chr10_-_1523253 | 0.18 |
ENSDART00000179510
ENSDART00000176548 ENSDART00000180368 ENSDART00000185270 |
WDR70
|
WD repeat domain 70 |
| chr9_-_41088279 | 0.18 |
ENSDART00000000564
|
asnsd1
|
asparagine synthetase domain containing 1 |
| chr8_-_20914829 | 0.18 |
ENSDART00000025356
|
haus5
|
HAUS augmin-like complex, subunit 5 |
| chr22_-_21176269 | 0.18 |
ENSDART00000112839
|
rex1bd
|
required for excision 1-B domain containing |
| chr3_+_41585298 | 0.18 |
ENSDART00000182370
|
card11
|
caspase recruitment domain family, member 11 |
| chr12_+_48841419 | 0.18 |
ENSDART00000125331
|
dlg5b.1
|
discs, large homolog 5b (Drosophila), tandem duplicate 1 |
| chr16_+_33938227 | 0.18 |
ENSDART00000166254
|
gpn2
|
GPN-loop GTPase 2 |
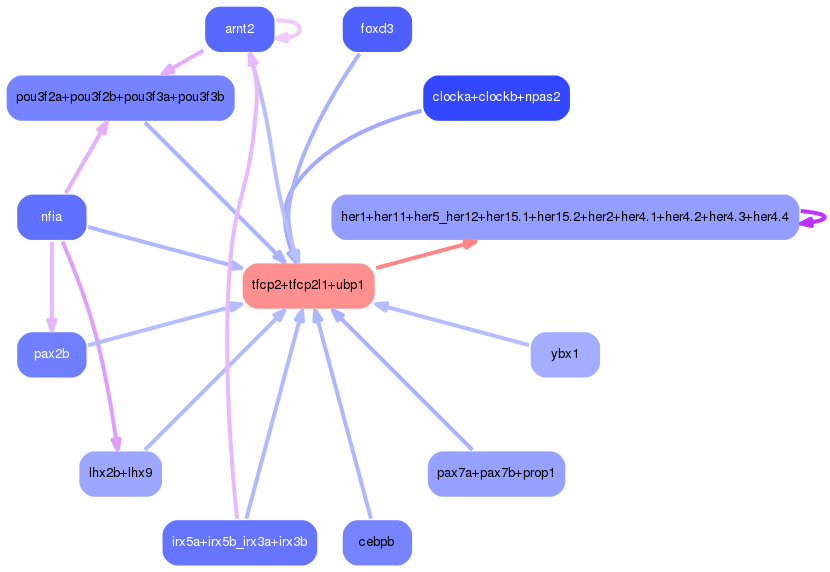
Network of associatons between targets according to the STRING database.

First level regulatory network of tfcp2+tfcp2l1+ubp1
Gene Ontology Analysis
Gene overrepresentation in biological process category:
| Log-likelihood per target | Total log-likelihood | Term | Description |
|---|---|---|---|
| 0.3 | 0.8 | GO:0034382 | chylomicron remnant clearance(GO:0034382) triglyceride-rich lipoprotein particle clearance(GO:0071830) intermediate-density lipoprotein particle clearance(GO:0071831) |
| 0.3 | 0.8 | GO:0032757 | interleukin-8 production(GO:0032637) regulation of interleukin-8 production(GO:0032677) positive regulation of interleukin-8 production(GO:0032757) |
| 0.2 | 0.9 | GO:0055107 | Golgi to secretory granule transport(GO:0055107) |
| 0.2 | 1.1 | GO:0061194 | rhombomere 5 development(GO:0021571) rhombomere 6 development(GO:0021572) tongue development(GO:0043586) tongue morphogenesis(GO:0043587) taste bud development(GO:0061193) taste bud morphogenesis(GO:0061194) taste bud formation(GO:0061195) |
| 0.2 | 0.7 | GO:0061181 | regulation of chondrocyte development(GO:0061181) |
| 0.2 | 0.5 | GO:0003156 | regulation of organ formation(GO:0003156) |
| 0.2 | 0.5 | GO:0034214 | protein hexamerization(GO:0034214) |
| 0.2 | 0.5 | GO:0080182 | histone H3-K4 trimethylation(GO:0080182) |
| 0.1 | 0.6 | GO:0034505 | tooth mineralization(GO:0034505) |
| 0.1 | 1.0 | GO:0033387 | putrescine biosynthetic process from ornithine(GO:0033387) |
| 0.1 | 0.4 | GO:2001244 | positive regulation of intrinsic apoptotic signaling pathway(GO:2001244) |
| 0.1 | 2.7 | GO:0001757 | somite specification(GO:0001757) |
| 0.1 | 0.4 | GO:0015074 | DNA integration(GO:0015074) |
| 0.1 | 0.5 | GO:0045647 | negative regulation of erythrocyte differentiation(GO:0045647) |
| 0.1 | 0.6 | GO:0031204 | posttranslational protein targeting to membrane, translocation(GO:0031204) |
| 0.1 | 0.7 | GO:0000056 | ribosomal small subunit export from nucleus(GO:0000056) |
| 0.1 | 0.9 | GO:0019372 | lipoxygenase pathway(GO:0019372) linoleic acid metabolic process(GO:0043651) hepoxilin metabolic process(GO:0051121) hepoxilin biosynthetic process(GO:0051122) |
| 0.1 | 0.2 | GO:0071421 | manganese ion transmembrane transport(GO:0071421) |
| 0.1 | 1.5 | GO:0060158 | phospholipase C-activating dopamine receptor signaling pathway(GO:0060158) |
| 0.1 | 0.5 | GO:0006741 | NADP biosynthetic process(GO:0006741) |
| 0.1 | 0.8 | GO:0006607 | NLS-bearing protein import into nucleus(GO:0006607) |
| 0.1 | 0.4 | GO:0033169 | histone H3-K9 demethylation(GO:0033169) |
| 0.1 | 0.3 | GO:0048025 | negative regulation of RNA splicing(GO:0033119) negative regulation of mRNA splicing, via spliceosome(GO:0048025) |
| 0.1 | 0.2 | GO:0009211 | pyrimidine deoxyribonucleoside triphosphate metabolic process(GO:0009211) |
| 0.1 | 0.2 | GO:0051352 | negative regulation of ligase activity(GO:0051352) negative regulation of ubiquitin-protein transferase activity(GO:0051444) negative regulation of ubiquitin protein ligase activity(GO:1904667) |
| 0.1 | 0.5 | GO:0006703 | estrogen biosynthetic process(GO:0006703) |
| 0.1 | 0.4 | GO:1990845 | adaptive thermogenesis(GO:1990845) |
| 0.1 | 0.5 | GO:0006189 | 'de novo' IMP biosynthetic process(GO:0006189) |
| 0.1 | 0.3 | GO:0010799 | regulation of peptidyl-threonine phosphorylation(GO:0010799) negative regulation of peptidyl-threonine phosphorylation(GO:0010801) |
| 0.0 | 0.3 | GO:0070285 | pigment cell development(GO:0070285) |
| 0.0 | 0.2 | GO:0071459 | protein localization to kinetochore(GO:0034501) protein localization to chromosome, centromeric region(GO:0071459) |
| 0.0 | 0.5 | GO:0006177 | GMP biosynthetic process(GO:0006177) GMP metabolic process(GO:0046037) |
| 0.0 | 0.2 | GO:0006529 | asparagine biosynthetic process(GO:0006529) |
| 0.0 | 0.7 | GO:0006490 | oligosaccharide-lipid intermediate biosynthetic process(GO:0006490) |
| 0.0 | 0.1 | GO:0003249 | cell proliferation involved in heart valve morphogenesis(GO:0003249) regulation of cell proliferation involved in heart valve morphogenesis(GO:0003250) endocardial cell development(GO:0060958) cell proliferation involved in heart valve development(GO:2000793) |
| 0.0 | 0.2 | GO:0007060 | male meiosis chromosome segregation(GO:0007060) |
| 0.0 | 0.2 | GO:0000741 | karyogamy(GO:0000741) pronuclear fusion(GO:0007344) |
| 0.0 | 0.4 | GO:0061484 | hematopoietic stem cell homeostasis(GO:0061484) |
| 0.0 | 0.6 | GO:0006002 | fructose 6-phosphate metabolic process(GO:0006002) |
| 0.0 | 0.2 | GO:0043111 | replication fork arrest(GO:0043111) |
| 0.0 | 0.3 | GO:0021794 | thalamus development(GO:0021794) |
| 0.0 | 0.4 | GO:0031998 | regulation of fatty acid beta-oxidation(GO:0031998) |
| 0.0 | 0.2 | GO:0097010 | eukaryotic translation initiation factor 4F complex assembly(GO:0097010) |
| 0.0 | 0.2 | GO:0031106 | septin ring organization(GO:0031106) septin cytoskeleton organization(GO:0032185) |
| 0.0 | 0.3 | GO:0043984 | histone H4-K16 acetylation(GO:0043984) |
| 0.0 | 0.3 | GO:0007080 | mitotic metaphase plate congression(GO:0007080) |
| 0.0 | 0.3 | GO:0090660 | cerebrospinal fluid circulation(GO:0090660) |
| 0.0 | 0.2 | GO:1900744 | regulation of p38MAPK cascade(GO:1900744) |
| 0.0 | 0.3 | GO:0015015 | heparan sulfate proteoglycan biosynthetic process, enzymatic modification(GO:0015015) |
| 0.0 | 0.1 | GO:1990403 | embryonic brain development(GO:1990403) |
| 0.0 | 0.6 | GO:0046475 | glycerophospholipid catabolic process(GO:0046475) |
| 0.0 | 0.2 | GO:0050911 | detection of chemical stimulus involved in sensory perception of smell(GO:0050911) |
| 0.0 | 0.2 | GO:0016081 | synaptic vesicle docking(GO:0016081) presynaptic dense core granule exocytosis(GO:0099525) |
| 0.0 | 0.2 | GO:0001955 | blood vessel maturation(GO:0001955) |
| 0.0 | 0.6 | GO:0030322 | stabilization of membrane potential(GO:0030322) |
| 0.0 | 0.1 | GO:1901533 | negative regulation of hematopoietic progenitor cell differentiation(GO:1901533) |
| 0.0 | 0.1 | GO:0051044 | positive regulation of membrane protein ectodomain proteolysis(GO:0051044) |
| 0.0 | 0.3 | GO:0051123 | RNA polymerase II transcriptional preinitiation complex assembly(GO:0051123) |
| 0.0 | 0.3 | GO:0060088 | auditory receptor cell stereocilium organization(GO:0060088) |
| 0.0 | 0.2 | GO:1902299 | pre-replicative complex assembly involved in nuclear cell cycle DNA replication(GO:0006267) pre-replicative complex assembly(GO:0036388) pre-replicative complex assembly involved in cell cycle DNA replication(GO:1902299) |
| 0.0 | 0.2 | GO:0031573 | intra-S DNA damage checkpoint(GO:0031573) |
| 0.0 | 0.1 | GO:0034063 | stress granule assembly(GO:0034063) |
| 0.0 | 0.1 | GO:0043654 | recognition of apoptotic cell(GO:0043654) |
| 0.0 | 0.1 | GO:2000582 | positive regulation of microtubule motor activity(GO:2000576) regulation of ATP-dependent microtubule motor activity, plus-end-directed(GO:2000580) positive regulation of ATP-dependent microtubule motor activity, plus-end-directed(GO:2000582) |
| 0.0 | 0.2 | GO:0006659 | phosphatidylserine biosynthetic process(GO:0006659) |
| 0.0 | 0.1 | GO:0006556 | S-adenosylmethionine biosynthetic process(GO:0006556) |
| 0.0 | 0.1 | GO:0000423 | macromitophagy(GO:0000423) |
| 0.0 | 0.1 | GO:0009263 | deoxyribonucleotide biosynthetic process(GO:0009263) |
| 0.0 | 0.5 | GO:0010499 | proteasomal ubiquitin-independent protein catabolic process(GO:0010499) |
| 0.0 | 0.2 | GO:0050732 | negative regulation of peptidyl-tyrosine phosphorylation(GO:0050732) negative regulation of protein tyrosine kinase activity(GO:0061099) |
| 0.0 | 0.1 | GO:0060397 | JAK-STAT cascade involved in growth hormone signaling pathway(GO:0060397) |
| 0.0 | 0.1 | GO:0006542 | glutamine biosynthetic process(GO:0006542) |
| 0.0 | 0.1 | GO:0045053 | protein retention in Golgi apparatus(GO:0045053) |
| 0.0 | 0.7 | GO:0018107 | peptidyl-threonine phosphorylation(GO:0018107) |
| 0.0 | 0.0 | GO:1901187 | regulation of ephrin receptor signaling pathway(GO:1901187) |
| 0.0 | 0.3 | GO:0051923 | sulfation(GO:0051923) |
| 0.0 | 0.2 | GO:0043154 | negative regulation of cysteine-type endopeptidase activity involved in apoptotic process(GO:0043154) |
| 0.0 | 0.9 | GO:0015718 | monocarboxylic acid transport(GO:0015718) |
| 0.0 | 0.0 | GO:0070987 | error-free translesion synthesis(GO:0070987) |
Gene overrepresentation in cellular component category:
| Log-likelihood per target | Total log-likelihood | Term | Description |
|---|---|---|---|
| 0.2 | 0.8 | GO:0034363 | intermediate-density lipoprotein particle(GO:0034363) |
| 0.1 | 0.6 | GO:0005784 | Sec61 translocon complex(GO:0005784) |
| 0.1 | 0.3 | GO:0097125 | cyclin B1-CDK1 complex(GO:0097125) |
| 0.1 | 0.4 | GO:0071818 | BAT3 complex(GO:0071818) |
| 0.1 | 1.1 | GO:0016581 | NuRD complex(GO:0016581) CHD-type complex(GO:0090545) |
| 0.1 | 0.3 | GO:0070062 | extracellular exosome(GO:0070062) |
| 0.1 | 0.2 | GO:0005953 | CAAX-protein geranylgeranyltransferase complex(GO:0005953) |
| 0.0 | 0.9 | GO:0032588 | trans-Golgi network membrane(GO:0032588) |
| 0.0 | 0.3 | GO:0072487 | MSL complex(GO:0072487) |
| 0.0 | 0.4 | GO:0019773 | proteasome core complex, alpha-subunit complex(GO:0019773) |
| 0.0 | 0.2 | GO:0031298 | replication fork protection complex(GO:0031298) |
| 0.0 | 0.2 | GO:0048476 | Holliday junction resolvase complex(GO:0048476) |
| 0.0 | 0.2 | GO:0005826 | actomyosin contractile ring(GO:0005826) |
| 0.0 | 0.1 | GO:1990316 | ATG1/ULK1 kinase complex(GO:1990316) |
| 0.0 | 0.1 | GO:0030121 | AP-1 adaptor complex(GO:0030121) |
| 0.0 | 0.1 | GO:0048269 | methionine adenosyltransferase complex(GO:0048269) |
| 0.0 | 0.5 | GO:0048188 | Set1C/COMPASS complex(GO:0048188) |
| 0.0 | 0.1 | GO:0071065 | alpha9-beta1 integrin-vascular cell adhesion molecule-1 complex(GO:0071065) |
| 0.0 | 0.2 | GO:0070652 | HAUS complex(GO:0070652) |
| 0.0 | 0.1 | GO:0070847 | core mediator complex(GO:0070847) |
| 0.0 | 0.2 | GO:0070937 | CRD-mediated mRNA stability complex(GO:0070937) |
| 0.0 | 0.1 | GO:0071203 | WASH complex(GO:0071203) |
| 0.0 | 0.1 | GO:0036156 | inner dynein arm(GO:0036156) |
| 0.0 | 0.3 | GO:0030992 | intraciliary transport particle B(GO:0030992) |
| 0.0 | 0.1 | GO:0000127 | transcription factor TFIIIC complex(GO:0000127) |
| 0.0 | 0.2 | GO:0000940 | condensed chromosome outer kinetochore(GO:0000940) |
| 0.0 | 0.1 | GO:1902636 | kinociliary basal body(GO:1902636) |
| 0.0 | 0.1 | GO:0000408 | EKC/KEOPS complex(GO:0000408) |
| 0.0 | 0.3 | GO:0005669 | transcription factor TFIID complex(GO:0005669) |
| 0.0 | 0.2 | GO:0042555 | MCM complex(GO:0042555) |
| 0.0 | 0.5 | GO:0032587 | ruffle membrane(GO:0032587) |
| 0.0 | 0.1 | GO:0030990 | intraciliary transport particle(GO:0030990) |
| 0.0 | 0.2 | GO:0005686 | U2 snRNP(GO:0005686) |
Gene overrepresentation in molecular function category:
| Log-likelihood per target | Total log-likelihood | Term | Description |
|---|---|---|---|
| 0.3 | 0.8 | GO:0043395 | heparan sulfate proteoglycan binding(GO:0043395) |
| 0.2 | 1.5 | GO:0031826 | type 2A serotonin receptor binding(GO:0031826) |
| 0.2 | 0.7 | GO:0000033 | alpha-1,3-mannosyltransferase activity(GO:0000033) |
| 0.1 | 0.8 | GO:0042169 | SH2 domain binding(GO:0042169) |
| 0.1 | 1.1 | GO:0005105 | type 1 fibroblast growth factor receptor binding(GO:0005105) |
| 0.1 | 0.9 | GO:0004051 | arachidonate 5-lipoxygenase activity(GO:0004051) |
| 0.1 | 0.5 | GO:0004639 | phosphoribosylaminoimidazolesuccinocarboxamide synthase activity(GO:0004639) |
| 0.1 | 0.6 | GO:0070548 | L-glutamine aminotransferase activity(GO:0070548) |
| 0.1 | 0.5 | GO:0051139 | calcium:proton antiporter activity(GO:0015369) metal ion:proton antiporter activity(GO:0051139) |
| 0.1 | 1.0 | GO:0004586 | ornithine decarboxylase activity(GO:0004586) |
| 0.1 | 0.4 | GO:0017077 | oxidative phosphorylation uncoupler activity(GO:0017077) |
| 0.1 | 0.6 | GO:0017095 | heparan sulfate 6-O-sulfotransferase activity(GO:0017095) |
| 0.1 | 2.3 | GO:0031492 | nucleosomal DNA binding(GO:0031492) |
| 0.1 | 0.4 | GO:0035575 | histone demethylase activity (H4-K20 specific)(GO:0035575) |
| 0.1 | 0.5 | GO:0003938 | IMP dehydrogenase activity(GO:0003938) |
| 0.1 | 0.7 | GO:0005049 | nuclear export signal receptor activity(GO:0005049) |
| 0.1 | 0.2 | GO:0009041 | uridylate kinase activity(GO:0009041) |
| 0.1 | 0.5 | GO:0004303 | estradiol 17-beta-dehydrogenase activity(GO:0004303) |
| 0.1 | 0.2 | GO:0004826 | phenylalanine-tRNA ligase activity(GO:0004826) |
| 0.1 | 0.2 | GO:0004662 | CAAX-protein geranylgeranyltransferase activity(GO:0004662) |
| 0.1 | 0.4 | GO:0004095 | carnitine O-palmitoyltransferase activity(GO:0004095) O-palmitoyltransferase activity(GO:0016416) |
| 0.0 | 0.8 | GO:0005487 | nucleocytoplasmic transporter activity(GO:0005487) |
| 0.0 | 0.2 | GO:0004066 | asparagine synthase (glutamine-hydrolyzing) activity(GO:0004066) |
| 0.0 | 0.2 | GO:0043140 | ATP-dependent 3'-5' DNA helicase activity(GO:0043140) single-stranded DNA-dependent ATP-dependent 3'-5' DNA helicase activity(GO:1990518) |
| 0.0 | 0.2 | GO:0005384 | manganese ion transmembrane transporter activity(GO:0005384) |
| 0.0 | 0.2 | GO:0033592 | RNA strand annealing activity(GO:0033592) RNA strand-exchange activity(GO:0034057) |
| 0.0 | 0.2 | GO:0070568 | guanylyltransferase activity(GO:0070568) |
| 0.0 | 0.2 | GO:0035529 | NADH pyrophosphatase activity(GO:0035529) |
| 0.0 | 0.5 | GO:0070915 | lysophosphatidic acid receptor activity(GO:0070915) |
| 0.0 | 1.2 | GO:0004712 | protein serine/threonine/tyrosine kinase activity(GO:0004712) |
| 0.0 | 0.2 | GO:0052650 | NADP-retinol dehydrogenase activity(GO:0052650) |
| 0.0 | 0.2 | GO:0004984 | olfactory receptor activity(GO:0004984) odorant binding(GO:0005549) |
| 0.0 | 0.3 | GO:0030296 | protein tyrosine kinase activator activity(GO:0030296) |
| 0.0 | 0.6 | GO:0022841 | leak channel activity(GO:0022840) potassium ion leak channel activity(GO:0022841) narrow pore channel activity(GO:0022842) |
| 0.0 | 0.2 | GO:0019992 | diacylglycerol binding(GO:0019992) |
| 0.0 | 0.6 | GO:0005388 | calcium-transporting ATPase activity(GO:0005388) |
| 0.0 | 0.1 | GO:0061731 | ribonucleoside-diphosphate reductase activity, thioredoxin disulfide as acceptor(GO:0004748) oxidoreductase activity, acting on CH or CH2 groups, disulfide as acceptor(GO:0016728) ribonucleoside-diphosphate reductase activity(GO:0061731) |
| 0.0 | 0.5 | GO:0042800 | histone methyltransferase activity (H3-K4 specific)(GO:0042800) |
| 0.0 | 0.3 | GO:0031386 | protein tag(GO:0031386) |
| 0.0 | 0.2 | GO:0008511 | sodium:potassium:chloride symporter activity(GO:0008511) |
| 0.0 | 0.2 | GO:0050700 | CARD domain binding(GO:0050700) |
| 0.0 | 0.2 | GO:0047676 | arachidonate-CoA ligase activity(GO:0047676) |
| 0.0 | 0.3 | GO:0017025 | TBP-class protein binding(GO:0017025) |
| 0.0 | 0.4 | GO:0051787 | misfolded protein binding(GO:0051787) |
| 0.0 | 0.2 | GO:0005315 | inorganic phosphate transmembrane transporter activity(GO:0005315) |
| 0.0 | 0.5 | GO:0003951 | NAD+ kinase activity(GO:0003951) |
| 0.0 | 0.8 | GO:0008028 | monocarboxylic acid transmembrane transporter activity(GO:0008028) |
| 0.0 | 0.3 | GO:0004622 | lysophospholipase activity(GO:0004622) |
| 0.0 | 0.1 | GO:0004356 | glutamate-ammonia ligase activity(GO:0004356) ammonia ligase activity(GO:0016211) acid-ammonia (or amide) ligase activity(GO:0016880) |
| 0.0 | 2.6 | GO:0046982 | protein heterodimerization activity(GO:0046982) |
| 0.0 | 0.3 | GO:0004806 | triglyceride lipase activity(GO:0004806) |
| 0.0 | 0.1 | GO:0030116 | glial cell-derived neurotrophic factor receptor binding(GO:0030116) |
| 0.0 | 0.1 | GO:0030169 | low-density lipoprotein particle binding(GO:0030169) |
| 0.0 | 0.1 | GO:0005225 | volume-sensitive anion channel activity(GO:0005225) |
| 0.0 | 0.1 | GO:0004985 | opioid receptor activity(GO:0004985) |
| 0.0 | 0.1 | GO:0008502 | melatonin receptor activity(GO:0008502) |
Gene overrepresentation in curated gene sets: canonical pathways category:
| Log-likelihood per target | Total log-likelihood | Term | Description |
|---|---|---|---|
| 0.0 | 1.3 | PID MYC ACTIV PATHWAY | Validated targets of C-MYC transcriptional activation |
| 0.0 | 0.1 | PID IL5 PATHWAY | IL5-mediated signaling events |
| 0.0 | 0.4 | PID ATR PATHWAY | ATR signaling pathway |
| 0.0 | 0.7 | ST FAS SIGNALING PATHWAY | Fas Signaling Pathway |
| 0.0 | 0.4 | PID HNF3B PATHWAY | FOXA2 and FOXA3 transcription factor networks |
| 0.0 | 0.5 | PID P53 REGULATION PATHWAY | p53 pathway |
| 0.0 | 0.4 | PID ATF2 PATHWAY | ATF-2 transcription factor network |
Gene overrepresentation in curated gene sets: REACTOME pathways category:
| Log-likelihood per target | Total log-likelihood | Term | Description |
|---|---|---|---|
| 0.2 | 0.9 | REACTOME ACYL CHAIN REMODELLING OF PS | Genes involved in Acyl chain remodelling of PS |
| 0.1 | 1.0 | REACTOME METABOLISM OF POLYAMINES | Genes involved in Metabolism of polyamines |
| 0.0 | 0.4 | REACTOME ACTIVATION OF CHAPERONE GENES BY ATF6 ALPHA | Genes involved in Activation of Chaperone Genes by ATF6-alpha |
| 0.0 | 0.7 | REACTOME HS GAG BIOSYNTHESIS | Genes involved in HS-GAG biosynthesis |
| 0.0 | 0.5 | REACTOME PURINE RIBONUCLEOSIDE MONOPHOSPHATE BIOSYNTHESIS | Genes involved in Purine ribonucleoside monophosphate biosynthesis |
| 0.0 | 0.3 | REACTOME G2 M DNA DAMAGE CHECKPOINT | Genes involved in G2/M DNA damage checkpoint |
| 0.0 | 0.4 | REACTOME POST CHAPERONIN TUBULIN FOLDING PATHWAY | Genes involved in Post-chaperonin tubulin folding pathway |
| 0.0 | 1.0 | REACTOME ER PHAGOSOME PATHWAY | Genes involved in ER-Phagosome pathway |
| 0.0 | 0.6 | REACTOME BIOSYNTHESIS OF THE N GLYCAN PRECURSOR DOLICHOL LIPID LINKED OLIGOSACCHARIDE LLO AND TRANSFER TO A NASCENT PROTEIN | Genes involved in Biosynthesis of the N-glycan precursor (dolichol lipid-linked oligosaccharide, LLO) and transfer to a nascent protein |
| 0.0 | 0.3 | REACTOME SYNTHESIS AND INTERCONVERSION OF NUCLEOTIDE DI AND TRIPHOSPHATES | Genes involved in Synthesis and interconversion of nucleotide di- and triphosphates |
| 0.0 | 0.2 | REACTOME UNWINDING OF DNA | Genes involved in Unwinding of DNA |
| 0.0 | 0.2 | REACTOME THE ACTIVATION OF ARYLSULFATASES | Genes involved in The activation of arylsulfatases |
| 0.0 | 0.8 | REACTOME ANTIVIRAL MECHANISM BY IFN STIMULATED GENES | Genes involved in Antiviral mechanism by IFN-stimulated genes |
| 0.0 | 0.1 | REACTOME NEF MEDIATED DOWNREGULATION OF MHC CLASS I COMPLEX CELL SURFACE EXPRESSION | Genes involved in Nef mediated downregulation of MHC class I complex cell surface expression |
| 0.0 | 0.2 | REACTOME SIGNALING BY FGFR1 FUSION MUTANTS | Genes involved in Signaling by FGFR1 fusion mutants |