Project
PRJNA195909:zebrafish embryo and larva development
Navigation
Downloads
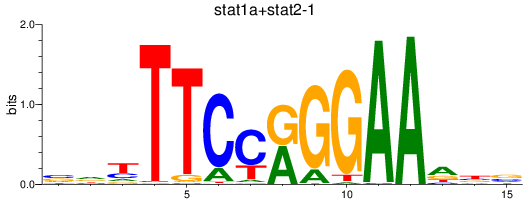
Results for stat1a+stat2-1_stat1b
Z-value: 1.47
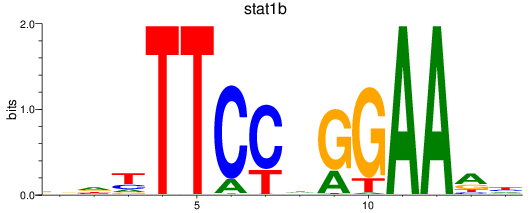
Motif logo
Transcription factors associated with stat1a+stat2-1_stat1b
| Gene Symbol | Gene ID | Gene Info |
|---|---|---|
|
stat1a
|
ENSDARG00000006266 | signal transducer and activator of transcription 1a |
|
stat2-1
|
ENSDARG00000031647 | signal transducer and activator of transcription 2 |
|
stat1b
|
ENSDARG00000076182 | signal transducer and activator of transcription 1b |
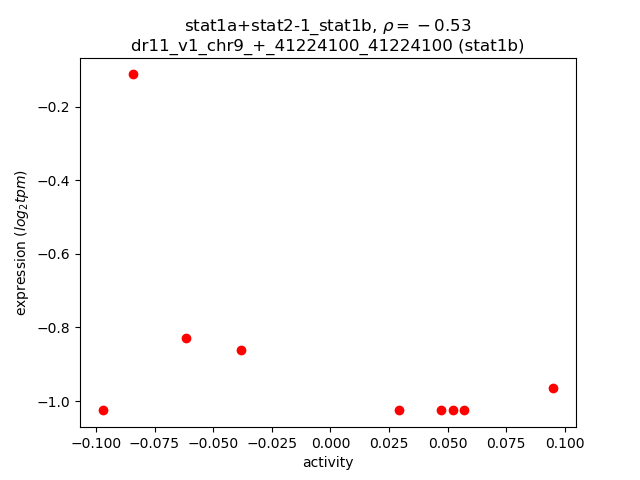
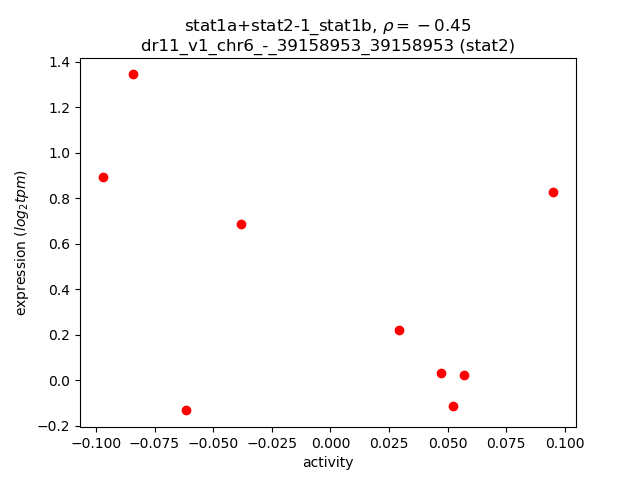
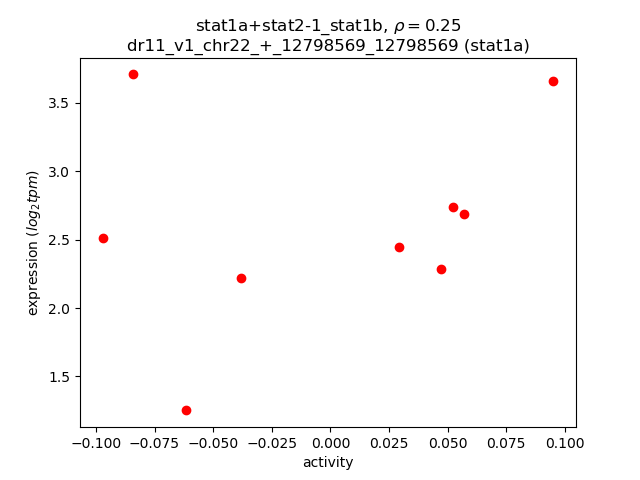
Activity-expression correlation:
| Gene | Promoter | Pearson corr. coef. | P-value | Plot |
|---|---|---|---|---|
| stat1b | dr11_v1_chr9_+_41224100_41224100 | -0.53 | 1.4e-01 | Click! |
| stat2 | dr11_v1_chr6_-_39158953_39158953 | -0.45 | 2.2e-01 | Click! |
| stat1a | dr11_v1_chr22_+_12798569_12798569 | 0.25 | 5.1e-01 | Click! |
Activity profile of stat1a+stat2-1_stat1b motif
Sorted Z-values of stat1a+stat2-1_stat1b motif
| Promoter | Log-likelihood | Transcript | Gene | Gene Info |
|---|---|---|---|---|
| chr3_-_61205711 | 5.06 |
ENSDART00000055062
|
pvalb1
|
parvalbumin 1 |
| chr12_-_3133483 | 3.48 |
ENSDART00000015092
|
col1a1b
|
collagen, type I, alpha 1b |
| chr1_+_19535144 | 3.06 |
ENSDART00000103089
|
si:dkey-245p14.4
|
si:dkey-245p14.4 |
| chr21_-_27338639 | 2.55 |
ENSDART00000130632
|
hif1al2
|
hypoxia-inducible factor 1, alpha subunit, like 2 |
| chr7_+_48319916 | 2.53 |
ENSDART00000052122
|
crabp1b
|
cellular retinoic acid binding protein 1b |
| chr19_+_48176745 | 2.38 |
ENSDART00000164963
|
prdm1b
|
PR domain containing 1b, with ZNF domain |
| chr14_+_6159162 | 2.31 |
ENSDART00000128638
|
bscl2l
|
Bernardinelli-Seip congenital lipodystrophy 2, like |
| chr6_+_6491013 | 2.24 |
ENSDART00000140827
|
bcl11ab
|
B cell CLL/lymphoma 11Ab |
| chr22_-_16180467 | 2.19 |
ENSDART00000171331
ENSDART00000185607 |
vcam1b
|
vascular cell adhesion molecule 1b |
| chr19_+_10846182 | 2.18 |
ENSDART00000168479
|
apoa4a
|
apolipoprotein A-IV a |
| chr19_+_17385561 | 2.00 |
ENSDART00000141397
ENSDART00000143913 ENSDART00000133626 |
rpl15
|
ribosomal protein L15 |
| chr18_-_14860435 | 1.96 |
ENSDART00000018502
|
mapk12a
|
mitogen-activated protein kinase 12a |
| chr11_-_17964525 | 1.96 |
ENSDART00000018948
|
cishb
|
cytokine inducible SH2-containing protein b |
| chr17_-_10838434 | 1.87 |
ENSDART00000064597
|
lgals3b
|
lectin, galactoside binding soluble 3b |
| chr17_-_6730247 | 1.79 |
ENSDART00000031091
|
vsnl1b
|
visinin-like 1b |
| chr9_-_6372535 | 1.71 |
ENSDART00000149189
|
ecrg4a
|
esophageal cancer related gene 4a |
| chr3_+_25154078 | 1.66 |
ENSDART00000156973
|
si:ch211-256m1.8
|
si:ch211-256m1.8 |
| chr19_-_2317558 | 1.62 |
ENSDART00000190300
|
sp8a
|
sp8 transcription factor a |
| chr7_+_26029672 | 1.60 |
ENSDART00000101126
|
alox12
|
arachidonate 12-lipoxygenase |
| chr19_-_26235219 | 1.58 |
ENSDART00000104008
|
dtnbp1b
|
dystrobrevin binding protein 1b |
| chr18_-_16801033 | 1.58 |
ENSDART00000100100
|
admb
|
adrenomedullin b |
| chr9_-_23922011 | 1.54 |
ENSDART00000145734
|
col6a3
|
collagen, type VI, alpha 3 |
| chr14_+_6159356 | 1.50 |
ENSDART00000157730
|
bscl2l
|
Bernardinelli-Seip congenital lipodystrophy 2, like |
| chr7_+_30787903 | 1.50 |
ENSDART00000174000
|
apba2b
|
amyloid beta (A4) precursor protein-binding, family A, member 2b |
| chr4_-_5291256 | 1.48 |
ENSDART00000150864
|
SNAP91 (1 of many)
|
si:ch211-214j24.9 |
| chr7_+_32369026 | 1.48 |
ENSDART00000169588
|
lgr4
|
leucine-rich repeat containing G protein-coupled receptor 4 |
| chr7_-_28696556 | 1.48 |
ENSDART00000148822
|
adgrg1
|
adhesion G protein-coupled receptor G1 |
| chr11_+_30321116 | 1.42 |
ENSDART00000187921
ENSDART00000127075 |
ugt1b1
|
UDP glucuronosyltransferase 1 family, polypeptide B1 |
| chr21_+_20771082 | 1.41 |
ENSDART00000079732
|
oxct1b
|
3-oxoacid CoA transferase 1b |
| chr21_+_39100289 | 1.41 |
ENSDART00000075958
|
slc13a2
|
solute carrier family 13 (sodium-dependent dicarboxylate transporter), member 2 |
| chr17_+_10318071 | 1.39 |
ENSDART00000161844
|
foxa1
|
forkhead box A1 |
| chr9_-_23922778 | 1.36 |
ENSDART00000135769
|
col6a3
|
collagen, type VI, alpha 3 |
| chr8_+_26522013 | 1.30 |
ENSDART00000046863
|
sema3bl
|
sema domain, immunoglobulin domain (Ig), short basic domain, secreted, (semaphorin) 3bl |
| chr20_+_37294112 | 1.30 |
ENSDART00000076293
ENSDART00000140450 |
cx23
|
connexin 23 |
| chr16_-_36099492 | 1.29 |
ENSDART00000180905
|
CU499336.2
|
|
| chr16_+_42772678 | 1.28 |
ENSDART00000155575
|
si:ch211-135n15.2
|
si:ch211-135n15.2 |
| chr16_-_45398408 | 1.27 |
ENSDART00000004052
|
rgl2
|
ral guanine nucleotide dissociation stimulator-like 2 |
| chr24_-_37877743 | 1.24 |
ENSDART00000105658
|
tmem204
|
transmembrane protein 204 |
| chr20_+_34933183 | 1.22 |
ENSDART00000062738
|
snap25a
|
synaptosomal-associated protein, 25a |
| chr5_-_25582721 | 1.20 |
ENSDART00000123986
|
anxa1a
|
annexin A1a |
| chr9_+_40825065 | 1.20 |
ENSDART00000137673
|
si:dkey-95p16.2
|
si:dkey-95p16.2 |
| chr8_+_32755688 | 1.18 |
ENSDART00000137897
|
hmcn2
|
hemicentin 2 |
| chr5_-_25583125 | 1.17 |
ENSDART00000031665
ENSDART00000145353 |
anxa1a
|
annexin A1a |
| chr18_+_49411417 | 1.16 |
ENSDART00000028944
|
LRFN3
|
zmp:0000001073 |
| chr12_-_4683325 | 1.15 |
ENSDART00000152771
|
si:ch211-255p10.3
|
si:ch211-255p10.3 |
| chr25_+_6186823 | 1.14 |
ENSDART00000153526
|
oaz2a
|
ornithine decarboxylase antizyme 2a |
| chr15_-_29598679 | 1.14 |
ENSDART00000155153
|
si:ch211-207n23.2
|
si:ch211-207n23.2 |
| chr6_+_21202639 | 1.13 |
ENSDART00000083126
|
cidec
|
cell death-inducing DFFA-like effector c |
| chr2_+_7295515 | 1.13 |
ENSDART00000152987
|
si:dkeyp-106c3.1
|
si:dkeyp-106c3.1 |
| chr10_+_13209580 | 1.10 |
ENSDART00000000887
ENSDART00000136932 |
rassf6
|
Ras association (RalGDS/AF-6) domain family 6 |
| chr3_-_46818001 | 1.09 |
ENSDART00000166505
|
elavl3
|
ELAV like neuron-specific RNA binding protein 3 |
| chr3_-_46817838 | 1.07 |
ENSDART00000028610
|
elavl3
|
ELAV like neuron-specific RNA binding protein 3 |
| chr10_-_4375190 | 1.07 |
ENSDART00000016102
|
CABZ01073795.1
|
|
| chr14_+_7932973 | 1.06 |
ENSDART00000109941
|
cxxc5b
|
CXXC finger protein 5b |
| chr19_+_43359075 | 1.04 |
ENSDART00000148287
ENSDART00000149856 ENSDART00000188236 ENSDART00000136695 ENSDART00000193859 |
yrk
|
Yes-related kinase |
| chr9_+_51265283 | 1.04 |
ENSDART00000137426
|
gcgb
|
glucagon b |
| chr7_-_33960170 | 1.02 |
ENSDART00000180766
|
skor1a
|
SKI family transcriptional corepressor 1a |
| chr1_-_46981134 | 1.02 |
ENSDART00000130607
|
pknox1.2
|
pbx/knotted 1 homeobox 1.2 |
| chr20_-_35841570 | 1.00 |
ENSDART00000037855
|
tnfrsf21
|
tumor necrosis factor receptor superfamily, member 21 |
| chr7_+_32369463 | 0.98 |
ENSDART00000180544
|
lgr4
|
leucine-rich repeat containing G protein-coupled receptor 4 |
| chr18_+_19975787 | 0.97 |
ENSDART00000138103
|
skor1b
|
SKI family transcriptional corepressor 1b |
| chr1_-_10071422 | 0.96 |
ENSDART00000135522
ENSDART00000033118 |
fga
|
fibrinogen alpha chain |
| chr14_+_24241241 | 0.96 |
ENSDART00000022377
|
nkx2.5
|
NK2 homeobox 5 |
| chr9_-_32813177 | 0.94 |
ENSDART00000012694
|
mxc
|
myxovirus (influenza virus) resistance C |
| chr16_-_36834505 | 0.94 |
ENSDART00000141275
ENSDART00000139588 ENSDART00000041993 |
pnp4b
|
purine nucleoside phosphorylase 4b |
| chr13_+_33117528 | 0.93 |
ENSDART00000085719
|
si:ch211-10a23.2
|
si:ch211-10a23.2 |
| chr9_-_18877597 | 0.93 |
ENSDART00000099446
|
kctd4
|
potassium channel tetramerization domain containing 4 |
| chr19_-_17385548 | 0.91 |
ENSDART00000162383
|
nkiras1
|
NFKB inhibitor interacting Ras-like 1 |
| chr16_-_26296477 | 0.90 |
ENSDART00000157553
|
erfl1
|
Ets2 repressor factor like 1 |
| chr6_-_8311044 | 0.90 |
ENSDART00000129674
|
slc44a2
|
solute carrier family 44 (choline transporter), member 2 |
| chr16_-_1502699 | 0.89 |
ENSDART00000187189
|
sim1a
|
single-minded family bHLH transcription factor 1a |
| chr13_+_29773153 | 0.88 |
ENSDART00000144443
ENSDART00000133796 ENSDART00000141310 ENSDART00000139782 |
pax2a
|
paired box 2a |
| chr6_-_35106425 | 0.88 |
ENSDART00000165139
|
nos1apa
|
nitric oxide synthase 1 (neuronal) adaptor protein a |
| chr13_+_36613359 | 0.87 |
ENSDART00000140598
|
si:ch211-67f24.7
|
si:ch211-67f24.7 |
| chr20_+_13969414 | 0.86 |
ENSDART00000049864
|
rd3
|
retinal degeneration 3 |
| chr20_-_25551676 | 0.83 |
ENSDART00000063081
|
cyp2ad3
|
cytochrome P450, family 2, subfamily AD, polypeptide 3 |
| chr22_-_13350240 | 0.81 |
ENSDART00000154095
ENSDART00000155118 |
si:ch211-227m13.1
|
si:ch211-227m13.1 |
| chr11_+_16040680 | 0.81 |
ENSDART00000157703
|
agtrap
|
angiotensin II receptor-associated protein |
| chr8_+_54055390 | 0.80 |
ENSDART00000102696
|
magi1a
|
membrane associated guanylate kinase, WW and PDZ domain containing 1a |
| chr6_+_43015916 | 0.80 |
ENSDART00000064888
|
tcta
|
T cell leukemia translocation altered |
| chr11_-_762721 | 0.80 |
ENSDART00000166465
|
syn2b
|
synapsin IIb |
| chr21_+_19834072 | 0.79 |
ENSDART00000147555
|
ccdc80l2
|
coiled-coil domain containing 80 like 2 |
| chr13_-_2112008 | 0.78 |
ENSDART00000110814
|
fam83b
|
family with sequence similarity 83, member B |
| chr4_+_18960914 | 0.78 |
ENSDART00000139730
|
impdh1b
|
IMP (inosine 5'-monophosphate) dehydrogenase 1b |
| chr4_+_76575585 | 0.76 |
ENSDART00000131588
|
ms4a17a.11
|
membrane-spanning 4-domains, subfamily A, member 17A.11 |
| chr15_+_23550890 | 0.75 |
ENSDART00000009796
ENSDART00000152720 |
MARK4
|
si:dkey-31m14.7 |
| chr12_-_3252263 | 0.75 |
ENSDART00000170632
|
gngt2b
|
guanine nucleotide binding protein (G protein), gamma transducing activity polypeptide 2b |
| chr16_-_41503925 | 0.74 |
ENSDART00000029492
|
cmtm7
|
CKLF-like MARVEL transmembrane domain containing 7 |
| chr21_-_30545121 | 0.73 |
ENSDART00000019199
|
rab39ba
|
RAB39B, member RAS oncogene family a |
| chr21_+_35215810 | 0.73 |
ENSDART00000135256
|
ubtd2
|
ubiquitin domain containing 2 |
| chr14_+_11457500 | 0.71 |
ENSDART00000169202
|
si:ch211-153b23.5
|
si:ch211-153b23.5 |
| chr13_+_13681681 | 0.71 |
ENSDART00000057825
|
cfd
|
complement factor D (adipsin) |
| chr14_-_2202652 | 0.70 |
ENSDART00000171316
|
si:dkey-262j3.7
|
si:dkey-262j3.7 |
| chr24_-_32408404 | 0.70 |
ENSDART00000144157
|
si:ch211-56a11.2
|
si:ch211-56a11.2 |
| chr9_+_23665777 | 0.70 |
ENSDART00000060905
|
gypc
|
glycophorin C (Gerbich blood group) |
| chr21_+_45626136 | 0.69 |
ENSDART00000158742
|
irf1b
|
interferon regulatory factor 1b |
| chr5_+_29160324 | 0.68 |
ENSDART00000137324
|
dpp7
|
dipeptidyl-peptidase 7 |
| chr22_+_5851122 | 0.68 |
ENSDART00000082044
|
zmp:0000001161
|
zmp:0000001161 |
| chr4_-_12323228 | 0.68 |
ENSDART00000081089
|
il17ra1a
|
interleukin 17 receptor A1a |
| chr8_-_34065573 | 0.67 |
ENSDART00000186946
|
pbx3b
|
pre-B-cell leukemia homeobox 3b |
| chr1_+_37391716 | 0.67 |
ENSDART00000191986
|
sparcl1
|
SPARC-like 1 |
| chr1_+_47446032 | 0.67 |
ENSDART00000126904
ENSDART00000007262 |
gja8b
|
gap junction protein alpha 8 paralog b |
| chr4_+_19534833 | 0.67 |
ENSDART00000140028
|
lrrc4.1
|
leucine rich repeat containing 4.1 |
| chr11_+_16040517 | 0.66 |
ENSDART00000111284
|
agtrap
|
angiotensin II receptor-associated protein |
| chr1_-_21599219 | 0.66 |
ENSDART00000148327
|
adamtsl7
|
ADAMTS-like 7 |
| chr19_-_42556086 | 0.66 |
ENSDART00000051731
|
si:dkey-267n13.1
|
si:dkey-267n13.1 |
| chr16_+_32059785 | 0.63 |
ENSDART00000134459
|
si:dkey-40m6.8
|
si:dkey-40m6.8 |
| chr16_+_38394371 | 0.63 |
ENSDART00000137954
|
cd83
|
CD83 molecule |
| chr19_-_35596207 | 0.63 |
ENSDART00000136811
|
col8a2
|
collagen, type VIII, alpha 2 |
| chr16_-_29458806 | 0.62 |
ENSDART00000047931
|
lingo4b
|
leucine rich repeat and Ig domain containing 4b |
| chr19_+_10845953 | 0.61 |
ENSDART00000157589
|
apoa4a
|
apolipoprotein A-IV a |
| chr21_+_26720803 | 0.61 |
ENSDART00000053797
|
slc3a2b
|
solute carrier family 3 (amino acid transporter heavy chain), member 2b |
| chr13_+_1535511 | 0.60 |
ENSDART00000159454
|
CABZ01044277.1
|
|
| chr21_-_25565392 | 0.60 |
ENSDART00000144917
ENSDART00000180102 |
si:dkey-17e16.10
|
si:dkey-17e16.10 |
| chr16_+_54513267 | 0.59 |
ENSDART00000161923
|
CABZ01088508.1
|
|
| chr2_+_4402765 | 0.59 |
ENSDART00000159525
|
bambib
|
BMP and activin membrane-bound inhibitor homolog (Xenopus laevis) b |
| chr11_+_14286160 | 0.58 |
ENSDART00000166236
|
si:ch211-262i1.3
|
si:ch211-262i1.3 |
| chr24_+_9590188 | 0.58 |
ENSDART00000137092
|
si:dkey-96n2.1
|
si:dkey-96n2.1 |
| chr23_+_44611864 | 0.57 |
ENSDART00000145905
ENSDART00000132361 |
eno3
|
enolase 3, (beta, muscle) |
| chr16_+_5774977 | 0.57 |
ENSDART00000134202
|
ccka
|
cholecystokinin a |
| chr21_+_8341774 | 0.56 |
ENSDART00000129749
ENSDART00000055325 ENSDART00000133804 |
psmb7
|
proteasome subunit beta 7 |
| chr7_+_58686860 | 0.56 |
ENSDART00000052332
|
penkb
|
proenkephalin b |
| chr4_+_76637548 | 0.56 |
ENSDART00000133799
|
ms4a17a.9
|
membrane-spanning 4-domains, subfamily A, member 17A.9 |
| chr24_+_16149251 | 0.56 |
ENSDART00000188289
|
si:dkey-118j18.2
|
si:dkey-118j18.2 |
| chr23_-_39636195 | 0.55 |
ENSDART00000144439
|
vwa1
|
von Willebrand factor A domain containing 1 |
| chr24_-_37877554 | 0.55 |
ENSDART00000132219
|
tmem204
|
transmembrane protein 204 |
| chr4_+_76735113 | 0.55 |
ENSDART00000075602
|
ms4a17a.6
|
membrane-spanning 4-domains, subfamily A, member 17A.6 |
| chr10_+_22775253 | 0.55 |
ENSDART00000190141
|
tmem88a
|
transmembrane protein 88 a |
| chr16_+_40560622 | 0.54 |
ENSDART00000038294
|
tp53inp1
|
tumor protein p53 inducible nuclear protein 1 |
| chr15_+_16521785 | 0.54 |
ENSDART00000062191
|
galnt17
|
polypeptide N-acetylgalactosaminyltransferase 17 |
| chr24_+_16149514 | 0.53 |
ENSDART00000152087
|
si:dkey-118j18.2
|
si:dkey-118j18.2 |
| chr16_+_28932038 | 0.53 |
ENSDART00000149480
|
npr1b
|
natriuretic peptide receptor 1b |
| chr13_+_52061034 | 0.53 |
ENSDART00000170383
|
CABZ01089777.1
|
|
| chr16_-_12809873 | 0.53 |
ENSDART00000146997
ENSDART00000178291 ENSDART00000007842 |
isoc2
|
isochorismatase domain containing 2 |
| chr5_+_29820266 | 0.53 |
ENSDART00000146331
ENSDART00000098315 |
f11r.2
|
F11 receptor, tandem duplicate 2 |
| chr7_-_27696958 | 0.52 |
ENSDART00000173470
|
calca
|
calcitonin/calcitonin-related polypeptide, alpha |
| chr14_+_8328645 | 0.52 |
ENSDART00000127494
|
nrg2b
|
neuregulin 2b |
| chr8_+_48609521 | 0.51 |
ENSDART00000060765
|
nppb
|
natriuretic peptide B |
| chr8_+_21146262 | 0.51 |
ENSDART00000045684
|
porcn
|
porcupine O-acyltransferase |
| chr2_+_26288301 | 0.51 |
ENSDART00000017668
|
ptbp1a
|
polypyrimidine tract binding protein 1a |
| chr5_+_36654817 | 0.51 |
ENSDART00000131339
|
capns1a
|
calpain, small subunit 1 a |
| chr3_+_19621034 | 0.51 |
ENSDART00000025358
|
itgb3a
|
integrin beta 3a |
| chr20_-_49657134 | 0.50 |
ENSDART00000151248
|
col12a1b
|
collagen, type XII, alpha 1b |
| chr23_-_31763753 | 0.50 |
ENSDART00000053399
|
aldh8a1
|
aldehyde dehydrogenase 8 family, member A1 |
| chr5_+_23118470 | 0.50 |
ENSDART00000149893
|
nexmifa
|
neurite extension and migration factor a |
| chr20_+_52458765 | 0.49 |
ENSDART00000057980
|
tsta3
|
tissue specific transplantation antigen P35B |
| chr7_-_5191797 | 0.49 |
ENSDART00000172955
|
si:ch73-223f5.1
|
si:ch73-223f5.1 |
| chr22_+_20427170 | 0.49 |
ENSDART00000136744
|
foxq2
|
forkhead box Q2 |
| chr2_+_38261748 | 0.48 |
ENSDART00000076478
|
dhrs1
|
dehydrogenase/reductase (SDR family) member 1 |
| chr24_-_21674950 | 0.48 |
ENSDART00000123216
ENSDART00000046211 |
lnx2a
|
ligand of numb-protein X 2a |
| chr13_-_49819027 | 0.48 |
ENSDART00000067824
|
b3galnt2
|
beta-1,3-N-acetylgalactosaminyltransferase 2 |
| chr19_+_8973042 | 0.47 |
ENSDART00000039597
|
crabp2b
|
cellular retinoic acid binding protein 2, b |
| chr14_-_32744464 | 0.47 |
ENSDART00000075617
|
sox3
|
SRY (sex determining region Y)-box 3 |
| chr16_-_45080812 | 0.47 |
ENSDART00000157377
|
si:rp71-77l1.2
|
si:rp71-77l1.2 |
| chr10_-_27223827 | 0.47 |
ENSDART00000185138
|
auts2a
|
autism susceptibility candidate 2a |
| chr7_+_30867008 | 0.47 |
ENSDART00000193106
|
apba2b
|
amyloid beta (A4) precursor protein-binding, family A, member 2b |
| chr14_-_21123551 | 0.46 |
ENSDART00000171679
ENSDART00000165882 |
si:dkey-74k8.4
|
si:dkey-74k8.4 |
| chr6_+_18321627 | 0.46 |
ENSDART00000183107
ENSDART00000189715 |
card14
|
caspase recruitment domain family, member 14 |
| chr18_+_17660402 | 0.45 |
ENSDART00000143475
|
cpne2
|
copine II |
| chr8_+_38417461 | 0.45 |
ENSDART00000132718
|
nkx6.3
|
NK6 homeobox 3 |
| chr23_+_20408227 | 0.45 |
ENSDART00000134727
|
si:rp71-17i16.4
|
si:rp71-17i16.4 |
| chr5_+_27434601 | 0.45 |
ENSDART00000064701
|
loxl2b
|
lysyl oxidase-like 2b |
| chr15_-_14486534 | 0.44 |
ENSDART00000179368
|
numbl
|
numb homolog (Drosophila)-like |
| chr15_-_3282220 | 0.44 |
ENSDART00000092942
|
slc25a15a
|
solute carrier family 25 (mitochondrial carrier; ornithine transporter) member 15a |
| chr7_-_71837213 | 0.44 |
ENSDART00000168645
ENSDART00000160512 |
cacnb2a
|
calcium channel, voltage-dependent, beta 2a |
| chr19_-_42566527 | 0.43 |
ENSDART00000147818
ENSDART00000142135 |
si:dkey-228a15.1
|
si:dkey-228a15.1 |
| chr6_-_40286633 | 0.43 |
ENSDART00000033844
|
col7a1
|
collagen, type VII, alpha 1 |
| chr21_-_20932603 | 0.43 |
ENSDART00000138155
ENSDART00000079709 |
c6
|
complement component 6 |
| chr2_-_55853943 | 0.43 |
ENSDART00000122576
|
rx2
|
retinal homeobox gene 2 |
| chr9_+_52411530 | 0.42 |
ENSDART00000163684
|
nme8
|
NME/NM23 family member 8 |
| chr15_+_27387555 | 0.42 |
ENSDART00000018603
|
tbx4
|
T-box 4 |
| chr19_+_712127 | 0.42 |
ENSDART00000093281
ENSDART00000180002 ENSDART00000146050 |
fhod3a
|
formin homology 2 domain containing 3a |
| chr1_-_53407087 | 0.42 |
ENSDART00000157910
|
elmod2
|
ELMO/CED-12 domain containing 2 |
| chr23_-_8373676 | 0.41 |
ENSDART00000105135
ENSDART00000158531 |
oprl1
|
opiate receptor-like 1 |
| chr11_-_2700397 | 0.41 |
ENSDART00000082511
|
si:ch211-160o17.6
|
si:ch211-160o17.6 |
| chr8_-_38159805 | 0.41 |
ENSDART00000112331
ENSDART00000180006 |
adgra2
|
adhesion G protein-coupled receptor A2 |
| chr17_-_7861219 | 0.41 |
ENSDART00000148604
|
syne1b
|
spectrin repeat containing, nuclear envelope 1b |
| chr6_-_3998199 | 0.40 |
ENSDART00000059212
|
unc50
|
unc-50 homolog (C. elegans) |
| chr19_-_5699703 | 0.40 |
ENSDART00000082050
|
zgc:174904
|
zgc:174904 |
| chr7_-_28658143 | 0.40 |
ENSDART00000173556
|
adgrg1
|
adhesion G protein-coupled receptor G1 |
| chr4_+_57580303 | 0.40 |
ENSDART00000166492
ENSDART00000103025 ENSDART00000170786 |
il17ra1b
il17ra2
|
interleukin 17 receptor A1b interleukin 17 receptor A2 |
| chr13_+_24750078 | 0.40 |
ENSDART00000021053
|
col17a1b
|
collagen, type XVII, alpha 1b |
| chr4_+_49322310 | 0.39 |
ENSDART00000184154
ENSDART00000167162 |
BX942819.1
|
|
| chr22_+_24446964 | 0.39 |
ENSDART00000166812
|
p3h2
|
prolyl 3-hydroxylase 2 |
| chr21_-_8085635 | 0.39 |
ENSDART00000082790
|
si:dkey-163m14.2
|
si:dkey-163m14.2 |
| chr7_-_52842605 | 0.39 |
ENSDART00000083002
|
map1aa
|
microtubule-associated protein 1Aa |
| chr10_-_25823258 | 0.38 |
ENSDART00000064327
|
ftr54
|
finTRIM family, member 54 |
| chr10_+_21722892 | 0.38 |
ENSDART00000162855
|
pcdh1g13
|
protocadherin 1 gamma 13 |
| chr8_-_33381430 | 0.38 |
ENSDART00000190019
|
lmx1bb
|
LIM homeobox transcription factor 1, beta b |
| chr18_-_44888375 | 0.38 |
ENSDART00000160506
|
si:ch211-71n6.4
|
si:ch211-71n6.4 |
| chr15_-_29598444 | 0.38 |
ENSDART00000154847
|
si:ch211-207n23.2
|
si:ch211-207n23.2 |
| chr24_-_22702017 | 0.38 |
ENSDART00000179403
|
ctnnd2a
|
catenin (cadherin-associated protein), delta 2a |
| chr24_+_19591893 | 0.37 |
ENSDART00000152026
|
slco5a1a
|
solute carrier organic anion transporter family member 5A1a |
| chr8_-_33381913 | 0.37 |
ENSDART00000076420
|
lmx1bb
|
LIM homeobox transcription factor 1, beta b |
| chr19_+_5418006 | 0.37 |
ENSDART00000132874
|
eif1b
|
eukaryotic translation initiation factor 1B |
| chr24_-_18477672 | 0.37 |
ENSDART00000126928
ENSDART00000158393 |
si:dkey-73n8.3
|
si:dkey-73n8.3 |
| chr19_+_43780970 | 0.37 |
ENSDART00000063870
|
rpl11
|
ribosomal protein L11 |
| chr10_-_11385155 | 0.36 |
ENSDART00000064214
|
plac8.1
|
placenta-specific 8, tandem duplicate 1 |
| chr9_-_5045378 | 0.36 |
ENSDART00000149268
|
nr4a2a
|
nuclear receptor subfamily 4, group A, member 2a |
| chr17_-_2834764 | 0.35 |
ENSDART00000024027
|
bdkrb1
|
bradykinin receptor B1 |
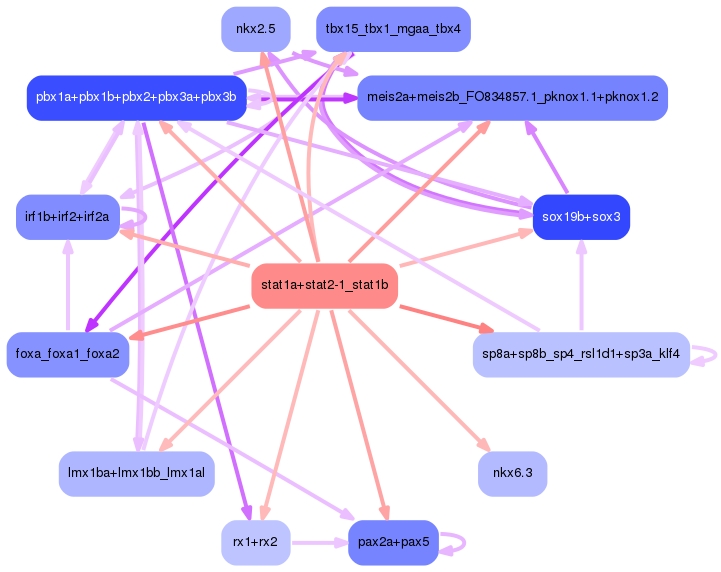
Network of associatons between targets according to the STRING database.

First level regulatory network of stat1a+stat2-1_stat1b
Gene Ontology Analysis
Gene overrepresentation in biological process category:
| Log-likelihood per target | Total log-likelihood | Term | Description |
|---|---|---|---|
| 0.6 | 1.7 | GO:0070314 | G1 to G0 transition(GO:0070314) |
| 0.6 | 2.2 | GO:2000171 | negative regulation of dendrite development(GO:2000171) |
| 0.5 | 3.8 | GO:0034389 | lipid particle organization(GO:0034389) |
| 0.5 | 2.5 | GO:0016115 | diterpenoid catabolic process(GO:0016103) terpenoid catabolic process(GO:0016115) retinoic acid catabolic process(GO:0034653) |
| 0.4 | 2.5 | GO:0021888 | hypothalamus gonadotrophin-releasing hormone neuron differentiation(GO:0021886) hypothalamus gonadotrophin-releasing hormone neuron development(GO:0021888) |
| 0.4 | 2.4 | GO:0033028 | neutrophil apoptotic process(GO:0001781) regulation of T-helper 1 type immune response(GO:0002825) positive regulation of T-helper 1 type immune response(GO:0002827) negative regulation of type 2 immune response(GO:0002829) inflammatory cell apoptotic process(GO:0006925) regulation of prostaglandin biosynthetic process(GO:0031392) positive regulation of prostaglandin biosynthetic process(GO:0031394) regulation of phospholipase A2 activity(GO:0032429) interleukin-2 production(GO:0032623) regulation of interleukin-2 production(GO:0032663) positive regulation of interleukin-2 production(GO:0032743) myeloid cell apoptotic process(GO:0033028) regulation of neutrophil apoptotic process(GO:0033029) positive regulation of neutrophil apoptotic process(GO:0033031) regulation of myeloid cell apoptotic process(GO:0033032) positive regulation of myeloid cell apoptotic process(GO:0033034) T-helper 1 type immune response(GO:0042088) positive regulation of CD4-positive, alpha-beta T cell differentiation(GO:0043372) T-helper 1 cell differentiation(GO:0045063) positive regulation of T-helper cell differentiation(GO:0045624) regulation of T-helper 1 cell differentiation(GO:0045625) positive regulation of T-helper 1 cell differentiation(GO:0045627) regulation of T-helper 2 cell differentiation(GO:0045628) negative regulation of T-helper 2 cell differentiation(GO:0045629) positive regulation of fatty acid biosynthetic process(GO:0045723) positive regulation of alpha-beta T cell differentiation(GO:0046638) neutrophil clearance(GO:0097350) negative regulation of phospholipase A2 activity(GO:1900138) positive regulation of CD4-positive, alpha-beta T cell activation(GO:2000516) regulation of unsaturated fatty acid biosynthetic process(GO:2001279) positive regulation of unsaturated fatty acid biosynthetic process(GO:2001280) |
| 0.4 | 1.6 | GO:0060155 | secretory granule organization(GO:0033363) platelet dense granule organization(GO:0060155) |
| 0.4 | 1.1 | GO:0072020 | proximal straight tubule development(GO:0072020) |
| 0.4 | 1.9 | GO:0048245 | eosinophil chemotaxis(GO:0048245) eosinophil migration(GO:0072677) |
| 0.3 | 1.0 | GO:0031645 | negative regulation of myelination(GO:0031642) negative regulation of neurological system process(GO:0031645) |
| 0.3 | 1.0 | GO:1903779 | regulation of cardiac conduction(GO:1903779) |
| 0.3 | 1.9 | GO:0070445 | regulation of oligodendrocyte progenitor proliferation(GO:0070445) |
| 0.3 | 1.4 | GO:0046952 | ketone body catabolic process(GO:0046952) |
| 0.2 | 0.7 | GO:0006957 | complement activation, alternative pathway(GO:0006957) |
| 0.2 | 0.9 | GO:0015871 | choline transport(GO:0015871) |
| 0.2 | 0.6 | GO:0002468 | dendritic cell antigen processing and presentation(GO:0002468) |
| 0.2 | 0.6 | GO:0042245 | RNA repair(GO:0042245) |
| 0.2 | 0.6 | GO:1905208 | negative regulation of striated muscle cell differentiation(GO:0051154) negative regulation of cardiac muscle tissue development(GO:0055026) cardiac muscle cell fate commitment(GO:0060923) canonical Wnt signaling pathway involved in cardiac muscle cell fate commitment(GO:0061317) regulation of canonical Wnt signaling pathway involved in cardiac muscle cell fate commitment(GO:1901295) negative regulation of canonical Wnt signaling pathway involved in cardiac muscle cell fate commitment(GO:1901296) negative regulation of cardiocyte differentiation(GO:1905208) negative regulation of cardiac muscle cell differentiation(GO:2000726) |
| 0.2 | 0.5 | GO:1905072 | cardiac jelly development(GO:1905072) |
| 0.2 | 0.5 | GO:0061355 | Wnt protein secretion(GO:0061355) |
| 0.2 | 1.2 | GO:0090497 | mesenchymal cell migration(GO:0090497) |
| 0.2 | 0.5 | GO:0097053 | L-kynurenine metabolic process(GO:0097052) L-kynurenine catabolic process(GO:0097053) |
| 0.2 | 1.2 | GO:0072098 | cerebellum formation(GO:0021588) anterior/posterior pattern specification involved in pronephros development(GO:0034672) anterior/posterior pattern specification involved in kidney development(GO:0072098) |
| 0.1 | 0.4 | GO:1990575 | mitochondrial ornithine transport(GO:0000066) mitochondrial L-ornithine transmembrane transport(GO:1990575) |
| 0.1 | 1.7 | GO:0016540 | protein autoprocessing(GO:0016540) |
| 0.1 | 0.4 | GO:0022009 | central nervous system vasculogenesis(GO:0022009) |
| 0.1 | 1.6 | GO:0043651 | lipoxygenase pathway(GO:0019372) linoleic acid metabolic process(GO:0043651) hepoxilin metabolic process(GO:0051121) hepoxilin biosynthetic process(GO:0051122) |
| 0.1 | 0.5 | GO:0060467 | negative regulation of fertilization(GO:0060467) prevention of polyspermy(GO:0060468) cortical granule exocytosis(GO:0060471) |
| 0.1 | 1.4 | GO:0048319 | axial mesoderm morphogenesis(GO:0048319) |
| 0.1 | 0.5 | GO:2000048 | negative regulation of cell-substrate adhesion(GO:0010812) negative regulation of cell-cell adhesion mediated by cadherin(GO:2000048) |
| 0.1 | 0.4 | GO:1902455 | negative regulation of stem cell population maintenance(GO:1902455) |
| 0.1 | 2.5 | GO:0071456 | cellular response to hypoxia(GO:0071456) |
| 0.1 | 0.3 | GO:0034375 | high-density lipoprotein particle remodeling(GO:0034375) |
| 0.1 | 3.1 | GO:0006893 | Golgi to plasma membrane transport(GO:0006893) |
| 0.1 | 1.0 | GO:0043330 | response to exogenous dsRNA(GO:0043330) |
| 0.1 | 0.4 | GO:0030326 | embryonic limb morphogenesis(GO:0030326) |
| 0.1 | 0.8 | GO:0046037 | GMP biosynthetic process(GO:0006177) GMP metabolic process(GO:0046037) |
| 0.1 | 0.4 | GO:0032963 | collagen metabolic process(GO:0032963) multicellular organismal macromolecule metabolic process(GO:0044259) |
| 0.1 | 0.2 | GO:0007635 | chemosensory behavior(GO:0007635) detection of chemical stimulus involved in sensory perception of pain(GO:0050968) |
| 0.1 | 0.6 | GO:0032889 | regulation of vacuole fusion, non-autophagic(GO:0032889) |
| 0.1 | 0.8 | GO:0071678 | olfactory bulb axon guidance(GO:0071678) |
| 0.1 | 0.7 | GO:0050688 | regulation of defense response to virus(GO:0050688) |
| 0.1 | 1.0 | GO:0072378 | blood coagulation, fibrin clot formation(GO:0072378) |
| 0.1 | 0.8 | GO:0021592 | fourth ventricle development(GO:0021592) |
| 0.1 | 0.6 | GO:0060142 | regulation of syncytium formation by plasma membrane fusion(GO:0060142) |
| 0.1 | 0.4 | GO:0030194 | positive regulation of blood coagulation(GO:0030194) positive regulation of coagulation(GO:0050820) positive regulation of hemostasis(GO:1900048) |
| 0.1 | 1.0 | GO:0048246 | macrophage chemotaxis(GO:0048246) |
| 0.1 | 1.1 | GO:0006825 | copper ion transport(GO:0006825) |
| 0.1 | 0.3 | GO:0007175 | negative regulation of epidermal growth factor-activated receptor activity(GO:0007175) |
| 0.0 | 0.2 | GO:0060092 | regulation of synaptic transmission, glycinergic(GO:0060092) |
| 0.0 | 1.1 | GO:0006595 | polyamine metabolic process(GO:0006595) |
| 0.0 | 0.2 | GO:0032689 | negative regulation of interferon-gamma production(GO:0032689) CD4-positive, alpha-beta T cell proliferation(GO:0035739) regulation of CD4-positive, alpha-beta T cell proliferation(GO:2000561) negative regulation of CD4-positive, alpha-beta T cell proliferation(GO:2000562) |
| 0.0 | 0.2 | GO:0045938 | positive regulation of circadian sleep/wake cycle, sleep(GO:0045938) |
| 0.0 | 0.3 | GO:0006172 | ADP biosynthetic process(GO:0006172) purine nucleoside diphosphate biosynthetic process(GO:0009136) purine ribonucleoside diphosphate biosynthetic process(GO:0009180) |
| 0.0 | 0.8 | GO:0021884 | forebrain neuron development(GO:0021884) |
| 0.0 | 0.8 | GO:0030316 | osteoclast differentiation(GO:0030316) |
| 0.0 | 0.4 | GO:0019233 | sensory perception of pain(GO:0019233) |
| 0.0 | 1.2 | GO:0016082 | synaptic vesicle priming(GO:0016082) |
| 0.0 | 0.2 | GO:0005513 | detection of calcium ion(GO:0005513) |
| 0.0 | 0.2 | GO:0018171 | peptidyl-cysteine oxidation(GO:0018171) |
| 0.0 | 0.5 | GO:0048385 | regulation of retinoic acid receptor signaling pathway(GO:0048385) |
| 0.0 | 2.0 | GO:0030514 | negative regulation of BMP signaling pathway(GO:0030514) |
| 0.0 | 0.2 | GO:0045039 | protein import into mitochondrial inner membrane(GO:0045039) |
| 0.0 | 0.1 | GO:2000008 | regulation of protein localization to cell surface(GO:2000008) negative regulation of protein localization to cell surface(GO:2000009) |
| 0.0 | 0.5 | GO:0090559 | regulation of membrane permeability(GO:0090559) |
| 0.0 | 0.6 | GO:1903845 | negative regulation of transforming growth factor beta receptor signaling pathway(GO:0030512) negative regulation of cellular response to transforming growth factor beta stimulus(GO:1903845) |
| 0.0 | 0.2 | GO:0046600 | negative regulation of centriole replication(GO:0046600) |
| 0.0 | 0.2 | GO:0070527 | platelet aggregation(GO:0070527) |
| 0.0 | 1.8 | GO:0001946 | lymphangiogenesis(GO:0001946) |
| 0.0 | 1.0 | GO:0048384 | retinoic acid receptor signaling pathway(GO:0048384) |
| 0.0 | 2.1 | GO:0008045 | motor neuron axon guidance(GO:0008045) |
| 0.0 | 0.1 | GO:0046415 | urate catabolic process(GO:0019628) urate metabolic process(GO:0046415) |
| 0.0 | 0.3 | GO:0006842 | tricarboxylic acid transport(GO:0006842) citrate transport(GO:0015746) |
| 0.0 | 0.3 | GO:0018057 | peptidyl-lysine oxidation(GO:0018057) |
| 0.0 | 0.5 | GO:0048679 | regulation of axon regeneration(GO:0048679) regulation of neuron projection regeneration(GO:0070570) |
| 0.0 | 0.2 | GO:0055062 | phosphate ion homeostasis(GO:0055062) trivalent inorganic anion homeostasis(GO:0072506) |
| 0.0 | 0.7 | GO:0032482 | Rab protein signal transduction(GO:0032482) |
| 0.0 | 0.6 | GO:0040023 | nuclear migration(GO:0007097) establishment of nucleus localization(GO:0040023) |
| 0.0 | 1.1 | GO:0042738 | drug metabolic process(GO:0017144) drug catabolic process(GO:0042737) exogenous drug catabolic process(GO:0042738) |
| 0.0 | 0.7 | GO:0010921 | regulation of phosphatase activity(GO:0010921) |
| 0.0 | 0.4 | GO:0051639 | actin filament network formation(GO:0051639) |
| 0.0 | 0.5 | GO:0043049 | otic placode formation(GO:0043049) |
| 0.0 | 1.5 | GO:0008217 | regulation of blood pressure(GO:0008217) |
| 0.0 | 0.4 | GO:0043252 | sodium-independent organic anion transport(GO:0043252) |
| 0.0 | 0.8 | GO:0007173 | epidermal growth factor receptor signaling pathway(GO:0007173) |
| 0.0 | 1.1 | GO:1902668 | negative regulation of axon extension involved in axon guidance(GO:0048843) negative regulation of axon guidance(GO:1902668) |
| 0.0 | 0.1 | GO:0034058 | endosomal vesicle fusion(GO:0034058) |
| 0.0 | 0.6 | GO:0010499 | proteasomal ubiquitin-independent protein catabolic process(GO:0010499) |
| 0.0 | 0.5 | GO:0055064 | chloride ion homeostasis(GO:0055064) |
| 0.0 | 0.4 | GO:0045746 | negative regulation of Notch signaling pathway(GO:0045746) |
| 0.0 | 0.4 | GO:0031114 | regulation of microtubule depolymerization(GO:0031114) |
| 0.0 | 0.1 | GO:1902262 | apoptotic process involved in patterning of blood vessels(GO:1902262) |
| 0.0 | 0.2 | GO:0090110 | cargo loading into COPII-coated vesicle(GO:0090110) |
| 0.0 | 0.3 | GO:0000027 | ribosomal large subunit assembly(GO:0000027) |
| 0.0 | 0.5 | GO:0006493 | protein O-linked glycosylation(GO:0006493) |
| 0.0 | 0.4 | GO:0060997 | dendritic spine morphogenesis(GO:0060997) |
| 0.0 | 0.0 | GO:0045649 | regulation of macrophage differentiation(GO:0045649) |
| 0.0 | 0.4 | GO:0060219 | camera-type eye photoreceptor cell differentiation(GO:0060219) |
| 0.0 | 0.1 | GO:0050936 | xanthophore differentiation(GO:0050936) |
| 0.0 | 0.4 | GO:0007586 | digestion(GO:0007586) |
| 0.0 | 0.6 | GO:0048821 | erythrocyte development(GO:0048821) |
| 0.0 | 0.3 | GO:0048168 | regulation of neuronal synaptic plasticity(GO:0048168) |
| 0.0 | 0.4 | GO:1901385 | regulation of voltage-gated calcium channel activity(GO:1901385) |
| 0.0 | 0.3 | GO:0071222 | cellular response to molecule of bacterial origin(GO:0071219) cellular response to lipopolysaccharide(GO:0071222) |
| 0.0 | 0.1 | GO:1903146 | regulation of mitophagy(GO:1903146) |
| 0.0 | 3.0 | GO:0030198 | extracellular matrix organization(GO:0030198) extracellular structure organization(GO:0043062) |
| 0.0 | 0.5 | GO:0006937 | regulation of muscle contraction(GO:0006937) |
Gene overrepresentation in cellular component category:
| Log-likelihood per target | Total log-likelihood | Term | Description |
|---|---|---|---|
| 0.3 | 1.0 | GO:0005577 | fibrinogen complex(GO:0005577) |
| 0.2 | 1.9 | GO:0001772 | immunological synapse(GO:0001772) |
| 0.2 | 1.2 | GO:0070032 | synaptobrevin 2-SNAP-25-syntaxin-1a-complexin I complex(GO:0070032) |
| 0.2 | 2.4 | GO:0016328 | lateral plasma membrane(GO:0016328) |
| 0.1 | 1.6 | GO:0031083 | BLOC-1 complex(GO:0031083) |
| 0.1 | 3.1 | GO:0000145 | exocyst(GO:0000145) |
| 0.1 | 0.4 | GO:1990909 | Wnt signalosome(GO:1990909) |
| 0.1 | 7.3 | GO:0005581 | collagen trimer(GO:0005581) |
| 0.1 | 0.6 | GO:0000015 | phosphopyruvate hydratase complex(GO:0000015) |
| 0.1 | 0.2 | GO:0042719 | mitochondrial intermembrane space protein transporter complex(GO:0042719) |
| 0.1 | 0.2 | GO:0031233 | intrinsic component of external side of plasma membrane(GO:0031233) anchored component of external side of plasma membrane(GO:0031362) |
| 0.1 | 0.7 | GO:0005922 | connexon complex(GO:0005922) |
| 0.0 | 0.9 | GO:0098844 | postsynaptic endocytic zone membrane(GO:0098844) |
| 0.0 | 0.7 | GO:0031680 | G-protein beta/gamma-subunit complex(GO:0031680) |
| 0.0 | 2.4 | GO:0022625 | cytosolic large ribosomal subunit(GO:0022625) |
| 0.0 | 0.2 | GO:0043083 | synaptic cleft(GO:0043083) |
| 0.0 | 1.1 | GO:0031970 | mitochondrial intermembrane space(GO:0005758) organelle envelope lumen(GO:0031970) |
| 0.0 | 0.3 | GO:0042583 | chromaffin granule(GO:0042583) |
| 0.0 | 4.0 | GO:0030176 | integral component of endoplasmic reticulum membrane(GO:0030176) |
| 0.0 | 0.1 | GO:0098753 | intrinsic component of the cytoplasmic side of the plasma membrane(GO:0031235) anchored component of the cytoplasmic side of the plasma membrane(GO:0098753) |
| 0.0 | 0.4 | GO:0005640 | nuclear outer membrane(GO:0005640) |
| 0.0 | 0.1 | GO:0030897 | HOPS complex(GO:0030897) |
| 0.0 | 0.6 | GO:0005839 | proteasome core complex(GO:0005839) |
| 0.0 | 0.5 | GO:0019814 | immunoglobulin complex(GO:0019814) |
| 0.0 | 0.6 | GO:0043679 | axon terminus(GO:0043679) neuron projection terminus(GO:0044306) |
| 0.0 | 0.4 | GO:0016282 | eukaryotic 43S preinitiation complex(GO:0016282) |
| 0.0 | 2.8 | GO:0008021 | synaptic vesicle(GO:0008021) |
| 0.0 | 0.9 | GO:0036379 | striated muscle thin filament(GO:0005865) myofilament(GO:0036379) |
| 0.0 | 2.0 | GO:0016324 | apical plasma membrane(GO:0016324) |
| 0.0 | 0.0 | GO:0009330 | DNA topoisomerase complex (ATP-hydrolyzing)(GO:0009330) |
| 0.0 | 4.4 | GO:0031012 | extracellular matrix(GO:0031012) |
| 0.0 | 0.1 | GO:0043034 | costamere(GO:0043034) |
| 0.0 | 0.2 | GO:0030127 | COPII vesicle coat(GO:0030127) |
| 0.0 | 0.4 | GO:0005637 | nuclear inner membrane(GO:0005637) |
Gene overrepresentation in molecular function category:
| Log-likelihood per target | Total log-likelihood | Term | Description |
|---|---|---|---|
| 0.4 | 2.4 | GO:0019834 | phospholipase A2 inhibitor activity(GO:0019834) |
| 0.4 | 1.9 | GO:0019865 | IgE binding(GO:0019863) immunoglobulin binding(GO:0019865) |
| 0.3 | 1.7 | GO:0008798 | beta-aspartyl-peptidase activity(GO:0008798) |
| 0.3 | 2.5 | GO:0001972 | retinoic acid binding(GO:0001972) |
| 0.3 | 1.1 | GO:0008073 | ornithine decarboxylase inhibitor activity(GO:0008073) |
| 0.3 | 1.4 | GO:0008260 | 3-oxoacid CoA-transferase activity(GO:0008260) |
| 0.2 | 1.1 | GO:0016531 | copper chaperone activity(GO:0016531) |
| 0.2 | 0.9 | GO:0015220 | choline transmembrane transporter activity(GO:0015220) |
| 0.2 | 1.0 | GO:0031769 | glucagon receptor binding(GO:0031769) |
| 0.2 | 2.3 | GO:0016500 | protein-hormone receptor activity(GO:0016500) |
| 0.2 | 0.5 | GO:0031716 | calcitonin receptor binding(GO:0031716) |
| 0.2 | 0.5 | GO:0070051 | fibrinogen binding(GO:0070051) |
| 0.1 | 0.9 | GO:0050998 | nitric-oxide synthase binding(GO:0050998) |
| 0.1 | 0.6 | GO:0035516 | oxidative DNA demethylase activity(GO:0035516) DNA-N1-methyladenine dioxygenase activity(GO:0043734) RNA N6-methyladenosine dioxygenase activity(GO:1990931) |
| 0.1 | 0.7 | GO:0055077 | gap junction hemi-channel activity(GO:0055077) |
| 0.1 | 0.8 | GO:0003938 | IMP dehydrogenase activity(GO:0003938) |
| 0.1 | 0.9 | GO:0004731 | purine-nucleoside phosphorylase activity(GO:0004731) |
| 0.1 | 0.3 | GO:0047690 | aspartyltransferase activity(GO:0047690) |
| 0.1 | 0.4 | GO:0019797 | procollagen-proline 3-dioxygenase activity(GO:0019797) peptidyl-proline 3-dioxygenase activity(GO:0031544) |
| 0.1 | 0.8 | GO:0016941 | natriuretic peptide receptor activity(GO:0016941) |
| 0.1 | 1.1 | GO:0030368 | interleukin-17 receptor activity(GO:0030368) |
| 0.1 | 1.3 | GO:0038191 | neuropilin binding(GO:0038191) |
| 0.1 | 2.0 | GO:0001540 | beta-amyloid binding(GO:0001540) |
| 0.1 | 0.3 | GO:1904121 | phosphatidylethanolamine transporter activity(GO:1904121) |
| 0.1 | 0.7 | GO:0004865 | protein serine/threonine phosphatase inhibitor activity(GO:0004865) |
| 0.1 | 1.1 | GO:0008327 | methyl-CpG binding(GO:0008327) |
| 0.1 | 0.6 | GO:0004634 | phosphopyruvate hydratase activity(GO:0004634) |
| 0.1 | 0.3 | GO:0008097 | 5S rRNA binding(GO:0008097) |
| 0.1 | 0.3 | GO:0017153 | sodium:dicarboxylate symporter activity(GO:0017153) |
| 0.1 | 0.2 | GO:0051916 | granulocyte colony-stimulating factor binding(GO:0051916) |
| 0.1 | 3.1 | GO:0005546 | phosphatidylinositol-4,5-bisphosphate binding(GO:0005546) |
| 0.1 | 2.0 | GO:0004707 | MAP kinase activity(GO:0004707) |
| 0.1 | 0.3 | GO:0004105 | choline-phosphate cytidylyltransferase activity(GO:0004105) |
| 0.0 | 0.4 | GO:0015057 | thrombin receptor activity(GO:0015057) |
| 0.0 | 0.4 | GO:0000064 | L-ornithine transmembrane transporter activity(GO:0000064) |
| 0.0 | 0.5 | GO:0050700 | CARD domain binding(GO:0050700) |
| 0.0 | 0.4 | GO:0004985 | opioid receptor activity(GO:0004985) |
| 0.0 | 0.8 | GO:0004720 | protein-lysine 6-oxidase activity(GO:0004720) |
| 0.0 | 0.3 | GO:0005159 | insulin-like growth factor receptor binding(GO:0005159) |
| 0.0 | 0.6 | GO:0031628 | opioid receptor binding(GO:0031628) |
| 0.0 | 5.3 | GO:0005201 | extracellular matrix structural constituent(GO:0005201) |
| 0.0 | 0.7 | GO:0008239 | dipeptidyl-peptidase activity(GO:0008239) |
| 0.0 | 0.7 | GO:0031681 | G-protein beta-subunit binding(GO:0031681) |
| 0.0 | 0.2 | GO:0031841 | neuropeptide Y receptor binding(GO:0031841) type 2 neuropeptide Y receptor binding(GO:0031843) |
| 0.0 | 0.4 | GO:0035259 | glucocorticoid receptor binding(GO:0035259) |
| 0.0 | 0.2 | GO:0036042 | long-chain fatty acyl-CoA binding(GO:0036042) |
| 0.0 | 0.1 | GO:0101006 | inorganic diphosphatase activity(GO:0004427) protein histidine phosphatase activity(GO:0101006) |
| 0.0 | 0.4 | GO:0043024 | ribosomal small subunit binding(GO:0043024) |
| 0.0 | 1.6 | GO:0016702 | oxidoreductase activity, acting on single donors with incorporation of molecular oxygen, incorporation of two atoms of oxygen(GO:0016702) |
| 0.0 | 1.2 | GO:0017075 | syntaxin-1 binding(GO:0017075) |
| 0.0 | 0.6 | GO:0004298 | threonine-type endopeptidase activity(GO:0004298) threonine-type peptidase activity(GO:0070003) |
| 0.0 | 0.2 | GO:0001786 | phosphatidylserine binding(GO:0001786) |
| 0.0 | 0.8 | GO:0030165 | PDZ domain binding(GO:0030165) |
| 0.0 | 0.2 | GO:0004060 | arylamine N-acetyltransferase activity(GO:0004060) |
| 0.0 | 1.7 | GO:0046332 | SMAD binding(GO:0046332) |
| 0.0 | 1.3 | GO:0042826 | histone deacetylase binding(GO:0042826) |
| 0.0 | 0.2 | GO:0016936 | galactoside binding(GO:0016936) |
| 0.0 | 0.6 | GO:0005154 | epidermal growth factor receptor binding(GO:0005154) |
| 0.0 | 1.4 | GO:0015020 | glucuronosyltransferase activity(GO:0015020) |
| 0.0 | 0.3 | GO:0004017 | adenylate kinase activity(GO:0004017) |
| 0.0 | 0.1 | GO:0004694 | eukaryotic translation initiation factor 2alpha kinase activity(GO:0004694) |
| 0.0 | 0.7 | GO:0050840 | extracellular matrix binding(GO:0050840) |
| 0.0 | 0.2 | GO:0016972 | thiol oxidase activity(GO:0016972) |
| 0.0 | 0.5 | GO:0005544 | calcium-dependent phospholipid binding(GO:0005544) |
| 0.0 | 2.2 | GO:0004867 | serine-type endopeptidase inhibitor activity(GO:0004867) |
| 0.0 | 0.1 | GO:0102344 | 3-hydroxyacyl-CoA dehydratase activity(GO:0018812) 3-hydroxy-behenoyl-CoA dehydratase activity(GO:0102344) 3-hydroxy-lignoceroyl-CoA dehydratase activity(GO:0102345) |
| 0.0 | 0.2 | GO:0017128 | phospholipid scramblase activity(GO:0017128) |
| 0.0 | 0.2 | GO:0015168 | glycerol transmembrane transporter activity(GO:0015168) |
| 0.0 | 2.6 | GO:0005179 | hormone activity(GO:0005179) |
| 0.0 | 0.4 | GO:0015347 | sodium-independent organic anion transmembrane transporter activity(GO:0015347) |
| 0.0 | 0.3 | GO:0005504 | fatty acid binding(GO:0005504) |
| 0.0 | 3.4 | GO:0003735 | structural constituent of ribosome(GO:0003735) |
| 0.0 | 1.1 | GO:0016712 | oxidoreductase activity, acting on paired donors, with incorporation or reduction of molecular oxygen, reduced flavin or flavoprotein as one donor, and incorporation of one atom of oxygen(GO:0016712) |
| 0.0 | 0.2 | GO:0005220 | inositol 1,4,5-trisphosphate-sensitive calcium-release channel activity(GO:0005220) |
| 0.0 | 0.5 | GO:0008331 | high voltage-gated calcium channel activity(GO:0008331) |
| 0.0 | 0.5 | GO:0048306 | calcium-dependent protein binding(GO:0048306) |
| 0.0 | 0.5 | GO:0017147 | Wnt-protein binding(GO:0017147) |
| 0.0 | 0.2 | GO:0004382 | guanosine-diphosphatase activity(GO:0004382) uridine-diphosphatase activity(GO:0045134) |
| 0.0 | 0.1 | GO:0047498 | calcium-dependent phospholipase A2 activity(GO:0047498) |
| 0.0 | 0.2 | GO:0015269 | calcium-activated potassium channel activity(GO:0015269) |
| 0.0 | 0.2 | GO:0015187 | glycine transmembrane transporter activity(GO:0015187) |
| 0.0 | 0.2 | GO:0015278 | calcium-release channel activity(GO:0015278) |
| 0.0 | 0.0 | GO:0061505 | DNA topoisomerase type II (ATP-hydrolyzing) activity(GO:0003918) DNA topoisomerase II activity(GO:0061505) |
| 0.0 | 0.3 | GO:0004622 | lysophospholipase activity(GO:0004622) |
| 0.0 | 0.1 | GO:0017110 | nucleoside-diphosphatase activity(GO:0017110) |
| 0.0 | 0.1 | GO:0050254 | rhodopsin kinase activity(GO:0050254) |
| 0.0 | 0.2 | GO:0050291 | sphingosine N-acyltransferase activity(GO:0050291) |
| 0.0 | 0.1 | GO:0015154 | sugar:proton symporter activity(GO:0005351) cation:sugar symporter activity(GO:0005402) sucrose:proton symporter activity(GO:0008506) sucrose transmembrane transporter activity(GO:0008515) disaccharide transmembrane transporter activity(GO:0015154) oligosaccharide transmembrane transporter activity(GO:0015157) |
| 0.0 | 0.3 | GO:0051787 | misfolded protein binding(GO:0051787) |
| 0.0 | 0.1 | GO:0035242 | protein-arginine omega-N asymmetric methyltransferase activity(GO:0035242) |
| 0.0 | 0.1 | GO:0048019 | receptor antagonist activity(GO:0048019) |
| 0.0 | 0.1 | GO:0016661 | oxidoreductase activity, acting on other nitrogenous compounds as donors(GO:0016661) |
| 0.0 | 0.2 | GO:0031492 | nucleosomal DNA binding(GO:0031492) |
| 0.0 | 0.5 | GO:0016620 | oxidoreductase activity, acting on the aldehyde or oxo group of donors, NAD or NADP as acceptor(GO:0016620) |
| 0.0 | 9.7 | GO:0005509 | calcium ion binding(GO:0005509) |
| 0.0 | 0.0 | GO:0070735 | protein-glycine ligase activity(GO:0070735) tubulin-glycine ligase activity(GO:0070738) |
Gene overrepresentation in curated gene sets: canonical pathways category:
| Log-likelihood per target | Total log-likelihood | Term | Description |
|---|---|---|---|
| 0.1 | 4.0 | NABA COLLAGENS | Genes encoding collagen proteins |
| 0.1 | 0.3 | ST PAC1 RECEPTOR PATHWAY | PAC1 Receptor Pathway |
| 0.1 | 1.0 | PID INTEGRIN2 PATHWAY | Beta2 integrin cell surface interactions |
| 0.0 | 1.4 | PID HNF3A PATHWAY | FOXA1 transcription factor network |
| 0.0 | 0.1 | PID GMCSF PATHWAY | GMCSF-mediated signaling events |
| 0.0 | 0.2 | PID ANTHRAX PATHWAY | Cellular roles of Anthrax toxin |
| 0.0 | 0.8 | PID LKB1 PATHWAY | LKB1 signaling events |
| 0.0 | 2.4 | NABA ECM GLYCOPROTEINS | Genes encoding structural ECM glycoproteins |
| 0.0 | 0.1 | ST IL 13 PATHWAY | Interleukin 13 (IL-13) Pathway |
Gene overrepresentation in curated gene sets: REACTOME pathways category:
| Log-likelihood per target | Total log-likelihood | Term | Description |
|---|---|---|---|
| 0.1 | 1.7 | REACTOME BILE SALT AND ORGANIC ANION SLC TRANSPORTERS | Genes involved in Bile salt and organic anion SLC transporters |
| 0.1 | 4.0 | REACTOME COLLAGEN FORMATION | Genes involved in Collagen formation |
| 0.1 | 1.0 | REACTOME COMMON PATHWAY | Genes involved in Common Pathway |
| 0.1 | 0.9 | REACTOME SYNTHESIS OF PC | Genes involved in Synthesis of PC |
| 0.1 | 0.2 | REACTOME PASSIVE TRANSPORT BY AQUAPORINS | Genes involved in Passive Transport by Aquaporins |
| 0.0 | 0.9 | REACTOME COMPLEMENT CASCADE | Genes involved in Complement cascade |
| 0.0 | 0.6 | REACTOME GLYCOLYSIS | Genes involved in Glycolysis |
| 0.0 | 0.3 | REACTOME HDL MEDIATED LIPID TRANSPORT | Genes involved in HDL-mediated lipid transport |
| 0.0 | 0.5 | REACTOME AMYLOIDS | Genes involved in Amyloids |
| 0.0 | 2.4 | REACTOME PEPTIDE CHAIN ELONGATION | Genes involved in Peptide chain elongation |
| 0.0 | 0.2 | REACTOME CGMP EFFECTS | Genes involved in cGMP effects |
| 0.0 | 0.6 | REACTOME CROSS PRESENTATION OF SOLUBLE EXOGENOUS ANTIGENS ENDOSOMES | Genes involved in Cross-presentation of soluble exogenous antigens (endosomes) |
| 0.0 | 0.2 | REACTOME NA CL DEPENDENT NEUROTRANSMITTER TRANSPORTERS | Genes involved in Na+/Cl- dependent neurotransmitter transporters |