Project
PRJNA195909:zebrafish embryo and larva development
Navigation
Downloads
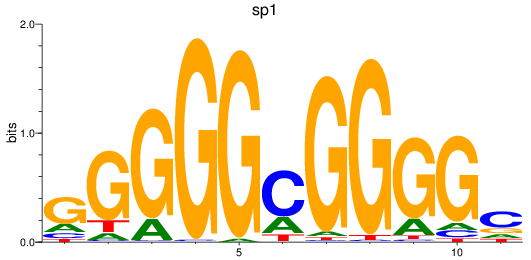
Results for sp1
Z-value: 1.25
Motif logo
Transcription factors associated with sp1
| Gene Symbol | Gene ID | Gene Info |
|---|---|---|
|
sp1
|
ENSDARG00000088347 | sp1 transcription factor |
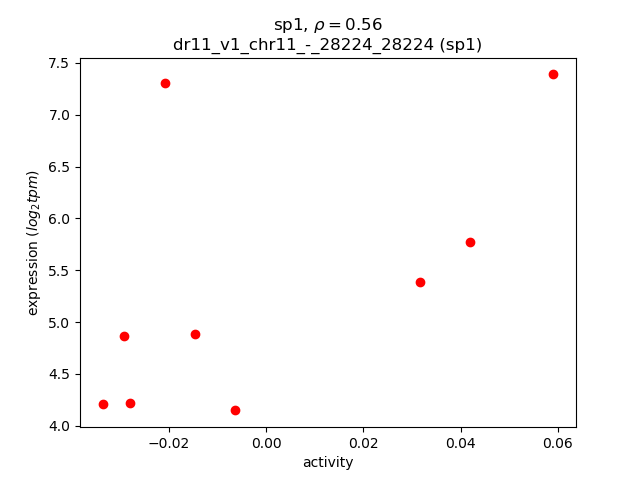
Activity-expression correlation:
| Gene | Promoter | Pearson corr. coef. | P-value | Plot |
|---|---|---|---|---|
| sp1 | dr11_v1_chr11_-_28224_28224 | 0.56 | 1.1e-01 | Click! |
Activity profile of sp1 motif
Sorted Z-values of sp1 motif
| Promoter | Log-likelihood | Transcript | Gene | Gene Info |
|---|---|---|---|---|
| chr10_-_1625080 | 1.31 |
ENSDART00000137285
|
nup155
|
nucleoporin 155 |
| chr13_+_45582391 | 1.25 |
ENSDART00000058093
|
ldlrap1b
|
low density lipoprotein receptor adaptor protein 1b |
| chr3_+_1211242 | 1.24 |
ENSDART00000171287
ENSDART00000165769 |
poldip3
|
polymerase (DNA-directed), delta interacting protein 3 |
| chr17_-_2584423 | 1.16 |
ENSDART00000013506
|
zp3.2
|
zona pellucida glycoprotein 3, tandem duplicate 2 |
| chr21_-_5056812 | 0.96 |
ENSDART00000139713
ENSDART00000140859 |
zgc:77838
|
zgc:77838 |
| chr16_-_29387215 | 0.89 |
ENSDART00000148787
|
s100a1
|
S100 calcium binding protein A1 |
| chr21_-_11646878 | 0.87 |
ENSDART00000162426
ENSDART00000135937 ENSDART00000131448 ENSDART00000148097 ENSDART00000133443 |
cast
|
calpastatin |
| chr13_-_17860307 | 0.87 |
ENSDART00000135920
ENSDART00000054579 |
march8
|
membrane-associated ring finger (C3HC4) 8 |
| chr12_+_46634736 | 0.87 |
ENSDART00000008009
|
trim16
|
tripartite motif containing 16 |
| chr10_+_8629275 | 0.87 |
ENSDART00000129643
|
aplnrb
|
apelin receptor b |
| chr8_-_51753604 | 0.82 |
ENSDART00000007090
|
tbx16
|
T-box 16 |
| chr17_-_50054025 | 0.81 |
ENSDART00000190105
|
FO834825.3
|
|
| chr5_-_54395488 | 0.79 |
ENSDART00000160781
|
zmynd19
|
zinc finger, MYND-type containing 19 |
| chr15_+_29025090 | 0.78 |
ENSDART00000131755
|
si:ch211-137a8.2
|
si:ch211-137a8.2 |
| chr21_-_30293224 | 0.75 |
ENSDART00000101051
|
slbp2
|
stem-loop binding protein 2 |
| chr20_+_39250673 | 0.75 |
ENSDART00000153003
|
reps1
|
RALBP1 associated Eps domain containing 1 |
| chr12_-_43664682 | 0.73 |
ENSDART00000159423
|
foxi1
|
forkhead box i1 |
| chr13_-_12021566 | 0.73 |
ENSDART00000125430
|
pprc1
|
peroxisome proliferator-activated receptor gamma, coactivator-related 1 |
| chr4_-_77551860 | 0.72 |
ENSDART00000188176
|
AL935186.6
|
|
| chr7_+_7630409 | 0.72 |
ENSDART00000172934
|
clcn3
|
chloride channel 3 |
| chr5_-_61609448 | 0.72 |
ENSDART00000133426
|
si:dkey-261j4.5
|
si:dkey-261j4.5 |
| chr25_+_22319940 | 0.72 |
ENSDART00000154065
ENSDART00000153492 ENSDART00000024866 ENSDART00000154376 |
cyp11a1
|
cytochrome P450, family 11, subfamily A, polypeptide 1 |
| chr17_-_50050453 | 0.70 |
ENSDART00000182057
|
zgc:100951
|
zgc:100951 |
| chr6_+_54576520 | 0.70 |
ENSDART00000093199
ENSDART00000127519 ENSDART00000157142 |
tead3b
|
TEA domain family member 3 b |
| chr17_-_2578026 | 0.69 |
ENSDART00000065821
|
zp3.2
|
zona pellucida glycoprotein 3, tandem duplicate 2 |
| chr7_-_48251234 | 0.67 |
ENSDART00000024062
ENSDART00000098904 |
cpeb1b
|
cytoplasmic polyadenylation element binding protein 1b |
| chr25_-_348784 | 0.66 |
ENSDART00000059514
|
prickle1a
|
prickle homolog 1a |
| chr7_+_44802353 | 0.66 |
ENSDART00000066380
|
ca7
|
carbonic anhydrase VII |
| chr17_-_2573021 | 0.66 |
ENSDART00000074181
|
zp3.2
|
zona pellucida glycoprotein 3, tandem duplicate 2 |
| chr17_-_50063437 | 0.66 |
ENSDART00000187943
|
zgc:113886
|
zgc:113886 |
| chr3_-_21118969 | 0.65 |
ENSDART00000129016
|
maza
|
MYC-associated zinc finger protein a (purine-binding transcription factor) |
| chr24_+_17005647 | 0.65 |
ENSDART00000149149
|
zfx
|
zinc finger protein, X-linked |
| chr23_+_553396 | 0.65 |
ENSDART00000034707
|
lsm14b
|
LSM family member 14B |
| chr25_+_16356083 | 0.65 |
ENSDART00000125925
ENSDART00000125444 |
tead1a
|
TEA domain family member 1a |
| chr23_+_35426404 | 0.65 |
ENSDART00000164658
|
si:ch211-225h24.2
|
si:ch211-225h24.2 |
| chr16_-_7793457 | 0.65 |
ENSDART00000113483
|
trim71
|
tripartite motif containing 71, E3 ubiquitin protein ligase |
| chr20_+_16173618 | 0.64 |
ENSDART00000192109
ENSDART00000104112 ENSDART00000129633 |
zyg11
|
zyg-11 homolog (C. elegans) |
| chr2_-_48826707 | 0.60 |
ENSDART00000134711
|
svilb
|
supervillin b |
| chr4_-_77563411 | 0.59 |
ENSDART00000186841
|
AL935186.8
|
|
| chr15_+_29024895 | 0.59 |
ENSDART00000141164
ENSDART00000144126 |
si:ch211-137a8.2
|
si:ch211-137a8.2 |
| chr7_-_45852270 | 0.59 |
ENSDART00000170224
|
shcbp1
|
SHC SH2-domain binding protein 1 |
| chr6_+_475264 | 0.58 |
ENSDART00000193615
|
LO017974.1
|
|
| chr9_+_22677503 | 0.57 |
ENSDART00000131429
ENSDART00000080005 ENSDART00000101756 ENSDART00000138148 |
itgb5
|
integrin, beta 5 |
| chr3_+_61523035 | 0.57 |
ENSDART00000106530
|
znf1004
|
zinc finger protein 1004 |
| chr15_+_29393519 | 0.56 |
ENSDART00000193488
ENSDART00000112375 |
gdpd5b
|
glycerophosphodiester phosphodiesterase domain containing 5b |
| chr18_-_26715655 | 0.55 |
ENSDART00000181497
|
malt3
|
MALT paracaspase 3 |
| chr3_+_29469283 | 0.54 |
ENSDART00000103592
|
fam83fa
|
family with sequence similarity 83, member Fa |
| chr2_-_52550135 | 0.53 |
ENSDART00000044411
|
gna11b
|
guanine nucleotide binding protein (G protein), alpha 11b (Gq class) |
| chr9_-_11263228 | 0.53 |
ENSDART00000113847
|
chpfa
|
chondroitin polymerizing factor a |
| chr20_-_31496679 | 0.53 |
ENSDART00000153437
ENSDART00000153193 |
sash1a
|
SAM and SH3 domain containing 1a |
| chr6_-_1820606 | 0.53 |
ENSDART00000183228
|
FO834857.1
|
|
| chr17_-_50045375 | 0.53 |
ENSDART00000184639
|
FO834825.2
|
|
| chr8_+_8671229 | 0.52 |
ENSDART00000131963
|
usp11
|
ubiquitin specific peptidase 11 |
| chr2_+_58221163 | 0.51 |
ENSDART00000157939
|
FO704813.1
|
|
| chr16_-_41762983 | 0.51 |
ENSDART00000192936
|
si:dkey-199f5.8
|
si:dkey-199f5.8 |
| chr10_-_7347311 | 0.51 |
ENSDART00000168885
|
nrg1
|
neuregulin 1 |
| chr18_-_127558 | 0.51 |
ENSDART00000149556
|
trpm7
|
transient receptor potential cation channel, subfamily M, member 7 |
| chr1_-_59232267 | 0.51 |
ENSDART00000169658
ENSDART00000163257 |
akap8l
|
A kinase (PRKA) anchor protein 8-like |
| chr16_+_25259313 | 0.50 |
ENSDART00000058938
|
fbxo32
|
F-box protein 32 |
| chr20_+_4157815 | 0.49 |
ENSDART00000113132
|
gnpat
|
glyceronephosphate O-acyltransferase |
| chr5_+_68807170 | 0.49 |
ENSDART00000017849
|
her7
|
hairy and enhancer of split related-7 |
| chr2_+_35880600 | 0.49 |
ENSDART00000004277
|
lamc1
|
laminin, gamma 1 |
| chr17_+_20500229 | 0.49 |
ENSDART00000088490
|
neurl1ab
|
neuralized E3 ubiquitin protein ligase 1Ab |
| chr23_+_37815645 | 0.49 |
ENSDART00000011627
|
irx7
|
iroquois homeobox 7 |
| chr5_+_6617401 | 0.49 |
ENSDART00000060532
|
zgc:110796
|
zgc:110796 |
| chr23_-_32236122 | 0.49 |
ENSDART00000103343
|
grasp
|
GRP1 (general receptor for phosphoinositides 1)-associated scaffold protein |
| chr20_+_51061695 | 0.48 |
ENSDART00000134416
|
im:7140055
|
im:7140055 |
| chr22_+_5574952 | 0.48 |
ENSDART00000171774
|
zgc:171566
|
zgc:171566 |
| chr21_-_41369539 | 0.48 |
ENSDART00000187546
|
cpeb4b
|
cytoplasmic polyadenylation element binding protein 4b |
| chr5_+_22067570 | 0.48 |
ENSDART00000045574
|
shisa2a
|
shisa family member 2a |
| chr6_-_12250740 | 0.48 |
ENSDART00000187321
|
pkp4
|
plakophilin 4 |
| chr11_-_7139555 | 0.47 |
ENSDART00000016472
|
bmp7a
|
bone morphogenetic protein 7a |
| chr17_-_50040927 | 0.46 |
ENSDART00000184304
|
FO834825.1
|
|
| chr6_+_38626684 | 0.46 |
ENSDART00000086533
|
atp10a
|
ATPase phospholipid transporting 10A |
| chr17_-_48944465 | 0.46 |
ENSDART00000154110
|
si:ch1073-80i24.3
|
si:ch1073-80i24.3 |
| chr18_+_26086803 | 0.46 |
ENSDART00000187911
|
znf710a
|
zinc finger protein 710a |
| chr19_-_6193067 | 0.46 |
ENSDART00000092656
ENSDART00000140347 |
erf
|
Ets2 repressor factor |
| chr17_-_53329704 | 0.46 |
ENSDART00000193895
|
exd1
|
exonuclease 3'-5' domain containing 1 |
| chr6_+_12922002 | 0.46 |
ENSDART00000080350
ENSDART00000149018 |
cxcr4a
|
chemokine (C-X-C motif) receptor 4a |
| chr24_-_20599781 | 0.45 |
ENSDART00000179664
ENSDART00000141823 |
zbtb47b
|
zinc finger and BTB domain containing 47b |
| chr5_+_35398745 | 0.45 |
ENSDART00000098010
|
ptger4b
|
prostaglandin E receptor 4 (subtype EP4) b |
| chr1_+_29741843 | 0.45 |
ENSDART00000136066
|
raph1b
|
Ras association (RalGDS/AF-6) and pleckstrin homology domains 1b |
| chr8_+_28371496 | 0.45 |
ENSDART00000158788
|
klhl12
|
kelch-like family member 12 |
| chr12_-_13729263 | 0.45 |
ENSDART00000078021
|
foxh1
|
forkhead box H1 |
| chr4_-_63848305 | 0.45 |
ENSDART00000097308
|
BX901974.1
|
|
| chr8_-_20138054 | 0.44 |
ENSDART00000133141
ENSDART00000147634 ENSDART00000029939 |
rfx2
|
regulatory factor X, 2 (influences HLA class II expression) |
| chr7_+_67325933 | 0.44 |
ENSDART00000170575
ENSDART00000183342 |
nfat5b
|
nuclear factor of activated T cells 5b |
| chr7_+_1473929 | 0.44 |
ENSDART00000050687
|
lpcat4
|
lysophosphatidylcholine acyltransferase 4 |
| chr5_+_20112032 | 0.44 |
ENSDART00000130554
|
isg15
|
ISG15 ubiquitin-like modifier |
| chr3_+_11568523 | 0.44 |
ENSDART00000179668
|
CABZ01087224.1
|
|
| chr1_-_54107321 | 0.43 |
ENSDART00000148382
ENSDART00000150357 |
rfx1b
|
regulatory factor X, 1b (influences HLA class II expression) |
| chr10_+_39199547 | 0.43 |
ENSDART00000075943
|
ei24
|
etoposide induced 2.4 |
| chr19_-_18313303 | 0.43 |
ENSDART00000164644
ENSDART00000167480 ENSDART00000163104 |
si:dkey-208k4.2
|
si:dkey-208k4.2 |
| chr19_-_24555935 | 0.43 |
ENSDART00000132660
ENSDART00000162801 |
polr3gla
|
polymerase (RNA) III (DNA directed) polypeptide G like a |
| chr4_-_13255700 | 0.43 |
ENSDART00000162277
ENSDART00000026593 |
grip1
|
glutamate receptor interacting protein 1 |
| chr11_+_42422638 | 0.43 |
ENSDART00000042599
ENSDART00000181175 |
dennd6aa
|
DENN/MADD domain containing 6Aa |
| chr19_+_1097393 | 0.43 |
ENSDART00000168218
|
CABZ01111953.1
|
|
| chr20_+_33987465 | 0.43 |
ENSDART00000061751
|
zp3a.2
|
zona pellucida glycoprotein 3a, tandem duplicate 2 |
| chr4_-_65323874 | 0.42 |
ENSDART00000175271
ENSDART00000187913 |
BX571813.1
|
|
| chr3_+_15776446 | 0.42 |
ENSDART00000146651
|
znf652
|
zinc finger protein 652 |
| chr8_+_11687254 | 0.42 |
ENSDART00000042040
|
atp2a2a
|
ATPase sarcoplasmic/endoplasmic reticulum Ca2+ transporting 2a |
| chr9_-_43213057 | 0.42 |
ENSDART00000059448
ENSDART00000133589 |
sestd1
|
SEC14 and spectrin domains 1 |
| chr19_-_46566430 | 0.42 |
ENSDART00000166668
|
ext1b
|
exostosin glycosyltransferase 1b |
| chr17_+_14965570 | 0.42 |
ENSDART00000066604
|
gpr137c
|
G protein-coupled receptor 137c |
| chr20_+_33991801 | 0.42 |
ENSDART00000061744
|
zp3a.1
|
zona pellucida glycoprotein 3a, tandem duplicate 1 |
| chr23_-_45955177 | 0.42 |
ENSDART00000165963
ENSDART00000186649 ENSDART00000185773 |
LO017850.1
|
|
| chr16_+_35594670 | 0.42 |
ENSDART00000163275
|
si:ch211-1i11.3
|
si:ch211-1i11.3 |
| chr11_+_31324335 | 0.42 |
ENSDART00000088093
|
sipa1l2
|
signal-induced proliferation-associated 1 like 2 |
| chr24_-_36593876 | 0.41 |
ENSDART00000160901
|
CABZ01055365.1
|
|
| chr6_+_12503849 | 0.41 |
ENSDART00000149529
|
stk24b
|
serine/threonine kinase 24b (STE20 homolog, yeast) |
| chr7_-_16598212 | 0.41 |
ENSDART00000128488
|
e2f8
|
E2F transcription factor 8 |
| chr23_-_46201008 | 0.41 |
ENSDART00000160110
|
tgm1l4
|
transglutaminase 1 like 4 |
| chr23_+_27703749 | 0.41 |
ENSDART00000027224
|
lmbr1l
|
limb development membrane protein 1-like |
| chr14_+_1127866 | 0.41 |
ENSDART00000172820
|
sec24b
|
SEC24 homolog B, COPII coat complex component |
| chr21_-_37027252 | 0.41 |
ENSDART00000076483
|
zgc:77151
|
zgc:77151 |
| chr9_-_43213229 | 0.41 |
ENSDART00000139775
|
sestd1
|
SEC14 and spectrin domains 1 |
| chr6_-_52484566 | 0.40 |
ENSDART00000112146
|
fam83c
|
family with sequence similarity 83, member C |
| chr17_-_50071748 | 0.40 |
ENSDART00000075188
|
zgc:113886
|
zgc:113886 |
| chr9_-_46415847 | 0.40 |
ENSDART00000009790
|
cx43.4
|
connexin 43.4 |
| chr9_+_50175366 | 0.40 |
ENSDART00000170352
|
cobll1b
|
cordon-bleu WH2 repeat protein-like 1b |
| chr20_-_28698172 | 0.40 |
ENSDART00000190635
|
sipa1l1
|
signal-induced proliferation-associated 1 like 1 |
| chr15_+_11644866 | 0.40 |
ENSDART00000188716
|
slc1a5
|
solute carrier family 1 (neutral amino acid transporter), member 5 |
| chr8_-_53490376 | 0.40 |
ENSDART00000158789
|
chdh
|
choline dehydrogenase |
| chr1_+_15062 | 0.40 |
ENSDART00000169005
|
cep97
|
centrosomal protein 97 |
| chr18_-_26715156 | 0.39 |
ENSDART00000142043
|
malt3
|
MALT paracaspase 3 |
| chr3_+_29082267 | 0.39 |
ENSDART00000145615
|
cacna1i
|
calcium channel, voltage-dependent, T type, alpha 1I subunit |
| chr15_+_40188076 | 0.39 |
ENSDART00000063779
|
efhd1
|
EF-hand domain family, member D1 |
| chr17_+_25856671 | 0.39 |
ENSDART00000064817
|
wapla
|
WAPL cohesin release factor a |
| chr17_-_25831569 | 0.39 |
ENSDART00000148743
|
hhat
|
hedgehog acyltransferase |
| chr7_-_24995631 | 0.39 |
ENSDART00000173955
ENSDART00000173791 |
rcor2
|
REST corepressor 2 |
| chr5_-_23800376 | 0.39 |
ENSDART00000134184
|
gbgt1l4
|
globoside alpha-1,3-N-acetylgalactosaminyltransferase 1, like 4 |
| chr8_-_20230559 | 0.39 |
ENSDART00000193677
|
mllt1a
|
MLLT1, super elongation complex subunit a |
| chr10_-_641609 | 0.39 |
ENSDART00000041236
|
rfx3
|
regulatory factor X, 3 (influences HLA class II expression) |
| chr19_+_20201254 | 0.39 |
ENSDART00000010140
|
igf2bp3
|
insulin-like growth factor 2 mRNA binding protein 3 |
| chr6_+_32326074 | 0.39 |
ENSDART00000042134
ENSDART00000181177 |
dock7
|
dedicator of cytokinesis 7 |
| chr2_-_47957673 | 0.39 |
ENSDART00000056305
|
fzd8b
|
frizzled class receptor 8b |
| chr12_-_8958011 | 0.39 |
ENSDART00000141212
|
cyp26a1
|
cytochrome P450, family 26, subfamily A, polypeptide 1 |
| chr11_-_7147540 | 0.38 |
ENSDART00000143942
|
bmp7a
|
bone morphogenetic protein 7a |
| chr7_+_38349667 | 0.38 |
ENSDART00000010046
|
rhpn2
|
rhophilin, Rho GTPase binding protein 2 |
| chr13_-_45942000 | 0.38 |
ENSDART00000158534
ENSDART00000171822 ENSDART00000166442 |
si:ch211-62a1.4
|
si:ch211-62a1.4 |
| chr23_+_38171186 | 0.38 |
ENSDART00000148188
|
zgc:112994
|
zgc:112994 |
| chr18_-_127873 | 0.38 |
ENSDART00000148490
|
trpm7
|
transient receptor potential cation channel, subfamily M, member 7 |
| chr13_+_33688474 | 0.38 |
ENSDART00000161465
|
CABZ01087953.1
|
|
| chr5_+_36513605 | 0.38 |
ENSDART00000013590
|
wnt11
|
wingless-type MMTV integration site family, member 11 |
| chr4_-_16124417 | 0.38 |
ENSDART00000128079
ENSDART00000077664 |
atp2b1a
|
ATPase plasma membrane Ca2+ transporting 1a |
| chr3_+_46559639 | 0.38 |
ENSDART00000146189
ENSDART00000127832 ENSDART00000151035 |
raver1
|
ribonucleoprotein, PTB-binding 1 |
| chr8_+_53051701 | 0.38 |
ENSDART00000131514
|
nadka
|
NAD kinase a |
| chr22_+_508290 | 0.38 |
ENSDART00000135403
|
nuak2
|
NUAK family, SNF1-like kinase, 2 |
| chr8_+_23725957 | 0.38 |
ENSDART00000104346
|
mkrn4
|
makorin, ring finger protein, 4 |
| chr20_-_182841 | 0.38 |
ENSDART00000064546
|
si:ch211-241j12.3
|
si:ch211-241j12.3 |
| chr1_+_44196236 | 0.38 |
ENSDART00000179560
ENSDART00000166324 |
ctnnd1
|
catenin (cadherin-associated protein), delta 1 |
| chr19_+_26340736 | 0.37 |
ENSDART00000013497
|
mylipa
|
myosin regulatory light chain interacting protein a |
| chr19_+_7636941 | 0.37 |
ENSDART00000081611
ENSDART00000163805 ENSDART00000112404 |
cgnb
|
cingulin b |
| chr19_-_6193448 | 0.37 |
ENSDART00000151405
|
erf
|
Ets2 repressor factor |
| chr3_+_24708685 | 0.37 |
ENSDART00000153507
|
mkl1a
|
megakaryoblastic leukemia (translocation) 1a |
| chr19_+_19989380 | 0.37 |
ENSDART00000142841
|
osbpl3a
|
oxysterol binding protein-like 3a |
| chr22_+_10232527 | 0.37 |
ENSDART00000139297
|
si:dkeyp-87e7.4
|
si:dkeyp-87e7.4 |
| chr15_-_25094026 | 0.37 |
ENSDART00000129154
|
exo5
|
exonuclease 5 |
| chr2_+_29884363 | 0.37 |
ENSDART00000139247
|
si:ch211-207d6.2
|
si:ch211-207d6.2 |
| chr12_-_8958353 | 0.37 |
ENSDART00000041728
|
cyp26a1
|
cytochrome P450, family 26, subfamily A, polypeptide 1 |
| chr9_+_35860975 | 0.37 |
ENSDART00000134447
|
rcan1a
|
regulator of calcineurin 1a |
| chr9_+_34230067 | 0.37 |
ENSDART00000139157
|
nxpe3
|
neurexophilin and PC-esterase domain family, member 3 |
| chr17_+_51746830 | 0.36 |
ENSDART00000184230
|
odc1
|
ornithine decarboxylase 1 |
| chr16_-_11241424 | 0.36 |
ENSDART00000134752
|
znf526
|
zinc finger protein 526 |
| chr7_-_19332293 | 0.36 |
ENSDART00000169668
ENSDART00000137575 ENSDART00000090406 |
dock11
|
dedicator of cytokinesis 11 |
| chr24_+_42132962 | 0.36 |
ENSDART00000187739
|
wwp1
|
WW domain containing E3 ubiquitin protein ligase 1 |
| chr22_+_1006573 | 0.36 |
ENSDART00000123458
|
pparda
|
peroxisome proliferator-activated receptor delta a |
| chr14_+_31865099 | 0.36 |
ENSDART00000189124
|
tm9sf5
|
transmembrane 9 superfamily protein member 5 |
| chr5_+_61361815 | 0.36 |
ENSDART00000009507
|
gatsl2
|
GATS protein-like 2 |
| chr3_+_53352018 | 0.36 |
ENSDART00000082715
|
camsap3
|
calmodulin regulated spectrin-associated protein family, member 3 |
| chr15_+_35933094 | 0.36 |
ENSDART00000019976
|
rhbdd1
|
rhomboid domain containing 1 |
| chr17_+_12075805 | 0.36 |
ENSDART00000155329
|
cnsta
|
consortin, connexin sorting protein a |
| chr7_+_1449999 | 0.36 |
ENSDART00000173864
|
si:cabz01101003.1
|
si:cabz01101003.1 |
| chr15_-_17010358 | 0.36 |
ENSDART00000156768
|
hip1
|
huntingtin interacting protein 1 |
| chr19_-_10295173 | 0.36 |
ENSDART00000136697
|
cnot3b
|
CCR4-NOT transcription complex, subunit 3b |
| chr6_+_3334392 | 0.35 |
ENSDART00000133707
ENSDART00000130879 |
st3gal3a
|
ST3 beta-galactoside alpha-2,3-sialyltransferase 3a |
| chr1_+_29858032 | 0.35 |
ENSDART00000054066
|
zic2b
|
zic family member 2 (odd-paired homolog, Drosophila) b |
| chr25_-_22889519 | 0.35 |
ENSDART00000128250
|
mob2a
|
MOB kinase activator 2a |
| chr3_-_61494840 | 0.35 |
ENSDART00000101957
|
baiap2l1b
|
BAI1-associated protein 2-like 1b |
| chr2_-_58075414 | 0.35 |
ENSDART00000161920
|
nectin4
|
nectin cell adhesion molecule 4 |
| chr1_-_40102836 | 0.35 |
ENSDART00000147317
|
cntf
|
ciliary neurotrophic factor |
| chr13_+_45332203 | 0.35 |
ENSDART00000110466
|
si:ch211-168h21.3
|
si:ch211-168h21.3 |
| chr16_-_29194517 | 0.35 |
ENSDART00000046114
ENSDART00000148899 |
mef2d
|
myocyte enhancer factor 2d |
| chr3_+_36972586 | 0.35 |
ENSDART00000102784
|
si:ch211-18i17.2
|
si:ch211-18i17.2 |
| chr20_-_1635922 | 0.35 |
ENSDART00000181502
|
CR846082.1
|
|
| chr12_-_290413 | 0.34 |
ENSDART00000152496
|
adprm
|
ADP-ribose/CDP-alcohol diphosphatase, manganese-dependent |
| chr1_+_47331644 | 0.34 |
ENSDART00000053284
|
bcl9
|
B cell CLL/lymphoma 9 |
| chr19_-_24125457 | 0.34 |
ENSDART00000080632
|
zgc:64022
|
zgc:64022 |
| chr10_-_37487612 | 0.34 |
ENSDART00000167964
ENSDART00000171326 |
si:dkey-65j4.2
|
si:dkey-65j4.2 |
| chr7_-_5396154 | 0.34 |
ENSDART00000172980
|
arhgef11
|
Rho guanine nucleotide exchange factor (GEF) 11 |
| chr5_-_68782641 | 0.34 |
ENSDART00000141699
|
mepce
|
methylphosphate capping enzyme |
| chr19_-_8812891 | 0.34 |
ENSDART00000151134
ENSDART00000025385 ENSDART00000180291 |
cers2a
|
ceramide synthase 2a |
| chr15_-_25093680 | 0.34 |
ENSDART00000062695
|
exo5
|
exonuclease 5 |
| chr11_+_42422371 | 0.34 |
ENSDART00000163780
|
dennd6aa
|
DENN/MADD domain containing 6Aa |
| chr12_+_48841182 | 0.34 |
ENSDART00000109315
ENSDART00000185609 ENSDART00000187217 |
dlg5b.1
|
discs, large homolog 5b (Drosophila), tandem duplicate 1 |
| chr12_+_33484458 | 0.34 |
ENSDART00000000069
|
slc9a3r1a
|
solute carrier family 9, subfamily A (NHE3, cation proton antiporter 3), member 3 regulator 1a |
| chr14_-_237130 | 0.34 |
ENSDART00000164988
|
bod1l1
|
biorientation of chromosomes in cell division 1-like 1 |
| chr20_+_2731436 | 0.34 |
ENSDART00000058779
ENSDART00000129870 ENSDART00000132186 ENSDART00000152727 |
syncrip
|
synaptotagmin binding, cytoplasmic RNA interacting protein |
| chr2_+_35603637 | 0.33 |
ENSDART00000147278
|
plk3
|
polo-like kinase 3 (Drosophila) |
| chr7_+_38962207 | 0.33 |
ENSDART00000173565
|
dgkza
|
diacylglycerol kinase, zeta a |
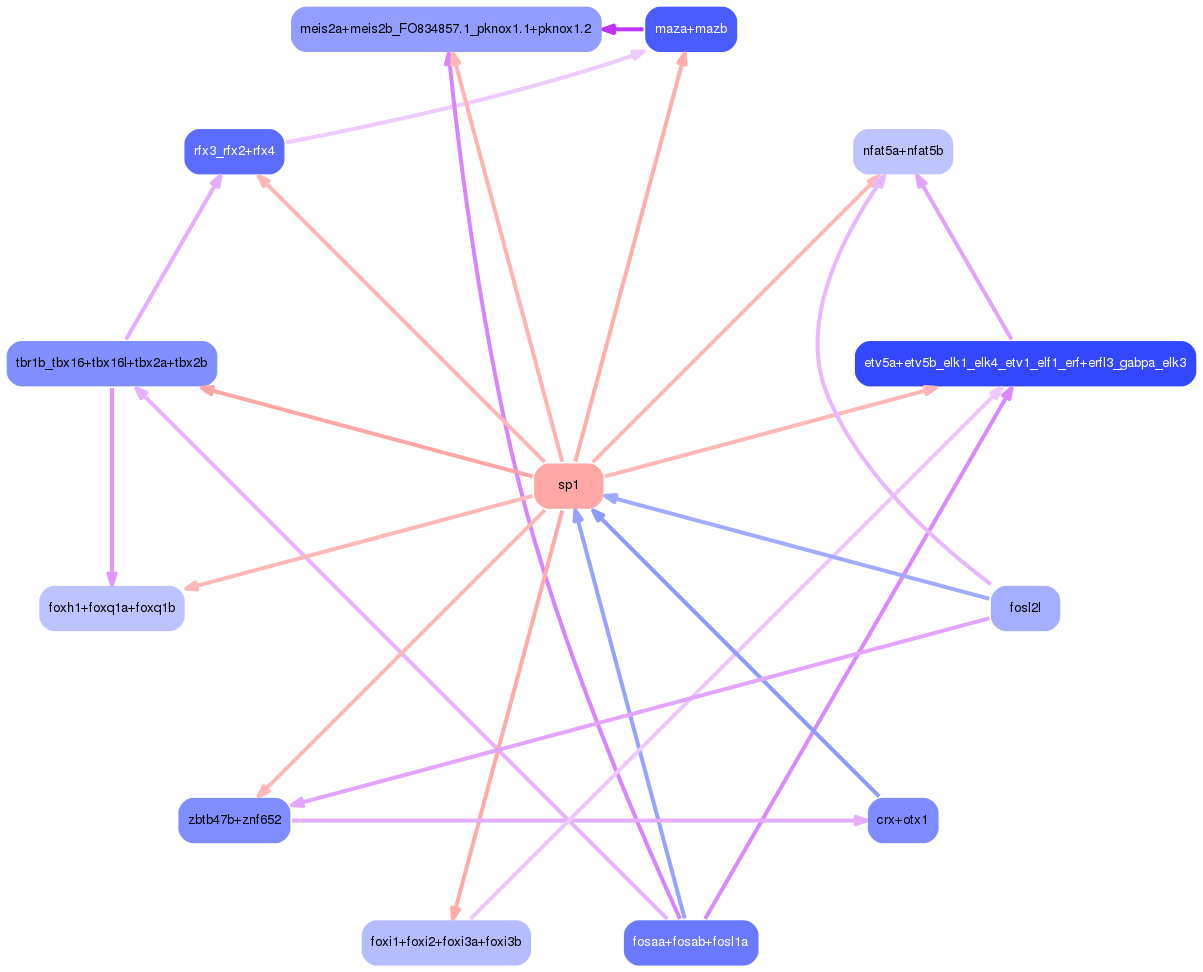
Network of associatons between targets according to the STRING database.

First level regulatory network of sp1
Gene Ontology Analysis
Gene overrepresentation in biological process category:
| Log-likelihood per target | Total log-likelihood | Term | Description |
|---|---|---|---|
| 0.4 | 1.3 | GO:0090435 | protein targeting to nuclear inner membrane(GO:0036228) protein localization to nuclear envelope(GO:0090435) |
| 0.3 | 0.9 | GO:0060959 | activation of transmembrane receptor protein tyrosine kinase activity(GO:0007171) Schwann cell migration(GO:0036135) cardiac neuron differentiation(GO:0060945) cardiac neuron development(GO:0060959) |
| 0.3 | 0.9 | GO:0010961 | cellular magnesium ion homeostasis(GO:0010961) |
| 0.3 | 0.8 | GO:0048389 | paraxial mesoderm morphogenesis(GO:0048340) paraxial mesoderm formation(GO:0048341) intermediate mesoderm development(GO:0048389) |
| 0.2 | 0.7 | GO:1901503 | ether lipid biosynthetic process(GO:0008611) glycerol ether biosynthetic process(GO:0046504) cellular lipid biosynthetic process(GO:0097384) ether biosynthetic process(GO:1901503) |
| 0.2 | 0.9 | GO:0033301 | cell cycle comprising mitosis without cytokinesis(GO:0033301) |
| 0.2 | 0.9 | GO:0002495 | antigen processing and presentation of peptide antigen via MHC class II(GO:0002495) |
| 0.2 | 0.9 | GO:1903589 | regulation of blood vessel endothelial cell proliferation involved in sprouting angiogenesis(GO:1903587) positive regulation of blood vessel endothelial cell proliferation involved in sprouting angiogenesis(GO:1903589) |
| 0.2 | 3.4 | GO:0060046 | binding of sperm to zona pellucida(GO:0007339) egg coat formation(GO:0035803) regulation of acrosome reaction(GO:0060046) positive regulation of acrosome reaction(GO:2000344) |
| 0.2 | 0.7 | GO:0009957 | epidermal cell fate specification(GO:0009957) lateral line ganglion development(GO:0048890) |
| 0.2 | 0.8 | GO:0016115 | diterpenoid catabolic process(GO:0016103) terpenoid catabolic process(GO:0016115) retinoic acid catabolic process(GO:0034653) |
| 0.1 | 0.4 | GO:0060063 | axial mesodermal cell differentiation(GO:0048321) axial mesodermal cell fate commitment(GO:0048322) axial mesodermal cell fate specification(GO:0048327) Spemann organizer formation at the embryonic shield(GO:0060063) |
| 0.1 | 0.7 | GO:0006700 | C21-steroid hormone biosynthetic process(GO:0006700) |
| 0.1 | 0.4 | GO:0090004 | positive regulation of Golgi to plasma membrane protein transport(GO:0042998) positive regulation of establishment of protein localization to plasma membrane(GO:0090004) |
| 0.1 | 0.7 | GO:1900363 | regulation of mRNA polyadenylation(GO:1900363) |
| 0.1 | 0.4 | GO:0019695 | choline metabolic process(GO:0019695) |
| 0.1 | 0.9 | GO:0040016 | embryonic cleavage(GO:0040016) |
| 0.1 | 0.4 | GO:0060623 | regulation of chromosome condensation(GO:0060623) |
| 0.1 | 0.6 | GO:0010586 | miRNA metabolic process(GO:0010586) |
| 0.1 | 0.6 | GO:0060231 | mesenchymal to epithelial transition(GO:0060231) |
| 0.1 | 0.9 | GO:0097340 | inhibition of cysteine-type endopeptidase activity(GO:0097340) zymogen inhibition(GO:0097341) |
| 0.1 | 0.5 | GO:0046900 | tetrahydrofolylpolyglutamate metabolic process(GO:0046900) |
| 0.1 | 0.3 | GO:1904869 | positive regulation of protein localization to nucleus(GO:1900182) regulation of protein localization to Cajal body(GO:1904869) positive regulation of protein localization to Cajal body(GO:1904871) |
| 0.1 | 0.5 | GO:0070587 | regulation of cell-cell adhesion involved in gastrulation(GO:0070587) |
| 0.1 | 0.3 | GO:0043654 | recognition of apoptotic cell(GO:0043654) |
| 0.1 | 0.3 | GO:0035676 | anterior lateral line neuromast hair cell development(GO:0035676) |
| 0.1 | 0.3 | GO:1903003 | positive regulation of protein deubiquitination(GO:1903003) |
| 0.1 | 0.4 | GO:1900180 | regulation of protein import into nucleus(GO:0042306) negative regulation of protein import into nucleus(GO:0042308) negative regulation of nucleocytoplasmic transport(GO:0046823) regulation of protein localization to nucleus(GO:1900180) negative regulation of protein localization to nucleus(GO:1900181) regulation of protein import(GO:1904589) negative regulation of protein import(GO:1904590) |
| 0.1 | 0.3 | GO:0070874 | negative regulation of glycogen biosynthetic process(GO:0045719) negative regulation of glycogen metabolic process(GO:0070874) |
| 0.1 | 0.3 | GO:0060898 | spinal cord radial glial cell differentiation(GO:0021531) eye field cell fate commitment involved in camera-type eye formation(GO:0060898) |
| 0.1 | 0.3 | GO:0045601 | regulation of endothelial cell differentiation(GO:0045601) |
| 0.1 | 0.3 | GO:0061614 | pri-miRNA transcription from RNA polymerase II promoter(GO:0061614) regulation of pri-miRNA transcription from RNA polymerase II promoter(GO:1902893) positive regulation of pri-miRNA transcription from RNA polymerase II promoter(GO:1902895) |
| 0.1 | 0.2 | GO:0060628 | regulation of ER to Golgi vesicle-mediated transport(GO:0060628) |
| 0.1 | 0.5 | GO:0010828 | positive regulation of glucose transport(GO:0010828) |
| 0.1 | 0.5 | GO:0071380 | response to prostaglandin E(GO:0034695) cellular response to prostaglandin E stimulus(GO:0071380) |
| 0.1 | 0.5 | GO:0060282 | positive regulation of oocyte development(GO:0060282) |
| 0.1 | 1.2 | GO:0090308 | methylation-dependent chromatin silencing(GO:0006346) positive regulation of chromatin silencing(GO:0031937) regulation of methylation-dependent chromatin silencing(GO:0090308) positive regulation of methylation-dependent chromatin silencing(GO:0090309) |
| 0.1 | 0.3 | GO:0035751 | regulation of lysosomal lumen pH(GO:0035751) |
| 0.1 | 0.5 | GO:0007603 | phototransduction, visible light(GO:0007603) |
| 0.1 | 0.3 | GO:0045002 | double-strand break repair via single-strand annealing(GO:0045002) |
| 0.1 | 0.3 | GO:0048308 | organelle inheritance(GO:0048308) Golgi inheritance(GO:0048313) |
| 0.1 | 0.3 | GO:2000677 | histone H3-K79 methylation(GO:0034729) regulation of transcription regulatory region DNA binding(GO:2000677) |
| 0.1 | 0.2 | GO:0055109 | invagination involved in gastrulation with mouth forming second(GO:0055109) morphogenesis of an epithelial fold(GO:0060571) |
| 0.1 | 0.5 | GO:0042795 | snRNA transcription from RNA polymerase II promoter(GO:0042795) |
| 0.1 | 0.6 | GO:0051673 | membrane disruption in other organism(GO:0051673) |
| 0.1 | 0.2 | GO:0035477 | regulation of angioblast cell migration involved in selective angioblast sprouting(GO:0035477) |
| 0.1 | 0.9 | GO:0042664 | locus ceruleus development(GO:0021703) negative regulation of endodermal cell fate specification(GO:0042664) |
| 0.1 | 0.5 | GO:0031507 | heterochromatin assembly(GO:0031507) |
| 0.1 | 0.3 | GO:0032208 | regulation of telomere maintenance via recombination(GO:0032207) negative regulation of telomere maintenance via recombination(GO:0032208) |
| 0.1 | 0.3 | GO:0072314 | glomerular visceral epithelial cell fate commitment(GO:0072149) glomerular epithelial cell fate commitment(GO:0072314) |
| 0.1 | 0.4 | GO:0034505 | tooth mineralization(GO:0034505) |
| 0.1 | 0.2 | GO:0097500 | receptor localization to nonmotile primary cilium(GO:0097500) protein localization to ciliary membrane(GO:1903441) |
| 0.1 | 0.2 | GO:0099552 | trans-synaptic signaling by lipid, modulating synaptic transmission(GO:0099552) trans-synaptic signaling by endocannabinoid, modulating synaptic transmission(GO:0099553) |
| 0.1 | 0.8 | GO:2000766 | negative regulation of cytoplasmic translation(GO:2000766) |
| 0.1 | 0.3 | GO:0090230 | regulation of centromere complex assembly(GO:0090230) regulation of kinetochore assembly(GO:0090234) |
| 0.1 | 0.4 | GO:0033169 | histone H3-K9 demethylation(GO:0033169) |
| 0.1 | 0.3 | GO:0090244 | Wnt signaling pathway involved in somitogenesis(GO:0090244) |
| 0.1 | 0.2 | GO:0010526 | regulation of transposition, RNA-mediated(GO:0010525) negative regulation of transposition, RNA-mediated(GO:0010526) transposition, RNA-mediated(GO:0032197) positive regulation of neuron apoptotic process(GO:0043525) positive regulation of neuron death(GO:1901216) |
| 0.1 | 1.1 | GO:0046626 | regulation of insulin receptor signaling pathway(GO:0046626) |
| 0.1 | 0.3 | GO:0017003 | protein-heme linkage(GO:0017003) protein-tetrapyrrole linkage(GO:0017006) cytochrome c-heme linkage(GO:0018063) |
| 0.1 | 0.2 | GO:0001692 | histamine metabolic process(GO:0001692) |
| 0.1 | 0.2 | GO:0003222 | ventricular trabecula myocardium morphogenesis(GO:0003222) |
| 0.1 | 0.2 | GO:0019284 | L-methionine biosynthetic process from S-adenosylmethionine(GO:0019284) |
| 0.1 | 0.2 | GO:0055091 | phospholipid homeostasis(GO:0055091) |
| 0.1 | 1.1 | GO:0032467 | positive regulation of cytokinesis(GO:0032467) |
| 0.1 | 0.2 | GO:0042754 | negative regulation of circadian rhythm(GO:0042754) |
| 0.1 | 0.2 | GO:0060300 | regulation of cytokine activity(GO:0060300) regulation of receptor binding(GO:1900120) regulation of chemokine activity(GO:1900136) |
| 0.1 | 0.2 | GO:0016332 | establishment or maintenance of polarity of embryonic epithelium(GO:0016332) |
| 0.1 | 0.3 | GO:0045647 | negative regulation of erythrocyte differentiation(GO:0045647) |
| 0.1 | 0.2 | GO:0071333 | cellular response to carbohydrate stimulus(GO:0071322) cellular response to monosaccharide stimulus(GO:0071326) cellular response to hexose stimulus(GO:0071331) cellular response to glucose stimulus(GO:0071333) |
| 0.1 | 0.5 | GO:0046716 | muscle cell cellular homeostasis(GO:0046716) |
| 0.1 | 0.4 | GO:0070934 | CRD-mediated mRNA stabilization(GO:0070934) |
| 0.1 | 0.6 | GO:0021535 | cell migration in hindbrain(GO:0021535) |
| 0.1 | 0.5 | GO:0072498 | embryonic skeletal joint development(GO:0072498) |
| 0.1 | 0.4 | GO:0006741 | NADP biosynthetic process(GO:0006741) |
| 0.1 | 0.4 | GO:0046600 | negative regulation of centriole replication(GO:0046600) |
| 0.1 | 0.3 | GO:0055071 | manganese ion homeostasis(GO:0055071) |
| 0.1 | 0.5 | GO:0007080 | mitotic metaphase plate congression(GO:0007080) |
| 0.1 | 0.3 | GO:0071947 | protein deubiquitination involved in ubiquitin-dependent protein catabolic process(GO:0071947) |
| 0.1 | 0.4 | GO:0010887 | negative regulation of cholesterol storage(GO:0010887) |
| 0.1 | 0.8 | GO:0090110 | cargo loading into COPII-coated vesicle(GO:0090110) |
| 0.1 | 0.3 | GO:0003232 | bulbus arteriosus development(GO:0003232) |
| 0.1 | 0.4 | GO:0033278 | cell proliferation in midbrain(GO:0033278) |
| 0.1 | 0.2 | GO:0048387 | negative regulation of retinoic acid receptor signaling pathway(GO:0048387) |
| 0.1 | 0.5 | GO:0048208 | vesicle targeting, rough ER to cis-Golgi(GO:0048207) COPII vesicle coating(GO:0048208) |
| 0.0 | 0.2 | GO:0031584 | positive regulation of phospholipase activity(GO:0010518) activation of phospholipase D activity(GO:0031584) positive regulation of lipase activity(GO:0060193) |
| 0.0 | 0.1 | GO:0003228 | atrial cardiac muscle tissue development(GO:0003228) |
| 0.0 | 0.1 | GO:0070417 | cellular response to cold(GO:0070417) |
| 0.0 | 0.2 | GO:0003241 | growth involved in heart morphogenesis(GO:0003241) cardiac chamber ballooning(GO:0003242) cardiac muscle tissue growth involved in heart morphogenesis(GO:0003245) |
| 0.0 | 0.1 | GO:0033512 | L-lysine catabolic process to acetyl-CoA via saccharopine(GO:0033512) |
| 0.0 | 0.1 | GO:0050714 | positive regulation of protein secretion(GO:0050714) |
| 0.0 | 0.6 | GO:0008078 | mesodermal cell migration(GO:0008078) |
| 0.0 | 0.2 | GO:0035912 | aorta morphogenesis(GO:0035909) dorsal aorta morphogenesis(GO:0035912) |
| 0.0 | 0.2 | GO:0046850 | regulation of bone remodeling(GO:0046850) |
| 0.0 | 0.2 | GO:0003096 | renal sodium ion transport(GO:0003096) renal sodium ion absorption(GO:0070294) |
| 0.0 | 0.3 | GO:1905066 | regulation of canonical Wnt signaling pathway involved in heart development(GO:1905066) |
| 0.0 | 0.1 | GO:0019264 | glycine biosynthetic process from serine(GO:0019264) |
| 0.0 | 0.2 | GO:1904182 | regulation of pyruvate dehydrogenase activity(GO:1904182) positive regulation of pyruvate dehydrogenase activity(GO:1904184) |
| 0.0 | 0.3 | GO:0032515 | negative regulation of phosphoprotein phosphatase activity(GO:0032515) |
| 0.0 | 0.4 | GO:1904263 | positive regulation of TORC1 signaling(GO:1904263) |
| 0.0 | 0.2 | GO:0043508 | negative regulation of JUN kinase activity(GO:0043508) |
| 0.0 | 0.5 | GO:0050962 | detection of light stimulus involved in visual perception(GO:0050908) detection of light stimulus involved in sensory perception(GO:0050962) |
| 0.0 | 0.2 | GO:0030327 | prenylated protein catabolic process(GO:0030327) prenylcysteine catabolic process(GO:0030328) prenylcysteine metabolic process(GO:0030329) |
| 0.0 | 0.9 | GO:0050796 | regulation of insulin secretion(GO:0050796) |
| 0.0 | 0.3 | GO:0042138 | meiotic DNA double-strand break formation(GO:0042138) |
| 0.0 | 0.2 | GO:0034969 | histone arginine methylation(GO:0034969) |
| 0.0 | 0.2 | GO:0045638 | negative regulation of myeloid cell differentiation(GO:0045638) |
| 0.0 | 0.2 | GO:0072103 | renal system vasculature morphogenesis(GO:0061438) kidney vasculature morphogenesis(GO:0061439) glomerulus vasculature morphogenesis(GO:0072103) glomerular capillary formation(GO:0072104) |
| 0.0 | 0.4 | GO:0033387 | putrescine biosynthetic process from ornithine(GO:0033387) |
| 0.0 | 0.1 | GO:0001113 | DNA-templated transcriptional open complex formation(GO:0001112) transcriptional open complex formation at RNA polymerase II promoter(GO:0001113) protein-DNA complex remodeling(GO:0001120) |
| 0.0 | 0.4 | GO:0003139 | secondary heart field specification(GO:0003139) |
| 0.0 | 0.6 | GO:0030206 | chondroitin sulfate biosynthetic process(GO:0030206) |
| 0.0 | 0.2 | GO:0019427 | acetate metabolic process(GO:0006083) acetyl-CoA biosynthetic process from acetate(GO:0019427) |
| 0.0 | 0.3 | GO:0051310 | metaphase plate congression(GO:0051310) |
| 0.0 | 0.3 | GO:0046958 | nonassociative learning(GO:0046958) habituation(GO:0046959) |
| 0.0 | 0.1 | GO:0034138 | chemokine production(GO:0032602) toll-like receptor 3 signaling pathway(GO:0034138) |
| 0.0 | 0.2 | GO:1902915 | negative regulation of histone ubiquitination(GO:0033183) regulation of protein K63-linked ubiquitination(GO:1900044) negative regulation of protein K63-linked ubiquitination(GO:1900045) regulation of histone H2A K63-linked ubiquitination(GO:1901314) negative regulation of histone H2A K63-linked ubiquitination(GO:1901315) regulation of protein polyubiquitination(GO:1902914) negative regulation of protein polyubiquitination(GO:1902915) |
| 0.0 | 0.6 | GO:0033173 | calcineurin-NFAT signaling cascade(GO:0033173) |
| 0.0 | 0.1 | GO:0043570 | maintenance of DNA repeat elements(GO:0043570) |
| 0.0 | 0.3 | GO:0030104 | water homeostasis(GO:0030104) |
| 0.0 | 0.5 | GO:0099639 | neurotransmitter receptor transport, endosome to postsynaptic membrane(GO:0098887) endosome to plasma membrane protein transport(GO:0099638) neurotransmitter receptor transport, endosome to plasma membrane(GO:0099639) |
| 0.0 | 0.4 | GO:2000036 | regulation of stem cell population maintenance(GO:2000036) |
| 0.0 | 0.2 | GO:2000042 | negative regulation of double-strand break repair via homologous recombination(GO:2000042) |
| 0.0 | 0.4 | GO:0045670 | regulation of osteoclast differentiation(GO:0045670) |
| 0.0 | 0.2 | GO:0006013 | mannose metabolic process(GO:0006013) |
| 0.0 | 0.2 | GO:2001106 | regulation of guanyl-nucleotide exchange factor activity(GO:1905097) regulation of Rho guanyl-nucleotide exchange factor activity(GO:2001106) |
| 0.0 | 0.7 | GO:0032968 | positive regulation of transcription elongation from RNA polymerase II promoter(GO:0032968) |
| 0.0 | 0.1 | GO:0060876 | semicircular canal formation(GO:0060876) |
| 0.0 | 0.3 | GO:0044528 | regulation of mitochondrial mRNA stability(GO:0044528) |
| 0.0 | 0.3 | GO:0046546 | development of primary male sexual characteristics(GO:0046546) |
| 0.0 | 0.2 | GO:0034975 | protein folding in endoplasmic reticulum(GO:0034975) |
| 0.0 | 0.4 | GO:0007026 | negative regulation of microtubule depolymerization(GO:0007026) negative regulation of microtubule polymerization or depolymerization(GO:0031111) |
| 0.0 | 0.1 | GO:0007008 | outer mitochondrial membrane organization(GO:0007008) protein import into mitochondrial outer membrane(GO:0045040) |
| 0.0 | 0.1 | GO:0051012 | microtubule sliding(GO:0051012) |
| 0.0 | 0.1 | GO:0010032 | meiotic chromosome condensation(GO:0010032) |
| 0.0 | 0.8 | GO:0001757 | somite specification(GO:0001757) |
| 0.0 | 0.1 | GO:2000815 | regulation of mRNA stability involved in response to stress(GO:0010610) regulation of mRNA stability involved in response to oxidative stress(GO:2000815) |
| 0.0 | 0.2 | GO:0046677 | response to antibiotic(GO:0046677) |
| 0.0 | 1.0 | GO:0036297 | interstrand cross-link repair(GO:0036297) |
| 0.0 | 0.5 | GO:0071577 | zinc II ion transmembrane transport(GO:0071577) |
| 0.0 | 0.2 | GO:2000650 | negative regulation of sodium ion transmembrane transporter activity(GO:2000650) |
| 0.0 | 0.1 | GO:0007217 | tachykinin receptor signaling pathway(GO:0007217) |
| 0.0 | 0.1 | GO:0048011 | neurotrophin TRK receptor signaling pathway(GO:0048011) |
| 0.0 | 0.3 | GO:0006611 | protein export from nucleus(GO:0006611) |
| 0.0 | 0.4 | GO:0010765 | positive regulation of sodium ion transport(GO:0010765) positive regulation of sodium ion transmembrane transport(GO:1902307) regulation of potassium ion import(GO:1903286) positive regulation of potassium ion import(GO:1903288) positive regulation of sodium ion transmembrane transporter activity(GO:2000651) |
| 0.0 | 0.3 | GO:0016074 | snoRNA metabolic process(GO:0016074) |
| 0.0 | 0.1 | GO:0051037 | histone displacement(GO:0001207) regulation of transcription involved in meiotic cell cycle(GO:0051037) positive regulation of transcription involved in meiotic cell cycle(GO:0051039) |
| 0.0 | 0.1 | GO:0036149 | phosphatidylinositol acyl-chain remodeling(GO:0036149) |
| 0.0 | 0.2 | GO:0035372 | protein localization to microtubule(GO:0035372) protein localization to microtubule plus-end(GO:1904825) |
| 0.0 | 0.3 | GO:0030241 | skeletal muscle myosin thick filament assembly(GO:0030241) |
| 0.0 | 0.1 | GO:0017185 | peptidyl-lysine hydroxylation(GO:0017185) |
| 0.0 | 0.4 | GO:0000186 | activation of MAPKK activity(GO:0000186) |
| 0.0 | 0.1 | GO:2000001 | regulation of DNA damage checkpoint(GO:2000001) |
| 0.0 | 0.2 | GO:0098957 | anterograde axonal transport of mitochondrion(GO:0098957) |
| 0.0 | 0.2 | GO:0042427 | serotonin biosynthetic process(GO:0042427) primary amino compound biosynthetic process(GO:1901162) |
| 0.0 | 0.3 | GO:0061615 | glucose catabolic process(GO:0006007) NADH regeneration(GO:0006735) glycolytic process through fructose-6-phosphate(GO:0061615) glycolytic process through glucose-6-phosphate(GO:0061620) canonical glycolysis(GO:0061621) glucose catabolic process to pyruvate(GO:0061718) |
| 0.0 | 0.8 | GO:0051014 | actin filament severing(GO:0051014) |
| 0.0 | 0.2 | GO:0001672 | regulation of chromatin assembly or disassembly(GO:0001672) |
| 0.0 | 0.1 | GO:0060784 | regulation of cell proliferation involved in tissue homeostasis(GO:0060784) |
| 0.0 | 0.1 | GO:0000012 | single strand break repair(GO:0000012) |
| 0.0 | 0.5 | GO:0034587 | piRNA metabolic process(GO:0034587) |
| 0.0 | 0.3 | GO:0021707 | cerebellar granular layer development(GO:0021681) cerebellar granular layer morphogenesis(GO:0021683) cerebellar granular layer formation(GO:0021684) cerebellar granule cell differentiation(GO:0021707) |
| 0.0 | 0.1 | GO:0003272 | endocardial cushion formation(GO:0003272) |
| 0.0 | 0.5 | GO:0001522 | pseudouridine synthesis(GO:0001522) |
| 0.0 | 0.2 | GO:0061588 | calcium activated phospholipid scrambling(GO:0061588) |
| 0.0 | 0.8 | GO:0021591 | ventricular system development(GO:0021591) |
| 0.0 | 0.1 | GO:0060339 | negative regulation of type I interferon-mediated signaling pathway(GO:0060339) |
| 0.0 | 0.4 | GO:0030259 | lipid glycosylation(GO:0030259) |
| 0.0 | 0.1 | GO:1990108 | protein linear deubiquitination(GO:1990108) |
| 0.0 | 0.2 | GO:0038007 | netrin-activated signaling pathway(GO:0038007) |
| 0.0 | 0.2 | GO:1990118 | sodium ion import(GO:0097369) sodium ion import across plasma membrane(GO:0098719) sodium ion import into cell(GO:1990118) |
| 0.0 | 0.1 | GO:0051224 | negative regulation of protein transport(GO:0051224) negative regulation of establishment of protein localization(GO:1904950) |
| 0.0 | 0.1 | GO:0030422 | production of siRNA involved in RNA interference(GO:0030422) |
| 0.0 | 0.1 | GO:0090520 | sphingolipid mediated signaling pathway(GO:0090520) |
| 0.0 | 0.3 | GO:0005979 | regulation of glycogen biosynthetic process(GO:0005979) regulation of glucan biosynthetic process(GO:0010962) |
| 0.0 | 0.3 | GO:0031397 | negative regulation of protein ubiquitination(GO:0031397) |
| 0.0 | 0.1 | GO:0071867 | response to monoamine(GO:0071867) response to catecholamine(GO:0071869) response to epinephrine(GO:0071871) |
| 0.0 | 0.1 | GO:0002188 | translation reinitiation(GO:0002188) |
| 0.0 | 0.1 | GO:0021885 | forebrain cell migration(GO:0021885) |
| 0.0 | 0.1 | GO:0018197 | peptidyl-aspartic acid modification(GO:0018197) peptidyl-aspartic acid hydroxylation(GO:0042264) |
| 0.0 | 0.2 | GO:0070935 | 3'-UTR-mediated mRNA stabilization(GO:0070935) |
| 0.0 | 0.4 | GO:0043124 | negative regulation of I-kappaB kinase/NF-kappaB signaling(GO:0043124) |
| 0.0 | 0.4 | GO:0060287 | epithelial cilium movement involved in determination of left/right asymmetry(GO:0060287) |
| 0.0 | 0.1 | GO:0050655 | dermatan sulfate proteoglycan metabolic process(GO:0050655) |
| 0.0 | 0.5 | GO:0007205 | protein kinase C-activating G-protein coupled receptor signaling pathway(GO:0007205) |
| 0.0 | 0.1 | GO:0090527 | actin filament reorganization(GO:0090527) |
| 0.0 | 0.4 | GO:0018149 | peptide cross-linking(GO:0018149) |
| 0.0 | 0.1 | GO:0000492 | box C/D snoRNP assembly(GO:0000492) |
| 0.0 | 0.1 | GO:0042753 | positive regulation of circadian rhythm(GO:0042753) |
| 0.0 | 0.2 | GO:0006607 | NLS-bearing protein import into nucleus(GO:0006607) |
| 0.0 | 0.2 | GO:0090398 | cellular senescence(GO:0090398) |
| 0.0 | 0.7 | GO:0045332 | phospholipid translocation(GO:0045332) |
| 0.0 | 0.5 | GO:0060872 | semicircular canal development(GO:0060872) |
| 0.0 | 0.3 | GO:0098962 | regulation of postsynaptic neurotransmitter receptor activity(GO:0098962) |
| 0.0 | 0.1 | GO:1901166 | neural crest cell migration involved in autonomic nervous system development(GO:1901166) |
| 0.0 | 0.2 | GO:0042407 | cristae formation(GO:0042407) |
| 0.0 | 0.1 | GO:0097033 | respiratory chain complex III assembly(GO:0017062) mitochondrial respiratory chain complex III assembly(GO:0034551) mitochondrial respiratory chain complex III biogenesis(GO:0097033) |
| 0.0 | 1.1 | GO:0016575 | histone deacetylation(GO:0016575) |
| 0.0 | 0.1 | GO:0006015 | 5-phosphoribose 1-diphosphate biosynthetic process(GO:0006015) 5-phosphoribose 1-diphosphate metabolic process(GO:0046391) |
| 0.0 | 0.1 | GO:1900052 | regulation of isoprenoid metabolic process(GO:0019747) regulation of vitamin metabolic process(GO:0030656) regulation of retinoic acid biosynthetic process(GO:1900052) |
| 0.0 | 0.7 | GO:0001878 | response to yeast(GO:0001878) |
| 0.0 | 0.4 | GO:0003351 | epithelial cilium movement(GO:0003351) |
| 0.0 | 0.2 | GO:0022615 | protein import into peroxisome matrix, docking(GO:0016560) protein to membrane docking(GO:0022615) |
| 0.0 | 0.1 | GO:1902592 | virion assembly(GO:0019068) virus maturation(GO:0019075) multi-organism membrane organization(GO:0044803) viral budding(GO:0046755) multi-organism organelle organization(GO:1902590) multi-organism membrane budding(GO:1902592) |
| 0.0 | 0.2 | GO:0008053 | mitochondrial fusion(GO:0008053) |
| 0.0 | 0.2 | GO:0048382 | mesendoderm development(GO:0048382) |
| 0.0 | 0.5 | GO:0000184 | nuclear-transcribed mRNA catabolic process, nonsense-mediated decay(GO:0000184) |
| 0.0 | 0.2 | GO:0009303 | rRNA transcription(GO:0009303) |
| 0.0 | 0.1 | GO:0018343 | protein farnesylation(GO:0018343) |
| 0.0 | 0.1 | GO:0071233 | response to leucine(GO:0043201) cellular response to leucine(GO:0071233) regulation of response to reactive oxygen species(GO:1901031) |
| 0.0 | 0.0 | GO:0042560 | 10-formyltetrahydrofolate metabolic process(GO:0009256) 10-formyltetrahydrofolate catabolic process(GO:0009258) folic acid-containing compound catabolic process(GO:0009397) pteridine-containing compound catabolic process(GO:0042560) |
| 0.0 | 0.1 | GO:0098900 | regulation of action potential(GO:0098900) |
| 0.0 | 0.1 | GO:0070498 | interleukin-1-mediated signaling pathway(GO:0070498) |
| 0.0 | 1.2 | GO:0030048 | actin filament-based movement(GO:0030048) |
| 0.0 | 0.2 | GO:0006767 | water-soluble vitamin metabolic process(GO:0006767) |
| 0.0 | 0.1 | GO:2000273 | positive regulation of epidermal growth factor-activated receptor activity(GO:0045741) positive regulation of receptor activity(GO:2000273) |
| 0.0 | 0.2 | GO:0042989 | sequestering of actin monomers(GO:0042989) |
| 0.0 | 0.7 | GO:0051453 | regulation of intracellular pH(GO:0051453) |
| 0.0 | 0.1 | GO:0040038 | meiotic cytokinesis(GO:0033206) polar body extrusion after meiotic divisions(GO:0040038) |
| 0.0 | 0.4 | GO:0006383 | transcription from RNA polymerase III promoter(GO:0006383) |
| 0.0 | 0.1 | GO:0051013 | microtubule severing(GO:0051013) |
| 0.0 | 0.3 | GO:0015671 | oxygen transport(GO:0015671) |
| 0.0 | 0.1 | GO:1990414 | replication-born double-strand break repair via sister chromatid exchange(GO:1990414) |
| 0.0 | 0.2 | GO:0006382 | adenosine to inosine editing(GO:0006382) |
| 0.0 | 0.3 | GO:0016226 | iron-sulfur cluster assembly(GO:0016226) metallo-sulfur cluster assembly(GO:0031163) |
| 0.0 | 0.1 | GO:0070445 | regulation of oligodendrocyte progenitor proliferation(GO:0070445) |
| 0.0 | 0.3 | GO:0043162 | ubiquitin-dependent protein catabolic process via the multivesicular body sorting pathway(GO:0043162) |
| 0.0 | 0.8 | GO:0043044 | ATP-dependent chromatin remodeling(GO:0043044) |
| 0.0 | 0.0 | GO:0097113 | AMPA glutamate receptor clustering(GO:0097113) glutamate receptor clustering(GO:0097688) |
| 0.0 | 0.1 | GO:2000580 | positive regulation of microtubule motor activity(GO:2000576) regulation of ATP-dependent microtubule motor activity, plus-end-directed(GO:2000580) positive regulation of ATP-dependent microtubule motor activity, plus-end-directed(GO:2000582) |
| 0.0 | 0.0 | GO:0070940 | dephosphorylation of RNA polymerase II C-terminal domain(GO:0070940) |
| 0.0 | 0.1 | GO:0021754 | facial nucleus development(GO:0021754) |
| 0.0 | 0.1 | GO:0043982 | histone H4-K5 acetylation(GO:0043981) histone H4-K8 acetylation(GO:0043982) |
| 0.0 | 0.3 | GO:0098884 | postsynaptic neurotransmitter receptor internalization(GO:0098884) |
| 0.0 | 0.2 | GO:0007172 | signal complex assembly(GO:0007172) |
| 0.0 | 0.3 | GO:0000154 | rRNA modification(GO:0000154) |
| 0.0 | 0.2 | GO:0022011 | myelination in peripheral nervous system(GO:0022011) |
| 0.0 | 0.3 | GO:0048538 | thymus development(GO:0048538) |
| 0.0 | 0.5 | GO:0043488 | regulation of mRNA stability(GO:0043488) |
| 0.0 | 0.2 | GO:0001731 | formation of translation preinitiation complex(GO:0001731) |
| 0.0 | 0.4 | GO:0015012 | heparan sulfate proteoglycan biosynthetic process(GO:0015012) |
| 0.0 | 0.2 | GO:0043507 | activation of JUN kinase activity(GO:0007257) regulation of JUN kinase activity(GO:0043506) positive regulation of JUN kinase activity(GO:0043507) |
| 0.0 | 0.1 | GO:0046323 | glucose import(GO:0046323) |
| 0.0 | 0.2 | GO:0032483 | regulation of Rab protein signal transduction(GO:0032483) |
| 0.0 | 0.1 | GO:0045947 | negative regulation of translational initiation(GO:0045947) |
| 0.0 | 0.8 | GO:0018107 | peptidyl-threonine phosphorylation(GO:0018107) |
| 0.0 | 0.5 | GO:0032924 | activin receptor signaling pathway(GO:0032924) |
| 0.0 | 0.6 | GO:0051091 | positive regulation of sequence-specific DNA binding transcription factor activity(GO:0051091) |
| 0.0 | 0.2 | GO:0061055 | myotome development(GO:0061055) |
| 0.0 | 0.2 | GO:0071108 | protein K48-linked deubiquitination(GO:0071108) |
| 0.0 | 0.5 | GO:0006342 | chromatin silencing(GO:0006342) |
| 0.0 | 0.4 | GO:0000462 | maturation of SSU-rRNA from tricistronic rRNA transcript (SSU-rRNA, 5.8S rRNA, LSU-rRNA)(GO:0000462) |
| 0.0 | 0.1 | GO:0036353 | histone H2A-K119 monoubiquitination(GO:0036353) |
| 0.0 | 0.3 | GO:0060037 | pharyngeal system development(GO:0060037) |
| 0.0 | 0.3 | GO:0051568 | histone H3-K4 methylation(GO:0051568) |
| 0.0 | 0.3 | GO:0001966 | thigmotaxis(GO:0001966) |
| 0.0 | 0.1 | GO:0046457 | prostaglandin biosynthetic process(GO:0001516) prostanoid biosynthetic process(GO:0046457) |
| 0.0 | 0.3 | GO:0034472 | snRNA 3'-end processing(GO:0034472) |
| 0.0 | 0.1 | GO:0002159 | desmosome assembly(GO:0002159) |
| 0.0 | 0.2 | GO:1902254 | negative regulation of intrinsic apoptotic signaling pathway by p53 class mediator(GO:1902254) |
| 0.0 | 0.0 | GO:0045724 | positive regulation of cilium assembly(GO:0045724) |
| 0.0 | 0.0 | GO:2000812 | regulation of barbed-end actin filament capping(GO:2000812) |
| 0.0 | 0.1 | GO:0010165 | response to X-ray(GO:0010165) |
| 0.0 | 0.3 | GO:0099645 | protein localization to postsynaptic specialization membrane(GO:0099633) neurotransmitter receptor localization to postsynaptic specialization membrane(GO:0099645) |
| 0.0 | 0.3 | GO:0033627 | cell adhesion mediated by integrin(GO:0033627) |
| 0.0 | 0.0 | GO:0034219 | carbohydrate transmembrane transport(GO:0034219) |
| 0.0 | 0.1 | GO:0090148 | membrane fission(GO:0090148) |
| 0.0 | 0.4 | GO:0043524 | negative regulation of neuron apoptotic process(GO:0043524) |
| 0.0 | 0.2 | GO:0009649 | entrainment of circadian clock(GO:0009649) entrainment of circadian clock by photoperiod(GO:0043153) |
| 0.0 | 0.2 | GO:0060324 | face development(GO:0060324) |
| 0.0 | 0.2 | GO:0043949 | regulation of protein kinase A signaling(GO:0010738) regulation of cAMP-mediated signaling(GO:0043949) |
| 0.0 | 0.1 | GO:0015862 | uridine transport(GO:0015862) pyrimidine nucleoside transport(GO:0015864) |
| 0.0 | 0.1 | GO:0097324 | melanocyte migration(GO:0097324) |
| 0.0 | 0.1 | GO:0090049 | regulation of cell migration involved in sprouting angiogenesis(GO:0090049) |
| 0.0 | 0.1 | GO:0030431 | sleep(GO:0030431) |
| 0.0 | 0.3 | GO:0006884 | cell volume homeostasis(GO:0006884) |
Gene overrepresentation in cellular component category:
| Log-likelihood per target | Total log-likelihood | Term | Description |
|---|---|---|---|
| 0.3 | 1.3 | GO:0044611 | nuclear pore inner ring(GO:0044611) |
| 0.2 | 0.5 | GO:0097125 | cyclin B1-CDK1 complex(GO:0097125) |
| 0.1 | 0.4 | GO:0035301 | Hedgehog signaling complex(GO:0035301) |
| 0.1 | 1.5 | GO:0031462 | Cul2-RING ubiquitin ligase complex(GO:0031462) |
| 0.1 | 1.5 | GO:1990124 | messenger ribonucleoprotein complex(GO:1990124) |
| 0.1 | 0.5 | GO:1990923 | PET complex(GO:1990923) |
| 0.1 | 0.4 | GO:0098890 | extrinsic component of postsynaptic membrane(GO:0098890) |
| 0.1 | 1.5 | GO:0034992 | microtubule organizing center attachment site(GO:0034992) LINC complex(GO:0034993) |
| 0.1 | 0.2 | GO:0070578 | RISC-loading complex(GO:0070578) |
| 0.1 | 0.3 | GO:0044326 | dendritic spine neck(GO:0044326) dendritic filopodium(GO:1902737) |
| 0.1 | 0.5 | GO:0035060 | brahma complex(GO:0035060) |
| 0.1 | 1.2 | GO:0030127 | COPII vesicle coat(GO:0030127) |
| 0.1 | 0.2 | GO:0098536 | deuterosome(GO:0098536) |
| 0.0 | 0.2 | GO:0008091 | spectrin(GO:0008091) |
| 0.0 | 0.4 | GO:0070937 | CRD-mediated mRNA stability complex(GO:0070937) |
| 0.0 | 0.1 | GO:0034663 | endoplasmic reticulum chaperone complex(GO:0034663) |
| 0.0 | 0.2 | GO:0035327 | transcriptionally active chromatin(GO:0035327) |
| 0.0 | 0.5 | GO:0030015 | CCR4-NOT core complex(GO:0030015) |
| 0.0 | 0.4 | GO:0016580 | Sin3 complex(GO:0016580) |
| 0.0 | 0.3 | GO:0030877 | beta-catenin destruction complex(GO:0030877) |
| 0.0 | 0.4 | GO:0036449 | microtubule minus-end(GO:0036449) |
| 0.0 | 0.5 | GO:0048179 | activin receptor complex(GO:0048179) |
| 0.0 | 0.2 | GO:0071006 | U2-type catalytic step 1 spliceosome(GO:0071006) catalytic step 1 spliceosome(GO:0071012) |
| 0.0 | 0.2 | GO:1902636 | kinociliary basal body(GO:1902636) |
| 0.0 | 0.1 | GO:0008247 | 1-alkyl-2-acetylglycerophosphocholine esterase complex(GO:0008247) |
| 0.0 | 0.2 | GO:0016234 | inclusion body(GO:0016234) |
| 0.0 | 0.2 | GO:0071818 | BAT3 complex(GO:0071818) |
| 0.0 | 0.1 | GO:0032584 | growth cone membrane(GO:0032584) |
| 0.0 | 0.2 | GO:0005674 | transcription factor TFIIF complex(GO:0005674) |
| 0.0 | 0.2 | GO:0031313 | extrinsic component of endosome membrane(GO:0031313) |
| 0.0 | 0.1 | GO:0033063 | Rad51B-Rad51C-Rad51D-XRCC2 complex(GO:0033063) |
| 0.0 | 0.3 | GO:0005945 | 6-phosphofructokinase complex(GO:0005945) |
| 0.0 | 1.8 | GO:0031902 | late endosome membrane(GO:0031902) |
| 0.0 | 0.1 | GO:0097255 | R2TP complex(GO:0097255) |
| 0.0 | 0.5 | GO:1990907 | beta-catenin-TCF complex(GO:1990907) |
| 0.0 | 0.1 | GO:0060171 | stereocilium membrane(GO:0060171) |
| 0.0 | 0.1 | GO:0032301 | MutSalpha complex(GO:0032301) |
| 0.0 | 0.4 | GO:0005666 | DNA-directed RNA polymerase III complex(GO:0005666) |
| 0.0 | 1.4 | GO:0032580 | Golgi cisterna membrane(GO:0032580) |
| 0.0 | 0.4 | GO:0043209 | myelin sheath(GO:0043209) |
| 0.0 | 0.3 | GO:0000940 | condensed chromosome outer kinetochore(GO:0000940) |
| 0.0 | 0.2 | GO:0030014 | CCR4-NOT complex(GO:0030014) |
| 0.0 | 0.1 | GO:0005673 | transcription factor TFIIE complex(GO:0005673) |
| 0.0 | 0.2 | GO:0005640 | nuclear outer membrane(GO:0005640) |
| 0.0 | 0.2 | GO:0005665 | DNA-directed RNA polymerase II, core complex(GO:0005665) |
| 0.0 | 0.2 | GO:0001669 | acrosomal vesicle(GO:0001669) |
| 0.0 | 0.6 | GO:0080008 | Cul4-RING E3 ubiquitin ligase complex(GO:0080008) |
| 0.0 | 0.2 | GO:0035101 | FACT complex(GO:0035101) |
| 0.0 | 0.3 | GO:0070187 | telosome(GO:0070187) |
| 0.0 | 0.9 | GO:0005778 | peroxisomal membrane(GO:0005778) microbody membrane(GO:0031903) |
| 0.0 | 0.5 | GO:0016010 | dystrophin-associated glycoprotein complex(GO:0016010) glycoprotein complex(GO:0090665) |
| 0.0 | 0.1 | GO:0034990 | nuclear cohesin complex(GO:0000798) mitotic cohesin complex(GO:0030892) nuclear mitotic cohesin complex(GO:0034990) nuclear meiotic cohesin complex(GO:0034991) |
| 0.0 | 0.1 | GO:0034388 | Pwp2p-containing subcomplex of 90S preribosome(GO:0034388) |
| 0.0 | 0.4 | GO:0045180 | basal cortex(GO:0045180) |
| 0.0 | 0.2 | GO:0005952 | cAMP-dependent protein kinase complex(GO:0005952) |
| 0.0 | 0.1 | GO:0002189 | ribose phosphate diphosphokinase complex(GO:0002189) |
| 0.0 | 0.3 | GO:0000164 | protein phosphatase type 1 complex(GO:0000164) |
| 0.0 | 0.3 | GO:0034751 | aryl hydrocarbon receptor complex(GO:0034751) |
| 0.0 | 0.1 | GO:0000813 | ESCRT I complex(GO:0000813) |
| 0.0 | 0.3 | GO:0015030 | Cajal body(GO:0015030) |
| 0.0 | 0.1 | GO:0005965 | protein farnesyltransferase complex(GO:0005965) |
| 0.0 | 0.2 | GO:0005697 | telomerase holoenzyme complex(GO:0005697) |
| 0.0 | 0.4 | GO:0005902 | microvillus(GO:0005902) |
| 0.0 | 0.3 | GO:0000795 | synaptonemal complex(GO:0000795) |
| 0.0 | 1.5 | GO:0055037 | recycling endosome(GO:0055037) |
| 0.0 | 0.2 | GO:0060170 | ciliary membrane(GO:0060170) |
| 0.0 | 0.9 | GO:0000932 | cytoplasmic mRNA processing body(GO:0000932) |
| 0.0 | 0.1 | GO:0019908 | cyclin/CDK positive transcription elongation factor complex(GO:0008024) nuclear cyclin-dependent protein kinase holoenzyme complex(GO:0019908) |
| 0.0 | 0.1 | GO:0061700 | GATOR2 complex(GO:0061700) |
| 0.0 | 0.1 | GO:0001650 | fibrillar center(GO:0001650) |
| 0.0 | 0.3 | GO:0035102 | PRC1 complex(GO:0035102) |
| 0.0 | 0.1 | GO:0000445 | THO complex(GO:0000347) THO complex part of transcription export complex(GO:0000445) |
| 0.0 | 1.7 | GO:0016459 | myosin complex(GO:0016459) |
| 0.0 | 0.3 | GO:0098844 | postsynaptic endocytic zone membrane(GO:0098844) |
| 0.0 | 0.1 | GO:0031526 | brush border membrane(GO:0031526) |
| 0.0 | 0.2 | GO:0071339 | MLL1/2 complex(GO:0044665) MLL1 complex(GO:0071339) |
| 0.0 | 0.1 | GO:0043240 | Fanconi anaemia nuclear complex(GO:0043240) |
| 0.0 | 3.8 | GO:0000785 | chromatin(GO:0000785) |
| 0.0 | 1.4 | GO:0005769 | early endosome(GO:0005769) |
| 0.0 | 0.2 | GO:1902562 | NuA4 histone acetyltransferase complex(GO:0035267) H4/H2A histone acetyltransferase complex(GO:0043189) H4 histone acetyltransferase complex(GO:1902562) |
| 0.0 | 0.3 | GO:0032039 | integrator complex(GO:0032039) |
| 0.0 | 0.6 | GO:0098839 | postsynaptic density membrane(GO:0098839) postsynaptic specialization membrane(GO:0099634) |
| 0.0 | 0.2 | GO:0035371 | microtubule plus-end(GO:0035371) |
| 0.0 | 0.1 | GO:0001401 | mitochondrial sorting and assembly machinery complex(GO:0001401) |
| 0.0 | 0.5 | GO:0001750 | photoreceptor outer segment(GO:0001750) |
| 0.0 | 0.2 | GO:0001917 | photoreceptor inner segment(GO:0001917) |
| 0.0 | 0.2 | GO:0030867 | rough endoplasmic reticulum membrane(GO:0030867) |
| 0.0 | 0.8 | GO:0000922 | spindle pole(GO:0000922) |
Gene overrepresentation in molecular function category:
| Log-likelihood per target | Total log-likelihood | Term | Description |
|---|---|---|---|
| 0.3 | 3.4 | GO:0035804 | structural constituent of egg coat(GO:0035804) |
| 0.3 | 0.8 | GO:0008401 | retinoic acid 4-hydroxylase activity(GO:0008401) |
| 0.2 | 0.7 | GO:0008386 | cholesterol monooxygenase (side-chain-cleaving) activity(GO:0008386) oxidoreductase activity, acting on paired donors, with incorporation or reduction of molecular oxygen, reduced iron-sulfur protein as one donor, and incorporation of one atom of oxygen(GO:0016713) |
| 0.2 | 0.7 | GO:0045145 | single-stranded DNA 5'-3' exodeoxyribonuclease activity(GO:0045145) |
| 0.2 | 1.7 | GO:0001217 | bacterial-type RNA polymerase transcription factor activity, sequence-specific DNA binding(GO:0001130) bacterial-type RNA polymerase transcriptional repressor activity, sequence-specific DNA binding(GO:0001217) |
| 0.2 | 0.9 | GO:0060182 | apelin receptor activity(GO:0060182) |
| 0.1 | 0.9 | GO:0010859 | calcium-dependent cysteine-type endopeptidase inhibitor activity(GO:0010859) |
| 0.1 | 0.2 | GO:0070883 | pre-miRNA binding(GO:0070883) |
| 0.1 | 0.4 | GO:0071253 | connexin binding(GO:0071253) |
| 0.1 | 0.4 | GO:0050508 | glucuronosyl-N-acetylglucosaminyl-proteoglycan 4-alpha-N-acetylglucosaminyltransferase activity(GO:0050508) |
| 0.1 | 0.3 | GO:1990174 | phosphodiesterase decapping endonuclease activity(GO:1990174) |
| 0.1 | 0.4 | GO:0035575 | histone demethylase activity (H4-K20 specific)(GO:0035575) |
| 0.1 | 1.6 | GO:0000900 | translation repressor activity, nucleic acid binding(GO:0000900) |
| 0.1 | 1.2 | GO:0047631 | ADP-ribose diphosphatase activity(GO:0047631) |
| 0.1 | 0.9 | GO:0070700 | BMP receptor binding(GO:0070700) |
| 0.1 | 0.9 | GO:0030296 | protein tyrosine kinase activator activity(GO:0030296) |
| 0.1 | 0.3 | GO:0031151 | histone methyltransferase activity (H3-K79 specific)(GO:0031151) |
| 0.1 | 0.2 | GO:0031701 | angiotensin receptor binding(GO:0031701) |
| 0.1 | 0.6 | GO:0031826 | type 2A serotonin receptor binding(GO:0031826) |
| 0.1 | 0.2 | GO:0031752 | D5 dopamine receptor binding(GO:0031752) |
| 0.1 | 0.6 | GO:0035198 | miRNA binding(GO:0035198) |
| 0.1 | 0.3 | GO:0004408 | holocytochrome-c synthase activity(GO:0004408) |
| 0.1 | 0.2 | GO:0016922 | ligand-dependent nuclear receptor binding(GO:0016922) |
| 0.1 | 0.2 | GO:0017050 | D-erythro-sphingosine kinase activity(GO:0017050) |
| 0.1 | 0.5 | GO:0047238 | glucuronosyl-N-acetylgalactosaminyl-proteoglycan 4-beta-N-acetylgalactosaminyltransferase activity(GO:0047238) |
| 0.1 | 0.7 | GO:0016413 | O-acetyltransferase activity(GO:0016413) |
| 0.1 | 0.4 | GO:0048027 | mRNA 5'-UTR binding(GO:0048027) |
| 0.1 | 0.3 | GO:0030169 | low-density lipoprotein particle binding(GO:0030169) |
| 0.0 | 0.2 | GO:0004679 | AMP-activated protein kinase activity(GO:0004679) |
| 0.0 | 0.2 | GO:0001096 | TFIIF-class transcription factor binding(GO:0001096) |
| 0.0 | 0.1 | GO:0031835 | neurokinin receptor binding(GO:0031834) substance P receptor binding(GO:0031835) |
| 0.0 | 0.4 | GO:0072518 | Rho-dependent protein serine/threonine kinase activity(GO:0072518) |
| 0.0 | 1.3 | GO:0017056 | structural constituent of nuclear pore(GO:0017056) |
| 0.0 | 0.6 | GO:0005158 | insulin receptor binding(GO:0005158) |
| 0.0 | 0.3 | GO:0098809 | nitrite reductase activity(GO:0098809) |
| 0.0 | 0.5 | GO:0004957 | prostaglandin E receptor activity(GO:0004957) |
| 0.0 | 0.2 | GO:0003827 | alpha-1,3-mannosylglycoprotein 2-beta-N-acetylglucosaminyltransferase activity(GO:0003827) |
| 0.0 | 0.3 | GO:0005384 | manganese ion transmembrane transporter activity(GO:0005384) |
| 0.0 | 0.7 | GO:0019869 | chloride channel inhibitor activity(GO:0019869) potassium channel inhibitor activity(GO:0019870) |
| 0.0 | 0.2 | GO:0000033 | alpha-1,3-mannosyltransferase activity(GO:0000033) |
| 0.0 | 0.2 | GO:0004741 | [pyruvate dehydrogenase (lipoamide)] phosphatase activity(GO:0004741) |
| 0.0 | 0.2 | GO:0071074 | eukaryotic initiation factor eIF2 binding(GO:0071074) |
| 0.0 | 1.0 | GO:0015299 | solute:proton antiporter activity(GO:0015299) |
| 0.0 | 0.4 | GO:0050700 | CARD domain binding(GO:0050700) |
| 0.0 | 0.2 | GO:0016842 | amidine-lyase activity(GO:0016842) |
| 0.0 | 0.2 | GO:0001735 | prenylcysteine oxidase activity(GO:0001735) |
| 0.0 | 0.3 | GO:0017070 | U6 snRNA binding(GO:0017070) |
| 0.0 | 0.4 | GO:0004586 | ornithine decarboxylase activity(GO:0004586) |
| 0.0 | 0.2 | GO:0015616 | DNA translocase activity(GO:0015616) |
| 0.0 | 0.1 | GO:0043621 | protein self-association(GO:0043621) |
| 0.0 | 0.3 | GO:0098505 | G-rich strand telomeric DNA binding(GO:0098505) |
| 0.0 | 0.2 | GO:0003987 | acetate-CoA ligase activity(GO:0003987) |
| 0.0 | 0.2 | GO:0070644 | vitamin D response element binding(GO:0070644) |
| 0.0 | 0.1 | GO:0051500 | D-aminoacyl-tRNA deacylase activity(GO:0051499) D-tyrosyl-tRNA(Tyr) deacylase activity(GO:0051500) |
| 0.0 | 0.3 | GO:0003835 | beta-galactoside alpha-2,6-sialyltransferase activity(GO:0003835) |
| 0.0 | 0.4 | GO:0005049 | nuclear export signal receptor activity(GO:0005049) |
| 0.0 | 0.1 | GO:0070815 | peptidyl-lysine 5-dioxygenase activity(GO:0070815) |
| 0.0 | 0.2 | GO:0016361 | activin receptor activity, type I(GO:0016361) |
| 0.0 | 0.2 | GO:0004430 | 1-phosphatidylinositol 4-kinase activity(GO:0004430) |
| 0.0 | 0.2 | GO:0008118 | N-acetyllactosaminide alpha-2,3-sialyltransferase activity(GO:0008118) |
| 0.0 | 0.7 | GO:0036002 | pre-mRNA binding(GO:0036002) |
| 0.0 | 0.4 | GO:0043325 | phosphatidylinositol-3,4-bisphosphate binding(GO:0043325) |
| 0.0 | 0.3 | GO:0070137 | ubiquitin-like protein-specific endopeptidase activity(GO:0070137) SUMO-specific endopeptidase activity(GO:0070139) |
| 0.0 | 0.9 | GO:0048306 | calcium-dependent protein binding(GO:0048306) |
| 0.0 | 0.2 | GO:0004510 | tryptophan 5-monooxygenase activity(GO:0004510) |
| 0.0 | 0.8 | GO:0015248 | sterol transporter activity(GO:0015248) |
| 0.0 | 0.3 | GO:0035259 | glucocorticoid receptor binding(GO:0035259) |
| 0.0 | 0.2 | GO:0019871 | sodium channel inhibitor activity(GO:0019871) |
| 0.0 | 0.3 | GO:0017002 | activin-activated receptor activity(GO:0017002) |
| 0.0 | 0.3 | GO:0000774 | adenyl-nucleotide exchange factor activity(GO:0000774) |
| 0.0 | 0.2 | GO:0080019 | fatty-acyl-CoA reductase (alcohol-forming) activity(GO:0080019) |
| 0.0 | 0.7 | GO:0001103 | RNA polymerase II repressing transcription factor binding(GO:0001103) |
| 0.0 | 0.2 | GO:0099530 | G-protein coupled receptor activity involved in regulation of postsynaptic membrane potential(GO:0099530) |
| 0.0 | 0.5 | GO:0009982 | pseudouridine synthase activity(GO:0009982) |
| 0.0 | 0.4 | GO:0070840 | dynein complex binding(GO:0070840) |
| 0.0 | 0.3 | GO:0005220 | inositol 1,4,5-trisphosphate-sensitive calcium-release channel activity(GO:0005220) |
| 0.0 | 0.3 | GO:0043495 | protein anchor(GO:0043495) |
| 0.0 | 0.4 | GO:0030507 | spectrin binding(GO:0030507) |
| 0.0 | 0.4 | GO:0031386 | protein tag(GO:0031386) |
| 0.0 | 0.1 | GO:0004597 | peptide-aspartate beta-dioxygenase activity(GO:0004597) |
| 0.0 | 0.1 | GO:0001588 | dopamine neurotransmitter receptor activity, coupled via Gs(GO:0001588) |
| 0.0 | 0.2 | GO:0016530 | metallochaperone activity(GO:0016530) |
| 0.0 | 0.1 | GO:0050220 | prostaglandin-E synthase activity(GO:0050220) |
| 0.0 | 0.2 | GO:0031419 | cobalamin binding(GO:0031419) |
| 0.0 | 0.3 | GO:0001965 | G-protein alpha-subunit binding(GO:0001965) |
| 0.0 | 0.9 | GO:0003951 | NAD+ kinase activity(GO:0003951) |
| 0.0 | 0.1 | GO:0016427 | tRNA (cytosine) methyltransferase activity(GO:0016427) |
| 0.0 | 0.3 | GO:0003872 | 6-phosphofructokinase activity(GO:0003872) |
| 0.0 | 0.2 | GO:0001222 | transcription corepressor binding(GO:0001222) |
| 0.0 | 0.3 | GO:0004687 | myosin light chain kinase activity(GO:0004687) |
| 0.0 | 0.4 | GO:0042813 | Wnt-activated receptor activity(GO:0042813) |
| 0.0 | 0.4 | GO:0051721 | protein phosphatase 2A binding(GO:0051721) |
| 0.0 | 0.4 | GO:0008242 | omega peptidase activity(GO:0008242) |
| 0.0 | 0.2 | GO:0030331 | estrogen receptor binding(GO:0030331) retinoic acid receptor binding(GO:0042974) |
| 0.0 | 0.2 | GO:0005042 | netrin receptor activity(GO:0005042) |
| 0.0 | 1.0 | GO:0019957 | C-C chemokine binding(GO:0019957) |
| 0.0 | 0.1 | GO:0032356 | guanine/thymine mispair binding(GO:0032137) single base insertion or deletion binding(GO:0032138) single thymine insertion binding(GO:0032143) oxidized DNA binding(GO:0032356) oxidized purine DNA binding(GO:0032357) mismatch repair complex binding(GO:0032404) MutLalpha complex binding(GO:0032405) |
| 0.0 | 0.3 | GO:0008139 | nuclear localization sequence binding(GO:0008139) |
| 0.0 | 0.2 | GO:0008603 | cAMP-dependent protein kinase regulator activity(GO:0008603) |
| 0.0 | 0.2 | GO:0070034 | telomerase RNA binding(GO:0070034) |
| 0.0 | 0.2 | GO:0016405 | CoA-ligase activity(GO:0016405) |
| 0.0 | 0.1 | GO:0033842 | N-acetyl-beta-glucosaminyl-glycoprotein 4-beta-N-acetylgalactosaminyltransferase activity(GO:0033842) |
| 0.0 | 0.2 | GO:0005052 | peroxisome matrix targeting signal-1 binding(GO:0005052) |
| 0.0 | 0.7 | GO:0030374 | ligand-dependent nuclear receptor transcription coactivator activity(GO:0030374) |
| 0.0 | 0.1 | GO:1902945 | metalloendopeptidase activity involved in amyloid precursor protein catabolic process(GO:1902945) |
| 0.0 | 0.5 | GO:0005385 | zinc ion transmembrane transporter activity(GO:0005385) |
| 0.0 | 0.1 | GO:0008459 | chondroitin 6-sulfotransferase activity(GO:0008459) |
| 0.0 | 0.1 | GO:0005093 | Rab GDP-dissociation inhibitor activity(GO:0005093) |
| 0.0 | 0.2 | GO:0005229 | intracellular calcium activated chloride channel activity(GO:0005229) |
| 0.0 | 0.3 | GO:2001069 | glycogen binding(GO:2001069) |
| 0.0 | 0.4 | GO:0003810 | protein-glutamine gamma-glutamyltransferase activity(GO:0003810) |
| 0.0 | 0.5 | GO:0005388 | calcium-transporting ATPase activity(GO:0005388) |
| 0.0 | 0.1 | GO:0004362 | glutathione-disulfide reductase activity(GO:0004362) |
| 0.0 | 0.1 | GO:0000400 | four-way junction DNA binding(GO:0000400) |
| 0.0 | 0.0 | GO:0044183 | protein binding involved in protein folding(GO:0044183) |
| 0.0 | 0.1 | GO:0008190 | eukaryotic initiation factor 4E binding(GO:0008190) |
| 0.0 | 0.1 | GO:0036042 | long-chain fatty acyl-CoA binding(GO:0036042) |
| 0.0 | 0.2 | GO:0051879 | Hsp90 protein binding(GO:0051879) |
| 0.0 | 0.5 | GO:0004089 | carbonate dehydratase activity(GO:0004089) |
| 0.0 | 0.1 | GO:0035173 | histone kinase activity(GO:0035173) |
| 0.0 | 0.1 | GO:0071889 | 14-3-3 protein binding(GO:0071889) |
| 0.0 | 0.1 | GO:0004749 | ribose phosphate diphosphokinase activity(GO:0004749) |
| 0.0 | 0.3 | GO:0016878 | acid-thiol ligase activity(GO:0016878) |
| 0.0 | 0.2 | GO:0008568 | microtubule-severing ATPase activity(GO:0008568) |
| 0.0 | 0.1 | GO:0008597 | calcium-dependent protein serine/threonine phosphatase regulator activity(GO:0008597) |
| 0.0 | 0.3 | GO:0019911 | structural constituent of myelin sheath(GO:0019911) |
| 0.0 | 0.3 | GO:0070530 | K63-linked polyubiquitin binding(GO:0070530) |
| 0.0 | 0.2 | GO:0005537 | mannose binding(GO:0005537) |
| 0.0 | 0.3 | GO:0050291 | sphingosine N-acyltransferase activity(GO:0050291) |
| 0.0 | 0.1 | GO:0004660 | protein farnesyltransferase activity(GO:0004660) |
| 0.0 | 0.1 | GO:0070728 | leucine binding(GO:0070728) |
| 0.0 | 0.0 | GO:0016155 | formyltetrahydrofolate dehydrogenase activity(GO:0016155) |
| 0.0 | 0.3 | GO:0017069 | snRNA binding(GO:0017069) |
| 0.0 | 0.2 | GO:0016909 | JUN kinase activity(GO:0004705) SAP kinase activity(GO:0016909) |
| 0.0 | 0.3 | GO:0003785 | actin monomer binding(GO:0003785) |
| 0.0 | 0.0 | GO:0000996 | core DNA-dependent RNA polymerase binding promoter specificity activity(GO:0000996) mitochondrial RNA polymerase binding promoter specificity activity(GO:0034246) |
| 0.0 | 0.1 | GO:0008093 | cytoskeletal adaptor activity(GO:0008093) |
| 0.0 | 0.3 | GO:0004709 | MAP kinase kinase kinase activity(GO:0004709) |
| 0.0 | 0.2 | GO:0016864 | protein disulfide isomerase activity(GO:0003756) intramolecular oxidoreductase activity, transposing S-S bonds(GO:0016864) |
| 0.0 | 0.2 | GO:0003726 | double-stranded RNA adenosine deaminase activity(GO:0003726) |
| 0.0 | 0.8 | GO:0000146 | microfilament motor activity(GO:0000146) |
| 0.0 | 0.4 | GO:0008378 | galactosyltransferase activity(GO:0008378) |
| 0.0 | 0.5 | GO:0042287 | MHC protein binding(GO:0042287) |
| 0.0 | 0.4 | GO:0051787 | misfolded protein binding(GO:0051787) |
| 0.0 | 0.7 | GO:0031491 | nucleosome binding(GO:0031491) |
| 0.0 | 0.1 | GO:0030332 | cyclin binding(GO:0030332) |
| 0.0 | 0.2 | GO:0016783 | sulfurtransferase activity(GO:0016783) |
| 0.0 | 0.1 | GO:0004046 | aminoacylase activity(GO:0004046) |
| 0.0 | 0.4 | GO:0051010 | microtubule plus-end binding(GO:0051010) |
| 0.0 | 0.5 | GO:0004712 | protein serine/threonine/tyrosine kinase activity(GO:0004712) |
| 0.0 | 0.1 | GO:0099602 | acetylcholine receptor regulator activity(GO:0030548) neurotransmitter receptor regulator activity(GO:0099602) |
| 0.0 | 0.1 | GO:0050694 | galactosylceramide sulfotransferase activity(GO:0001733) galactose 3-O-sulfotransferase activity(GO:0050694) |
| 0.0 | 0.1 | GO:0003841 | 1-acylglycerol-3-phosphate O-acyltransferase activity(GO:0003841) |
| 0.0 | 0.3 | GO:0042800 | histone methyltransferase activity (H3-K4 specific)(GO:0042800) |
| 0.0 | 1.0 | GO:0001227 | transcriptional repressor activity, RNA polymerase II transcription regulatory region sequence-specific binding(GO:0001227) |
| 0.0 | 0.2 | GO:0036312 | phosphatidylinositol 3-kinase regulatory subunit binding(GO:0036312) |
| 0.0 | 0.4 | GO:0030145 | manganese ion binding(GO:0030145) |
| 0.0 | 0.2 | GO:0097199 | cysteine-type endopeptidase activity involved in apoptotic signaling pathway(GO:0097199) |
| 0.0 | 0.1 | GO:0042285 | xylosyltransferase activity(GO:0042285) |
| 0.0 | 0.2 | GO:0004659 | prenyltransferase activity(GO:0004659) |
| 0.0 | 0.2 | GO:0050321 | tau-protein kinase activity(GO:0050321) |
| 0.0 | 0.3 | GO:0015377 | cation:chloride symporter activity(GO:0015377) potassium:chloride symporter activity(GO:0015379) |
| 0.0 | 0.1 | GO:0061665 | SUMO ligase activity(GO:0061665) |
| 0.0 | 0.3 | GO:0004707 | MAP kinase activity(GO:0004707) |
| 0.0 | 0.2 | GO:0008301 | DNA binding, bending(GO:0008301) |
| 0.0 | 0.2 | GO:0035497 | cAMP response element binding(GO:0035497) |
| 0.0 | 0.0 | GO:0004345 | glucose-6-phosphate dehydrogenase activity(GO:0004345) |
Gene overrepresentation in curated gene sets: canonical pathways category:
| Log-likelihood per target | Total log-likelihood | Term | Description |
|---|---|---|---|
| 0.1 | 1.0 | PID ERBB NETWORK PATHWAY | ErbB receptor signaling network |
| 0.0 | 0.2 | ST INTERFERON GAMMA PATHWAY | Interferon gamma pathway. |
| 0.0 | 0.5 | PID ECADHERIN KERATINOCYTE PATHWAY | E-cadherin signaling in keratinocytes |
| 0.0 | 0.4 | PID WNT CANONICAL PATHWAY | Canonical Wnt signaling pathway |
| 0.0 | 1.9 | PID FAK PATHWAY | Signaling events mediated by focal adhesion kinase |
| 0.0 | 0.5 | PID INTEGRIN4 PATHWAY | Alpha6 beta4 integrin-ligand interactions |
| 0.0 | 2.5 | PID TGFBR PATHWAY | TGF-beta receptor signaling |
| 0.0 | 0.9 | PID HDAC CLASSIII PATHWAY | Signaling events mediated by HDAC Class III |
| 0.0 | 0.5 | PID NETRIN PATHWAY | Netrin-mediated signaling events |
| 0.0 | 0.2 | PID ERBB4 PATHWAY | ErbB4 signaling events |
| 0.0 | 1.0 | PID MTOR 4PATHWAY | mTOR signaling pathway |
| 0.0 | 0.2 | PID HDAC CLASSII PATHWAY | Signaling events mediated by HDAC Class II |
| 0.0 | 0.7 | PID FOXO PATHWAY | FoxO family signaling |
| 0.0 | 0.5 | PID ERBB2 ERBB3 PATHWAY | ErbB2/ErbB3 signaling events |
| 0.0 | 0.2 | SA G2 AND M PHASES | Cdc25 activates the cdc2/cyclin B complex to induce the G2/M transition. |
| 0.0 | 1.3 | PID SMAD2 3NUCLEAR PATHWAY | Regulation of nuclear SMAD2/3 signaling |
| 0.0 | 0.4 | PID NFKAPPAB CANONICAL PATHWAY | Canonical NF-kappaB pathway |
| 0.0 | 0.5 | PID RHOA REG PATHWAY | Regulation of RhoA activity |
| 0.0 | 0.5 | PID CDC42 REG PATHWAY | Regulation of CDC42 activity |
| 0.0 | 0.3 | PID NCADHERIN PATHWAY | N-cadherin signaling events |
| 0.0 | 0.9 | PID P73PATHWAY | p73 transcription factor network |
| 0.0 | 0.4 | PID ECADHERIN STABILIZATION PATHWAY | Stabilization and expansion of the E-cadherin adherens junction |
| 0.0 | 0.1 | PID IGF1 PATHWAY | IGF1 pathway |
| 0.0 | 0.4 | PID AR TF PATHWAY | Regulation of Androgen receptor activity |
| 0.0 | 0.2 | PID RAC1 REG PATHWAY | Regulation of RAC1 activity |
| 0.0 | 0.7 | PID AR PATHWAY | Coregulation of Androgen receptor activity |
| 0.0 | 0.2 | PID UPA UPAR PATHWAY | Urokinase-type plasminogen activator (uPA) and uPAR-mediated signaling |
| 0.0 | 0.2 | PID ARF6 PATHWAY | Arf6 signaling events |
| 0.0 | 0.2 | PID TAP63 PATHWAY | Validated transcriptional targets of TAp63 isoforms |
| 0.0 | 0.1 | PID IL2 STAT5 PATHWAY | IL2 signaling events mediated by STAT5 |
| 0.0 | 0.1 | ST ERK1 ERK2 MAPK PATHWAY | ERK1/ERK2 MAPK Pathway |
Gene overrepresentation in curated gene sets: REACTOME pathways category:
| Log-likelihood per target | Total log-likelihood | Term | Description |
|---|---|---|---|
| 0.1 | 1.2 | REACTOME SIGNALING BY NODAL | Genes involved in Signaling by NODAL |
| 0.1 | 0.9 | REACTOME ACYL CHAIN REMODELLING OF PG | Genes involved in Acyl chain remodelling of PG |
| 0.1 | 0.3 | REACTOME TGF BETA RECEPTOR SIGNALING IN EMT EPITHELIAL TO MESENCHYMAL TRANSITION | Genes involved in TGF-beta receptor signaling in EMT (epithelial to mesenchymal transition) |
| 0.1 | 1.1 | REACTOME DOWNREGULATION OF ERBB2 ERBB3 SIGNALING | Genes involved in Downregulation of ERBB2:ERBB3 signaling |
| 0.1 | 0.2 | REACTOME ROLE OF SECOND MESSENGERS IN NETRIN1 SIGNALING | Genes involved in Role of second messengers in netrin-1 signaling |
| 0.1 | 0.5 | REACTOME ENDOGENOUS STEROLS | Genes involved in Endogenous sterols |
| 0.1 | 0.7 | REACTOME REVERSIBLE HYDRATION OF CARBON DIOXIDE | Genes involved in Reversible Hydration of Carbon Dioxide |
| 0.1 | 1.1 | REACTOME ANTIGEN PRESENTATION FOLDING ASSEMBLY AND PEPTIDE LOADING OF CLASS I MHC | Genes involved in Antigen Presentation: Folding, assembly and peptide loading of class I MHC |
| 0.0 | 0.6 | REACTOME G2 M DNA DAMAGE CHECKPOINT | Genes involved in G2/M DNA damage checkpoint |
| 0.0 | 0.3 | REACTOME CD28 DEPENDENT VAV1 PATHWAY | Genes involved in CD28 dependent Vav1 pathway |
| 0.0 | 0.9 | REACTOME PEROXISOMAL LIPID METABOLISM | Genes involved in Peroxisomal lipid metabolism |
| 0.0 | 1.1 | REACTOME ELONGATION ARREST AND RECOVERY | Genes involved in Elongation arrest and recovery |
| 0.0 | 0.4 | REACTOME P75NTR RECRUITS SIGNALLING COMPLEXES | Genes involved in p75NTR recruits signalling complexes |
| 0.0 | 1.4 | REACTOME TRANSPORT OF RIBONUCLEOPROTEINS INTO THE HOST NUCLEUS | Genes involved in Transport of Ribonucleoproteins into the Host Nucleus |
| 0.0 | 0.5 | REACTOME METABOLISM OF POLYAMINES | Genes involved in Metabolism of polyamines |
| 0.0 | 0.2 | REACTOME REGULATION OF WATER BALANCE BY RENAL AQUAPORINS | Genes involved in Regulation of Water Balance by Renal Aquaporins |
| 0.0 | 0.5 | REACTOME CYTOCHROME P450 ARRANGED BY SUBSTRATE TYPE | Genes involved in Cytochrome P450 - arranged by substrate type |
| 0.0 | 0.2 | REACTOME MICRORNA MIRNA BIOGENESIS | Genes involved in MicroRNA (miRNA) Biogenesis |
| 0.0 | 0.4 | REACTOME SYNTHESIS OF PE | Genes involved in Synthesis of PE |
| 0.0 | 0.1 | REACTOME CYTOSOLIC SULFONATION OF SMALL MOLECULES | Genes involved in Cytosolic sulfonation of small molecules |
| 0.0 | 0.5 | REACTOME SEMA4D IN SEMAPHORIN SIGNALING | Genes involved in Sema4D in semaphorin signaling |
| 0.0 | 0.3 | REACTOME HDL MEDIATED LIPID TRANSPORT | Genes involved in HDL-mediated lipid transport |
| 0.0 | 1.4 | REACTOME ION TRANSPORT BY P TYPE ATPASES | Genes involved in Ion transport by P-type ATPases |
| 0.0 | 0.2 | REACTOME GROWTH HORMONE RECEPTOR SIGNALING | Genes involved in Growth hormone receptor signaling |
| 0.0 | 0.6 | REACTOME ANTIVIRAL MECHANISM BY IFN STIMULATED GENES | Genes involved in Antiviral mechanism by IFN-stimulated genes |
| 0.0 | 0.3 | REACTOME REGULATION OF PYRUVATE DEHYDROGENASE PDH COMPLEX | Genes involved in Regulation of pyruvate dehydrogenase (PDH) complex |
| 0.0 | 0.4 | REACTOME SIGNALING BY HIPPO | Genes involved in Signaling by Hippo |
| 0.0 | 0.3 | REACTOME ZINC TRANSPORTERS | Genes involved in Zinc transporters |
| 0.0 | 0.0 | REACTOME TRANSLOCATION OF ZAP 70 TO IMMUNOLOGICAL SYNAPSE | Genes involved in Translocation of ZAP-70 to Immunological synapse |
| 0.0 | 0.3 | REACTOME TRAF6 MEDIATED INDUCTION OF TAK1 COMPLEX | Genes involved in TRAF6 mediated induction of TAK1 complex |
| 0.0 | 0.2 | REACTOME NEPHRIN INTERACTIONS | Genes involved in Nephrin interactions |
| 0.0 | 0.1 | REACTOME NEGATIVE REGULATION OF THE PI3K AKT NETWORK | Genes involved in Negative regulation of the PI3K/AKT network |
| 0.0 | 0.3 | REACTOME OTHER SEMAPHORIN INTERACTIONS | Genes involved in Other semaphorin interactions |
| 0.0 | 0.4 | REACTOME KINESINS | Genes involved in Kinesins |
| 0.0 | 0.3 | REACTOME HOMOLOGOUS RECOMBINATION REPAIR OF REPLICATION INDEPENDENT DOUBLE STRAND BREAKS | Genes involved in Homologous recombination repair of replication-independent double-strand breaks |
| 0.0 | 0.2 | REACTOME ACTIVATION OF BH3 ONLY PROTEINS | Genes involved in Activation of BH3-only proteins |
| 0.0 | 0.2 | REACTOME DOWNSTREAM TCR SIGNALING | Genes involved in Downstream TCR signaling |
| 0.0 | 1.3 | REACTOME SIGNALING BY ERBB4 | Genes involved in Signaling by ERBB4 |
| 0.0 | 0.4 | REACTOME NETRIN1 SIGNALING | Genes involved in Netrin-1 signaling |
| 0.0 | 0.3 | REACTOME SYNTHESIS OF PIPS AT THE GOLGI MEMBRANE | Genes involved in Synthesis of PIPs at the Golgi membrane |
| 0.0 | 0.1 | REACTOME ROLE OF DCC IN REGULATING APOPTOSIS | Genes involved in Role of DCC in regulating apoptosis |
| 0.0 | 0.1 | REACTOME RAP1 SIGNALLING | Genes involved in Rap1 signalling |
| 0.0 | 0.2 | REACTOME CTNNB1 PHOSPHORYLATION CASCADE | Genes involved in Beta-catenin phosphorylation cascade |
| 0.0 | 0.1 | REACTOME MEMBRANE BINDING AND TARGETTING OF GAG PROTEINS | Genes involved in Membrane binding and targetting of GAG proteins |
| 0.0 | 0.5 | REACTOME CIRCADIAN CLOCK | Genes involved in Circadian Clock |
| 0.0 | 0.3 | REACTOME ADHERENS JUNCTIONS INTERACTIONS | Genes involved in Adherens junctions interactions |
| 0.0 | 0.2 | REACTOME N GLYCAN TRIMMING IN THE ER AND CALNEXIN CALRETICULIN CYCLE | Genes involved in N-glycan trimming in the ER and Calnexin/Calreticulin cycle |
| 0.0 | 0.2 | REACTOME SMOOTH MUSCLE CONTRACTION | Genes involved in Smooth Muscle Contraction |
| 0.0 | 0.3 | REACTOME PERK REGULATED GENE EXPRESSION | Genes involved in PERK regulated gene expression |
| 0.0 | 0.2 | REACTOME PROCESSING OF INTRONLESS PRE MRNAS | Genes involved in Processing of Intronless Pre-mRNAs |
| 0.0 | 0.2 | REACTOME NOD1 2 SIGNALING PATHWAY | Genes involved in NOD1/2 Signaling Pathway |
| 0.0 | 0.1 | REACTOME PACKAGING OF TELOMERE ENDS | Genes involved in Packaging Of Telomere Ends |
| 0.0 | 0.1 | REACTOME FANCONI ANEMIA PATHWAY | Genes involved in Fanconi Anemia pathway |