Project
PRJNA195909:zebrafish embryo and larva development
Navigation
Downloads
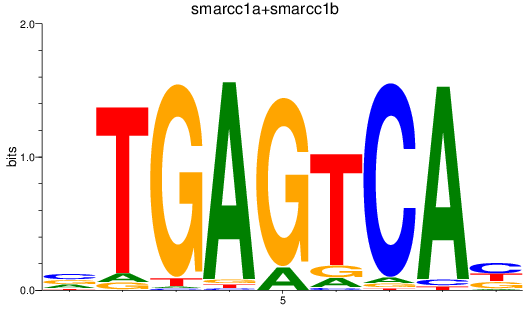
Results for smarcc1a+smarcc1b
Z-value: 1.25
Motif logo
Transcription factors associated with smarcc1a+smarcc1b
| Gene Symbol | Gene ID | Gene Info |
|---|---|---|
|
smarcc1a
|
ENSDARG00000017397 | SWI/SNF related, matrix associated, actin dependent regulator of chromatin, subfamily c, member 1a |
|
smarcc1b
|
ENSDARG00000098919 | SWI/SNF related, matrix associated, actin dependent regulator of chromatin, subfamily c, member 1b |
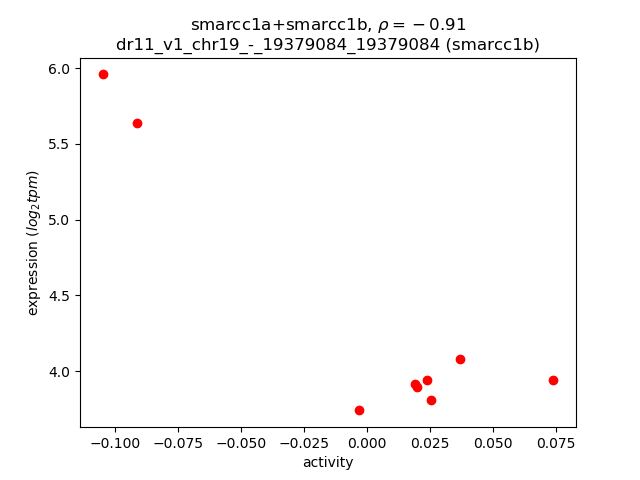
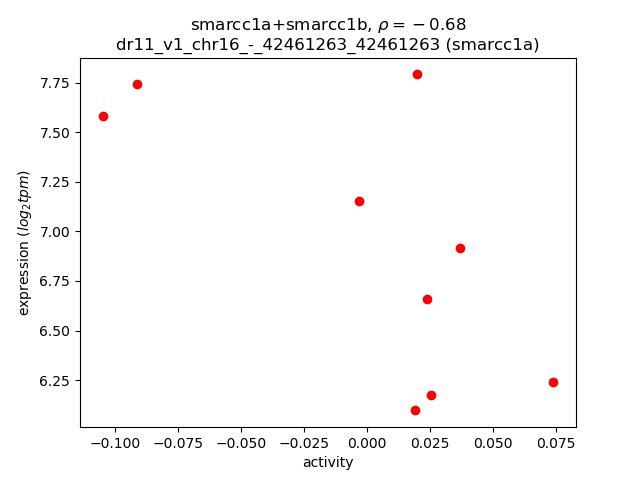
Activity-expression correlation:
| Gene | Promoter | Pearson corr. coef. | P-value | Plot |
|---|---|---|---|---|
| smarcc1b | dr11_v1_chr19_-_19379084_19379084 | -0.91 | 6.2e-04 | Click! |
| smarcc1a | dr11_v1_chr16_-_42461263_42461263 | -0.68 | 4.4e-02 | Click! |
Activity profile of smarcc1a+smarcc1b motif
Sorted Z-values of smarcc1a+smarcc1b motif
| Promoter | Log-likelihood | Transcript | Gene | Gene Info |
|---|---|---|---|---|
| chr1_-_59252973 | 7.79 |
ENSDART00000167061
|
si:ch1073-286c18.5
|
si:ch1073-286c18.5 |
| chr11_-_24681292 | 2.49 |
ENSDART00000089601
|
olfml3b
|
olfactomedin-like 3b |
| chr22_-_15593824 | 2.45 |
ENSDART00000123125
|
tpm4a
|
tropomyosin 4a |
| chr5_-_67471375 | 2.12 |
ENSDART00000147009
|
si:dkey-251i10.2
|
si:dkey-251i10.2 |
| chr13_+_4671698 | 2.08 |
ENSDART00000164617
ENSDART00000128494 ENSDART00000165776 |
pla2g12b
|
phospholipase A2, group XIIB |
| chr12_-_30841679 | 2.07 |
ENSDART00000105594
|
crygmx
|
crystallin, gamma MX |
| chr3_-_61185746 | 2.01 |
ENSDART00000028219
|
pvalb4
|
parvalbumin 4 |
| chr16_+_23403602 | 2.01 |
ENSDART00000159848
|
s100w
|
S100 calcium binding protein W |
| chr3_-_32818607 | 1.79 |
ENSDART00000075465
|
mylpfa
|
myosin light chain, phosphorylatable, fast skeletal muscle a |
| chr22_+_37888249 | 1.78 |
ENSDART00000076082
|
fetub
|
fetuin B |
| chr9_-_22076368 | 1.67 |
ENSDART00000128486
|
crygm2a
|
crystallin, gamma M2a |
| chr6_-_13783604 | 1.66 |
ENSDART00000149536
ENSDART00000041269 ENSDART00000150102 |
cryba2a
|
crystallin, beta A2a |
| chr22_-_26595027 | 1.66 |
ENSDART00000184162
|
CABZ01072309.1
|
|
| chr1_-_25679339 | 1.59 |
ENSDART00000161703
ENSDART00000054230 |
fgg
|
fibrinogen gamma chain |
| chr22_+_22888 | 1.50 |
ENSDART00000082471
|
mfap2
|
microfibril associated protein 2 |
| chr7_-_35432901 | 1.49 |
ENSDART00000026712
|
mmp2
|
matrix metallopeptidase 2 |
| chr16_-_16182319 | 1.49 |
ENSDART00000103815
|
stmn2a
|
stathmin 2a |
| chr3_+_24197934 | 1.47 |
ENSDART00000055609
|
atf4b
|
activating transcription factor 4b |
| chr2_+_48288461 | 1.45 |
ENSDART00000141495
|
hes6
|
hes family bHLH transcription factor 6 |
| chr11_-_28614608 | 1.45 |
ENSDART00000065853
|
dhrs3b
|
dehydrogenase/reductase (SDR family) member 3b |
| chr16_-_14397003 | 1.44 |
ENSDART00000170957
|
crabp2a
|
cellular retinoic acid binding protein 2, a |
| chr20_-_26531850 | 1.43 |
ENSDART00000183317
ENSDART00000131994 |
mthfd1l
|
methylenetetrahydrofolate dehydrogenase (NADP+ dependent) 1 like |
| chr4_+_5249494 | 1.41 |
ENSDART00000150391
|
si:ch211-214j24.14
|
si:ch211-214j24.14 |
| chr11_-_3334248 | 1.41 |
ENSDART00000154314
ENSDART00000121861 |
prph
|
peripherin |
| chr7_+_22657566 | 1.38 |
ENSDART00000141048
|
ponzr5
|
plac8 onzin related protein 5 |
| chr22_+_11756040 | 1.36 |
ENSDART00000105808
|
krt97
|
keratin 97 |
| chr20_-_32446406 | 1.35 |
ENSDART00000026635
|
nr2e1
|
nuclear receptor subfamily 2, group E, member 1 |
| chr20_-_26532167 | 1.33 |
ENSDART00000061914
|
mthfd1l
|
methylenetetrahydrofolate dehydrogenase (NADP+ dependent) 1 like |
| chr16_+_33655890 | 1.33 |
ENSDART00000143757
|
fhl3a
|
four and a half LIM domains 3a |
| chr19_-_5332784 | 1.32 |
ENSDART00000010373
|
krt1-19d
|
keratin, type 1, gene 19d |
| chr21_+_25765734 | 1.30 |
ENSDART00000021664
|
cldnb
|
claudin b |
| chr6_+_29791164 | 1.29 |
ENSDART00000017424
|
ptmaa
|
prothymosin, alpha a |
| chr23_-_35694461 | 1.29 |
ENSDART00000185884
|
tuba1c
|
tubulin, alpha 1c |
| chr14_+_34486629 | 1.26 |
ENSDART00000131861
|
tmsb2
|
thymosin beta 2 |
| chr2_-_2020044 | 1.26 |
ENSDART00000024135
|
tubb2
|
tubulin, beta 2A class IIa |
| chr6_-_18976168 | 1.25 |
ENSDART00000170039
|
sept9b
|
septin 9b |
| chr12_-_6159545 | 1.25 |
ENSDART00000152487
|
rltgr
|
RAMP-like triterpene glycoside receptor |
| chr5_-_25582721 | 1.24 |
ENSDART00000123986
|
anxa1a
|
annexin A1a |
| chr7_+_25033924 | 1.24 |
ENSDART00000170873
|
sb:cb1058
|
sb:cb1058 |
| chr4_-_5291256 | 1.23 |
ENSDART00000150864
|
SNAP91 (1 of many)
|
si:ch211-214j24.9 |
| chr13_+_24280380 | 1.22 |
ENSDART00000184115
|
acta1b
|
actin, alpha 1b, skeletal muscle |
| chr11_+_26609110 | 1.22 |
ENSDART00000042322
|
map1lc3a
|
microtubule-associated protein 1 light chain 3 alpha |
| chr13_+_2908764 | 1.21 |
ENSDART00000162362
|
wu:fj16a03
|
wu:fj16a03 |
| chr13_+_43247936 | 1.21 |
ENSDART00000126850
ENSDART00000165331 |
smoc2
|
SPARC related modular calcium binding 2 |
| chr5_-_20195350 | 1.21 |
ENSDART00000139675
|
dao.1
|
D-amino-acid oxidase, tandem duplicate 1 |
| chr16_+_42829735 | 1.21 |
ENSDART00000014956
|
polr3glb
|
polymerase (RNA) III (DNA directed) polypeptide G like b |
| chr6_+_56141852 | 1.20 |
ENSDART00000149665
|
tfap2c
|
transcription factor AP-2 gamma (activating enhancer binding protein 2 gamma) |
| chr8_+_25900049 | 1.20 |
ENSDART00000124300
ENSDART00000127618 ENSDART00000024009 |
rhoab
|
ras homolog gene family, member Ab |
| chr25_-_22187397 | 1.20 |
ENSDART00000123211
ENSDART00000139110 |
pkp3a
|
plakophilin 3a |
| chr14_-_38878356 | 1.19 |
ENSDART00000173082
ENSDART00000039788 |
uqcrq
|
ubiquinol-cytochrome c reductase, complex III subunit VII |
| chr17_-_5583345 | 1.19 |
ENSDART00000035944
|
clic5a
|
chloride intracellular channel 5a |
| chr25_-_173165 | 1.19 |
ENSDART00000193594
|
CABZ01114053.1
|
|
| chr18_-_12052132 | 1.18 |
ENSDART00000074361
|
zgc:110789
|
zgc:110789 |
| chr3_+_27027781 | 1.18 |
ENSDART00000065495
|
emp2
|
epithelial membrane protein 2 |
| chr23_-_21471022 | 1.17 |
ENSDART00000104206
|
her4.2
|
hairy-related 4, tandem duplicate 2 |
| chr3_-_4303262 | 1.16 |
ENSDART00000112819
|
si:dkey-73p2.2
|
si:dkey-73p2.2 |
| chr20_+_34770197 | 1.15 |
ENSDART00000018304
|
mcm3
|
minichromosome maintenance complex component 3 |
| chr3_+_23752150 | 1.14 |
ENSDART00000146636
|
hoxb2a
|
homeobox B2a |
| chr19_-_7420867 | 1.14 |
ENSDART00000081741
|
rab25a
|
RAB25, member RAS oncogene family a |
| chr6_+_56147812 | 1.14 |
ENSDART00000150219
|
tfap2c
|
transcription factor AP-2 gamma (activating enhancer binding protein 2 gamma) |
| chr5_-_30615901 | 1.14 |
ENSDART00000147769
|
si:ch211-117m20.5
|
si:ch211-117m20.5 |
| chr3_-_34801041 | 1.13 |
ENSDART00000103043
|
nsfa
|
N-ethylmaleimide-sensitive factor a |
| chr7_-_28696556 | 1.12 |
ENSDART00000148822
|
adgrg1
|
adhesion G protein-coupled receptor G1 |
| chr17_+_7595356 | 1.12 |
ENSDART00000130625
|
si:dkeyp-110a12.4
|
si:dkeyp-110a12.4 |
| chr12_+_25945560 | 1.10 |
ENSDART00000109799
|
mmrn2b
|
multimerin 2b |
| chr1_+_12766351 | 1.09 |
ENSDART00000165785
|
pcdh10a
|
protocadherin 10a |
| chr1_-_22861348 | 1.09 |
ENSDART00000139412
|
SMIM18
|
si:dkey-92j12.6 |
| chr18_+_45114392 | 1.08 |
ENSDART00000172328
|
large2
|
LARGE xylosyl- and glucuronyltransferase 2 |
| chr1_-_10071422 | 1.08 |
ENSDART00000135522
ENSDART00000033118 |
fga
|
fibrinogen alpha chain |
| chr19_+_31771270 | 1.07 |
ENSDART00000147474
|
stmn2b
|
stathmin 2b |
| chr14_+_33722950 | 1.07 |
ENSDART00000075312
|
apln
|
apelin |
| chr2_+_47581997 | 1.07 |
ENSDART00000112579
|
scg2b
|
secretogranin II (chromogranin C), b |
| chr20_+_34915945 | 1.07 |
ENSDART00000153064
|
snap25a
|
synaptosomal-associated protein, 25a |
| chr13_+_22479988 | 1.06 |
ENSDART00000188182
ENSDART00000192972 ENSDART00000178372 |
ldb3a
|
LIM domain binding 3a |
| chr5_-_8164439 | 1.05 |
ENSDART00000189912
|
slc1a3a
|
solute carrier family 1 (glial high affinity glutamate transporter), member 3a |
| chr9_-_48370645 | 1.04 |
ENSDART00000140185
|
col28a2a
|
collagen, type XXVIII, alpha 2a |
| chr18_-_3166726 | 1.04 |
ENSDART00000165002
|
aqp11
|
aquaporin 11 |
| chr22_+_11775269 | 1.03 |
ENSDART00000140272
|
krt96
|
keratin 96 |
| chr25_+_21324588 | 1.01 |
ENSDART00000151842
|
lrrn3a
|
leucine rich repeat neuronal 3a |
| chr23_-_12345764 | 1.00 |
ENSDART00000133956
|
phactr3a
|
phosphatase and actin regulator 3a |
| chr16_+_20915319 | 1.00 |
ENSDART00000079383
|
hoxa9b
|
homeobox A9b |
| chr20_+_26880668 | 1.00 |
ENSDART00000077769
|
serpinb1
|
serpin peptidase inhibitor, clade B (ovalbumin), member 1 |
| chr19_-_103289 | 1.00 |
ENSDART00000143118
|
adgrb1b
|
adhesion G protein-coupled receptor B1b |
| chr22_+_11857356 | 1.00 |
ENSDART00000179540
|
mras
|
muscle RAS oncogene homolog |
| chr13_-_16222388 | 0.99 |
ENSDART00000182861
|
zgc:110045
|
zgc:110045 |
| chr16_-_21785261 | 0.99 |
ENSDART00000078858
|
si:ch73-86n18.1
|
si:ch73-86n18.1 |
| chr12_-_26064480 | 0.98 |
ENSDART00000158215
ENSDART00000171206 ENSDART00000171212 ENSDART00000182956 ENSDART00000186779 |
ldb3b
|
LIM domain binding 3b |
| chr25_-_18140537 | 0.98 |
ENSDART00000113581
|
kitlga
|
kit ligand a |
| chr3_-_53533128 | 0.97 |
ENSDART00000183591
|
notch3
|
notch 3 |
| chr3_-_26017592 | 0.97 |
ENSDART00000030890
|
hmox1a
|
heme oxygenase 1a |
| chr14_-_43000836 | 0.96 |
ENSDART00000162714
|
pcdh10b
|
protocadherin 10b |
| chr3_-_26017831 | 0.96 |
ENSDART00000179982
|
hmox1a
|
heme oxygenase 1a |
| chr19_-_6385594 | 0.95 |
ENSDART00000104950
|
atp1a3a
|
ATPase Na+/K+ transporting subunit alpha 3a |
| chr2_+_35612621 | 0.95 |
ENSDART00000143082
|
si:dkey-4i23.5
|
si:dkey-4i23.5 |
| chr10_+_37145007 | 0.94 |
ENSDART00000131777
|
cuedc1a
|
CUE domain containing 1a |
| chr21_-_44104600 | 0.94 |
ENSDART00000044599
|
oatx
|
organic anion transporter X |
| chr3_+_37574885 | 0.94 |
ENSDART00000055225
|
wnt9b
|
wingless-type MMTV integration site family, member 9B |
| chr7_+_34492744 | 0.93 |
ENSDART00000109635
ENSDART00000173844 |
calml4a
|
calmodulin-like 4a |
| chr13_+_23988442 | 0.93 |
ENSDART00000010918
|
agt
|
angiotensinogen |
| chr22_-_38621438 | 0.92 |
ENSDART00000098330
|
nppc
|
natriuretic peptide C |
| chr15_-_2657508 | 0.92 |
ENSDART00000102086
|
cldna
|
claudin a |
| chr1_+_41849152 | 0.92 |
ENSDART00000053685
|
smox
|
spermine oxidase |
| chr25_-_22191733 | 0.91 |
ENSDART00000067478
|
pkp3a
|
plakophilin 3a |
| chr7_+_73630751 | 0.91 |
ENSDART00000159745
|
PCP4L1
|
si:dkey-46i9.1 |
| chr3_+_20156956 | 0.91 |
ENSDART00000125281
|
ngfra
|
nerve growth factor receptor a (TNFR superfamily, member 16) |
| chr25_-_18140305 | 0.90 |
ENSDART00000180222
|
kitlga
|
kit ligand a |
| chr12_-_4388704 | 0.90 |
ENSDART00000152168
|
si:ch211-173d10.1
|
si:ch211-173d10.1 |
| chr20_+_6663544 | 0.90 |
ENSDART00000135390
|
tns3.2
|
tensin 3, tandem duplicate 2 |
| chr5_-_55623443 | 0.90 |
ENSDART00000005671
ENSDART00000176341 |
hnrpkl
|
heterogeneous nuclear ribonucleoprotein K, like |
| chr16_+_23960744 | 0.89 |
ENSDART00000058965
|
apoeb
|
apolipoprotein Eb |
| chr2_+_30379650 | 0.89 |
ENSDART00000129542
|
crispld1b
|
cysteine-rich secretory protein LCCL domain containing 1b |
| chr11_+_8660158 | 0.89 |
ENSDART00000169141
|
tbl1xr1a
|
transducin (beta)-like 1 X-linked receptor 1a |
| chr7_+_7048245 | 0.89 |
ENSDART00000001649
|
actn3b
|
actinin alpha 3b |
| chr11_-_10770053 | 0.89 |
ENSDART00000179213
|
slc4a10a
|
solute carrier family 4, sodium bicarbonate transporter, member 10a |
| chr12_-_37299646 | 0.88 |
ENSDART00000146142
ENSDART00000085201 |
pmp22b
|
peripheral myelin protein 22b |
| chr13_-_21701323 | 0.88 |
ENSDART00000164112
|
si:dkey-191g9.7
|
si:dkey-191g9.7 |
| chr2_+_47582681 | 0.88 |
ENSDART00000187579
|
scg2b
|
secretogranin II (chromogranin C), b |
| chr21_+_20383837 | 0.87 |
ENSDART00000026430
|
hspb11
|
heat shock protein, alpha-crystallin-related, b11 |
| chr8_+_39634114 | 0.86 |
ENSDART00000144293
|
msi1
|
musashi RNA-binding protein 1 |
| chr20_-_39103119 | 0.86 |
ENSDART00000143379
|
rcan2
|
regulator of calcineurin 2 |
| chr21_-_30545121 | 0.86 |
ENSDART00000019199
|
rab39ba
|
RAB39B, member RAS oncogene family a |
| chr13_+_829585 | 0.85 |
ENSDART00000029051
|
gsta.2
|
glutathione S-transferase, alpha tandem duplicate 2 |
| chr4_-_16412084 | 0.85 |
ENSDART00000188460
|
dcn
|
decorin |
| chr14_+_33882973 | 0.85 |
ENSDART00000019396
|
clic2
|
chloride intracellular channel 2 |
| chr2_+_55984788 | 0.84 |
ENSDART00000183599
|
nmrk2
|
nicotinamide riboside kinase 2 |
| chr10_+_38610741 | 0.84 |
ENSDART00000126444
|
mmp13a
|
matrix metallopeptidase 13a |
| chr23_-_7797207 | 0.83 |
ENSDART00000181611
|
myt1b
|
myelin transcription factor 1b |
| chr7_-_35126374 | 0.83 |
ENSDART00000141211
|
hsd11b2
|
hydroxysteroid (11-beta) dehydrogenase 2 |
| chr1_-_5746030 | 0.83 |
ENSDART00000150863
|
nrp2a
|
neuropilin 2a |
| chr7_-_35314347 | 0.82 |
ENSDART00000005053
|
slc12a4
|
solute carrier family 12 (potassium/chloride transporter), member 4 |
| chr14_+_6423973 | 0.82 |
ENSDART00000051556
|
abca1b
|
ATP-binding cassette, sub-family A (ABC1), member 1B |
| chr15_-_19771981 | 0.82 |
ENSDART00000175502
ENSDART00000159475 |
picalmb
|
phosphatidylinositol binding clathrin assembly protein b |
| chr10_+_4987766 | 0.81 |
ENSDART00000121959
|
si:ch73-234b20.5
|
si:ch73-234b20.5 |
| chr14_-_17588345 | 0.81 |
ENSDART00000143486
|
selenot2
|
selenoprotein T, 2 |
| chr19_+_5072918 | 0.81 |
ENSDART00000037126
|
eno2
|
enolase 2 |
| chr12_-_1951233 | 0.80 |
ENSDART00000005676
ENSDART00000127937 |
sox9a
|
SRY (sex determining region Y)-box 9a |
| chr19_-_10881486 | 0.80 |
ENSDART00000168852
ENSDART00000160438 |
PSMD4 (1 of many)
psmd4a
|
proteasome 26S subunit, non-ATPase 4 proteasome 26S subunit, non-ATPase 4a |
| chr23_+_24124684 | 0.79 |
ENSDART00000144478
|
si:dkey-21o19.2
|
si:dkey-21o19.2 |
| chr15_-_28107502 | 0.79 |
ENSDART00000152270
ENSDART00000167129 |
cryba1a
|
crystallin, beta A1a |
| chr23_-_7799184 | 0.79 |
ENSDART00000190946
ENSDART00000165427 |
myt1b
|
myelin transcription factor 1b |
| chr11_-_18253111 | 0.78 |
ENSDART00000125984
|
mustn1b
|
musculoskeletal, embryonic nuclear protein 1b |
| chr10_+_22771176 | 0.78 |
ENSDART00000192046
|
tmem88a
|
transmembrane protein 88 a |
| chr9_-_2594410 | 0.78 |
ENSDART00000188306
ENSDART00000164276 |
sp9
|
sp9 transcription factor |
| chr20_-_23439011 | 0.78 |
ENSDART00000022887
|
slc10a4
|
solute carrier family 10, member 4 |
| chr7_-_8504355 | 0.78 |
ENSDART00000173067
|
loc564660
|
hypothetical protein LOC564660 |
| chr22_-_13350240 | 0.77 |
ENSDART00000154095
ENSDART00000155118 |
si:ch211-227m13.1
|
si:ch211-227m13.1 |
| chr11_+_13630107 | 0.77 |
ENSDART00000172220
|
si:ch211-1a19.3
|
si:ch211-1a19.3 |
| chr6_-_15757867 | 0.76 |
ENSDART00000063665
|
ackr3b
|
atypical chemokine receptor 3b |
| chr8_+_39511932 | 0.76 |
ENSDART00000113511
|
lzts1
|
leucine zipper, putative tumor suppressor 1 |
| chr12_+_20336070 | 0.75 |
ENSDART00000066385
|
zgc:163057
|
zgc:163057 |
| chr1_-_411331 | 0.75 |
ENSDART00000092524
|
rasa3
|
RAS p21 protein activator 3 |
| chr14_-_11456724 | 0.75 |
ENSDART00000110424
|
si:ch211-153b23.4
|
si:ch211-153b23.4 |
| chr4_-_6809323 | 0.74 |
ENSDART00000099467
|
ifrd1
|
interferon-related developmental regulator 1 |
| chr13_+_25433774 | 0.74 |
ENSDART00000141255
|
si:dkey-51a16.9
|
si:dkey-51a16.9 |
| chr25_-_18330503 | 0.73 |
ENSDART00000104496
|
dusp6
|
dual specificity phosphatase 6 |
| chr19_-_33212023 | 0.73 |
ENSDART00000189209
|
trib1
|
tribbles pseudokinase 1 |
| chr2_+_38264964 | 0.73 |
ENSDART00000182068
|
dhrs1
|
dehydrogenase/reductase (SDR family) member 1 |
| chr5_-_66028714 | 0.72 |
ENSDART00000022625
ENSDART00000164228 |
nrarpb
|
NOTCH regulated ankyrin repeat protein b |
| chr4_+_1600034 | 0.72 |
ENSDART00000146779
|
slc38a2
|
solute carrier family 38, member 2 |
| chr22_-_11724563 | 0.72 |
ENSDART00000190796
ENSDART00000184744 |
krt222
|
keratin 222 |
| chr22_-_4644484 | 0.71 |
ENSDART00000167748
|
fbn2b
|
fibrillin 2b |
| chr16_+_9762261 | 0.71 |
ENSDART00000020654
|
psmd4b
|
proteasome 26S subunit, non-ATPase 4b |
| chr7_-_26436436 | 0.71 |
ENSDART00000019035
ENSDART00000123395 |
her8a
|
hairy-related 8a |
| chr15_-_19772372 | 0.71 |
ENSDART00000152729
|
picalmb
|
phosphatidylinositol binding clathrin assembly protein b |
| chr6_+_3710865 | 0.71 |
ENSDART00000170781
|
phospho2
|
phosphatase, orphan 2 |
| chr3_-_32320537 | 0.71 |
ENSDART00000113550
ENSDART00000168483 |
si:dkey-16p21.7
|
si:dkey-16p21.7 |
| chr20_-_40319890 | 0.71 |
ENSDART00000075112
|
clvs2
|
clavesin 2 |
| chr14_+_30279391 | 0.70 |
ENSDART00000172794
|
fgl1
|
fibrinogen-like 1 |
| chr5_+_15819651 | 0.69 |
ENSDART00000081230
ENSDART00000186969 ENSDART00000134206 |
hspb8
|
heat shock protein b8 |
| chr17_+_58211 | 0.69 |
ENSDART00000157642
|
si:ch1073-209e23.1
|
si:ch1073-209e23.1 |
| chr14_+_49382180 | 0.69 |
ENSDART00000158329
|
tnip1
|
TNFAIP3 interacting protein 1 |
| chr25_+_13191391 | 0.69 |
ENSDART00000109937
|
si:ch211-147m6.2
|
si:ch211-147m6.2 |
| chr16_-_48673938 | 0.69 |
ENSDART00000156969
|
notchl
|
notch homolog, like |
| chr7_+_20512419 | 0.68 |
ENSDART00000173907
|
si:dkey-19b23.14
|
si:dkey-19b23.14 |
| chr5_-_48260145 | 0.68 |
ENSDART00000044083
ENSDART00000163250 ENSDART00000135911 |
mef2cb
|
myocyte enhancer factor 2cb |
| chr3_-_39695856 | 0.68 |
ENSDART00000148247
|
b9d1
|
B9 protein domain 1 |
| chr14_-_34044369 | 0.67 |
ENSDART00000149396
ENSDART00000123607 ENSDART00000190746 |
cyfip2
|
cytoplasmic FMR1 interacting protein 2 |
| chr9_-_710896 | 0.67 |
ENSDART00000180478
|
ndufb3
|
NADH dehydrogenase (ubiquinone) 1 beta subcomplex, 3 |
| chr4_+_16715267 | 0.67 |
ENSDART00000143849
|
pkp2
|
plakophilin 2 |
| chr7_+_23875269 | 0.67 |
ENSDART00000101406
|
rab39bb
|
RAB39B, member RAS oncogene family b |
| chr14_-_13048355 | 0.67 |
ENSDART00000166434
|
si:dkey-35h6.1
|
si:dkey-35h6.1 |
| chr3_+_7617353 | 0.67 |
ENSDART00000165551
|
zgc:109949
|
zgc:109949 |
| chr7_-_13381129 | 0.67 |
ENSDART00000164326
|
si:ch73-119p20.1
|
si:ch73-119p20.1 |
| chr19_+_43314700 | 0.67 |
ENSDART00000049045
ENSDART00000133158 |
matn1
|
matrilin 1 |
| chr4_+_77735212 | 0.67 |
ENSDART00000160716
|
si:dkey-238k10.1
|
si:dkey-238k10.1 |
| chr14_-_42997145 | 0.67 |
ENSDART00000172801
|
pcdh10b
|
protocadherin 10b |
| chr4_-_73787702 | 0.66 |
ENSDART00000136328
ENSDART00000150546 |
si:dkey-262g12.3
|
si:dkey-262g12.3 |
| chr11_+_24251141 | 0.66 |
ENSDART00000182684
|
pnp4a
|
purine nucleoside phosphorylase 4a |
| chr13_+_22480496 | 0.66 |
ENSDART00000136863
ENSDART00000131870 ENSDART00000078720 ENSDART00000078740 ENSDART00000139218 |
ldb3a
|
LIM domain binding 3a |
| chr22_+_10646928 | 0.65 |
ENSDART00000038465
|
rassf1
|
Ras association (RalGDS/AF-6) domain family 1 |
| chr24_+_13869092 | 0.64 |
ENSDART00000176492
|
eya1
|
EYA transcriptional coactivator and phosphatase 1 |
| chr2_-_985417 | 0.64 |
ENSDART00000140540
|
si:ch211-241e1.3
|
si:ch211-241e1.3 |
| chr1_-_52498146 | 0.64 |
ENSDART00000122217
|
acy3.2
|
aspartoacylase (aminocyclase) 3, tandem duplicate 2 |
| chr3_-_58650057 | 0.64 |
ENSDART00000057640
|
dhrs7ca
|
dehydrogenase/reductase (SDR family) member 7Ca |
| chr25_+_13191615 | 0.63 |
ENSDART00000168849
|
si:ch211-147m6.2
|
si:ch211-147m6.2 |
| chr5_+_4338874 | 0.63 |
ENSDART00000141866
|
sat1a.1
|
spermidine/spermine N1-acetyltransferase 1a, duplicate 1 |
| chr10_-_6454386 | 0.63 |
ENSDART00000168549
|
ca9
|
carbonic anhydrase IX |
| chr22_-_12746539 | 0.63 |
ENSDART00000175374
|
plcd4a
|
phospholipase C, delta 4a |
| chr10_+_4499943 | 0.63 |
ENSDART00000125299
|
plk2a
|
polo-like kinase 2a (Drosophila) |
| chr16_+_14033121 | 0.62 |
ENSDART00000135844
|
rusc1
|
RUN and SH3 domain containing 1 |
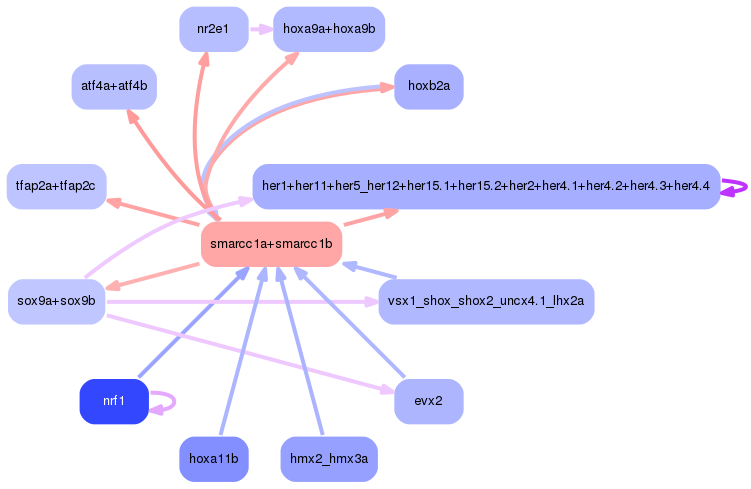
Network of associatons between targets according to the STRING database.

First level regulatory network of smarcc1a+smarcc1b
Gene Ontology Analysis
Gene overrepresentation in biological process category:
| Log-likelihood per target | Total log-likelihood | Term | Description |
|---|---|---|---|
| 0.6 | 1.9 | GO:0007585 | respiratory gaseous exchange(GO:0007585) regulation of respiratory gaseous exchange(GO:0043576) |
| 0.4 | 1.7 | GO:0048914 | anterior lateral line nerve glial cell differentiation(GO:0048913) myelination of anterior lateral line nerve axons(GO:0048914) anterior lateral line nerve glial cell development(GO:0048939) anterior lateral line nerve glial cell morphogenesis involved in differentiation(GO:0048940) |
| 0.4 | 1.6 | GO:0003322 | pancreatic A cell development(GO:0003322) |
| 0.4 | 1.2 | GO:0003071 | renal system process involved in regulation of blood volume(GO:0001977) renal system process involved in regulation of systemic arterial blood pressure(GO:0003071) regulation of glomerular filtration(GO:0003093) |
| 0.3 | 1.0 | GO:0098725 | somatic stem cell population maintenance(GO:0035019) symmetric cell division(GO:0098725) |
| 0.3 | 1.2 | GO:0046436 | alanine metabolic process(GO:0006522) alanine catabolic process(GO:0006524) pyruvate family amino acid metabolic process(GO:0009078) pyruvate family amino acid catabolic process(GO:0009080) D-alanine family amino acid metabolic process(GO:0046144) D-alanine metabolic process(GO:0046436) D-alanine catabolic process(GO:0055130) |
| 0.3 | 0.9 | GO:0071830 | chylomicron remnant clearance(GO:0034382) triglyceride-rich lipoprotein particle clearance(GO:0071830) intermediate-density lipoprotein particle clearance(GO:0071831) |
| 0.3 | 0.8 | GO:0061317 | negative regulation of striated muscle cell differentiation(GO:0051154) negative regulation of cardiac muscle tissue development(GO:0055026) cardiac muscle cell fate commitment(GO:0060923) canonical Wnt signaling pathway involved in cardiac muscle cell fate commitment(GO:0061317) regulation of canonical Wnt signaling pathway involved in cardiac muscle cell fate commitment(GO:1901295) negative regulation of canonical Wnt signaling pathway involved in cardiac muscle cell fate commitment(GO:1901296) negative regulation of cardiocyte differentiation(GO:1905208) negative regulation of cardiac muscle cell differentiation(GO:2000726) |
| 0.2 | 1.0 | GO:0090386 | phagosome maturation involved in apoptotic cell clearance(GO:0090386) phagolysosome assembly involved in apoptotic cell clearance(GO:0090387) |
| 0.2 | 0.7 | GO:0003249 | cell proliferation involved in heart valve morphogenesis(GO:0003249) regulation of cell proliferation involved in heart valve morphogenesis(GO:0003250) endocardial cell development(GO:0060958) cell proliferation involved in heart valve development(GO:2000793) |
| 0.2 | 3.3 | GO:1903963 | icosanoid secretion(GO:0032309) arachidonic acid secretion(GO:0050482) arachidonate transport(GO:1903963) |
| 0.2 | 1.1 | GO:0035988 | chondrocyte proliferation(GO:0035988) |
| 0.2 | 0.6 | GO:1901232 | regulation of convergent extension involved in axis elongation(GO:1901232) positive regulation of epiboly involved in gastrulation with mouth forming second(GO:1904088) |
| 0.2 | 1.6 | GO:0021794 | thalamus development(GO:0021794) |
| 0.2 | 3.0 | GO:0043248 | proteasome assembly(GO:0043248) |
| 0.2 | 3.0 | GO:0048385 | regulation of retinoic acid receptor signaling pathway(GO:0048385) |
| 0.2 | 0.6 | GO:0035902 | response to immobilization stress(GO:0035902) |
| 0.2 | 2.5 | GO:0014036 | neural crest cell fate commitment(GO:0014034) neural crest cell fate specification(GO:0014036) |
| 0.2 | 2.7 | GO:0072378 | blood coagulation, fibrin clot formation(GO:0072378) |
| 0.2 | 0.8 | GO:0021730 | trigeminal sensory nucleus development(GO:0021730) |
| 0.2 | 1.1 | GO:0070445 | regulation of oligodendrocyte progenitor proliferation(GO:0070445) |
| 0.2 | 2.8 | GO:0035999 | tetrahydrofolate interconversion(GO:0035999) |
| 0.2 | 1.1 | GO:0090133 | mesendoderm migration(GO:0090133) cell migration involved in mesendoderm migration(GO:0090134) |
| 0.2 | 1.2 | GO:1902766 | skeletal muscle satellite cell migration(GO:1902766) |
| 0.2 | 0.5 | GO:0022009 | central nervous system vasculogenesis(GO:0022009) |
| 0.2 | 0.6 | GO:0009447 | polyamine catabolic process(GO:0006598) putrescine catabolic process(GO:0009447) |
| 0.2 | 0.9 | GO:0071800 | podosome assembly(GO:0071800) |
| 0.2 | 0.8 | GO:0030326 | embryonic limb morphogenesis(GO:0030326) |
| 0.2 | 0.5 | GO:0032263 | guanine salvage(GO:0006178) GMP salvage(GO:0032263) guanine biosynthetic process(GO:0046099) |
| 0.1 | 0.4 | GO:0002676 | granuloma formation(GO:0002432) chronic inflammatory response(GO:0002544) regulation of granuloma formation(GO:0002631) regulation of chronic inflammatory response(GO:0002676) |
| 0.1 | 0.4 | GO:0072314 | glomerular visceral epithelial cell fate commitment(GO:0072149) glomerular epithelial cell fate commitment(GO:0072314) |
| 0.1 | 1.4 | GO:0033700 | phospholipid efflux(GO:0033700) |
| 0.1 | 0.3 | GO:0001954 | positive regulation of cell-matrix adhesion(GO:0001954) |
| 0.1 | 0.8 | GO:0070254 | mucus secretion(GO:0070254) |
| 0.1 | 1.3 | GO:0042989 | sequestering of actin monomers(GO:0042989) |
| 0.1 | 0.6 | GO:0070208 | protein heterotrimerization(GO:0070208) |
| 0.1 | 0.6 | GO:0060836 | lymphatic endothelial cell differentiation(GO:0060836) |
| 0.1 | 0.5 | GO:0061181 | regulation of chondrocyte development(GO:0061181) |
| 0.1 | 0.4 | GO:0099540 | synaptic signaling via neuropeptide(GO:0099538) trans-synaptic signaling by neuropeptide(GO:0099540) trans-synaptic signaling by neuropeptide, modulating synaptic transmission(GO:0099551) cellular response to brain-derived neurotrophic factor stimulus(GO:1990416) |
| 0.1 | 0.6 | GO:1905207 | regulation of cardiocyte differentiation(GO:1905207) regulation of cardiac muscle cell differentiation(GO:2000725) |
| 0.1 | 1.2 | GO:0006122 | mitochondrial electron transport, ubiquinol to cytochrome c(GO:0006122) |
| 0.1 | 0.8 | GO:0034650 | cortisol metabolic process(GO:0034650) |
| 0.1 | 1.2 | GO:0002043 | blood vessel endothelial cell proliferation involved in sprouting angiogenesis(GO:0002043) |
| 0.1 | 0.6 | GO:0002949 | tRNA threonylcarbamoyladenosine modification(GO:0002949) |
| 0.1 | 0.3 | GO:0033147 | negative regulation of intracellular estrogen receptor signaling pathway(GO:0033147) |
| 0.1 | 0.7 | GO:0060420 | regulation of heart growth(GO:0060420) |
| 0.1 | 1.1 | GO:0006267 | pre-replicative complex assembly involved in nuclear cell cycle DNA replication(GO:0006267) pre-replicative complex assembly(GO:0036388) pre-replicative complex assembly involved in cell cycle DNA replication(GO:1902299) |
| 0.1 | 0.3 | GO:0008344 | adult locomotory behavior(GO:0008344) |
| 0.1 | 0.6 | GO:2000480 | negative regulation of cAMP-dependent protein kinase activity(GO:2000480) |
| 0.1 | 0.8 | GO:0032889 | regulation of vacuole fusion, non-autophagic(GO:0032889) |
| 0.1 | 1.0 | GO:0009954 | proximal/distal pattern formation(GO:0009954) |
| 0.1 | 0.4 | GO:0090153 | regulation of sphingolipid biosynthetic process(GO:0090153) negative regulation of sphingolipid biosynthetic process(GO:0090155) negative regulation of ceramide biosynthetic process(GO:1900060) regulation of membrane lipid metabolic process(GO:1905038) regulation of ceramide biosynthetic process(GO:2000303) |
| 0.1 | 0.7 | GO:0045110 | intermediate filament bundle assembly(GO:0045110) |
| 0.1 | 0.3 | GO:0016056 | rhodopsin mediated signaling pathway(GO:0016056) |
| 0.1 | 0.4 | GO:0034146 | toll-like receptor 5 signaling pathway(GO:0034146) |
| 0.1 | 0.6 | GO:0042983 | amyloid precursor protein biosynthetic process(GO:0042983) regulation of amyloid precursor protein biosynthetic process(GO:0042984) |
| 0.1 | 2.5 | GO:1903670 | regulation of sprouting angiogenesis(GO:1903670) |
| 0.1 | 2.4 | GO:0055003 | cardiac myofibril assembly(GO:0055003) |
| 0.1 | 0.7 | GO:0043363 | nucleate erythrocyte differentiation(GO:0043363) |
| 0.1 | 0.4 | GO:0003210 | cardiac atrium formation(GO:0003210) |
| 0.1 | 0.5 | GO:0019344 | homoserine metabolic process(GO:0009092) cysteine biosynthetic process via cystathionine(GO:0019343) cysteine biosynthetic process(GO:0019344) transsulfuration(GO:0019346) |
| 0.1 | 0.6 | GO:0008343 | adult feeding behavior(GO:0008343) |
| 0.1 | 0.3 | GO:0035889 | otolith tethering(GO:0035889) |
| 0.1 | 0.6 | GO:0006537 | glutamate biosynthetic process(GO:0006537) glutamine catabolic process(GO:0006543) |
| 0.1 | 0.7 | GO:0006450 | regulation of translational fidelity(GO:0006450) |
| 0.1 | 0.4 | GO:0048025 | negative regulation of RNA splicing(GO:0033119) negative regulation of mRNA splicing, via spliceosome(GO:0048025) |
| 0.1 | 2.4 | GO:0044243 | collagen catabolic process(GO:0030574) multicellular organism catabolic process(GO:0044243) |
| 0.1 | 0.7 | GO:0006868 | glutamine transport(GO:0006868) |
| 0.1 | 0.6 | GO:1901099 | histone dephosphorylation(GO:0016576) negative regulation of signal transduction in absence of ligand(GO:1901099) regulation of extrinsic apoptotic signaling pathway in absence of ligand(GO:2001239) negative regulation of extrinsic apoptotic signaling pathway in absence of ligand(GO:2001240) |
| 0.1 | 0.2 | GO:0016038 | absorption of visible light(GO:0016038) |
| 0.1 | 0.8 | GO:0001964 | startle response(GO:0001964) |
| 0.1 | 1.1 | GO:0035269 | protein O-linked mannosylation(GO:0035269) |
| 0.1 | 0.4 | GO:0045899 | regulation of RNA polymerase II transcriptional preinitiation complex assembly(GO:0045898) positive regulation of RNA polymerase II transcriptional preinitiation complex assembly(GO:0045899) |
| 0.1 | 1.2 | GO:0097324 | melanocyte migration(GO:0097324) |
| 0.1 | 1.2 | GO:0006995 | cellular response to nitrogen starvation(GO:0006995) cellular response to nitrogen levels(GO:0043562) |
| 0.1 | 0.3 | GO:2001295 | malonyl-CoA biosynthetic process(GO:2001295) |
| 0.1 | 1.1 | GO:0018149 | peptide cross-linking(GO:0018149) |
| 0.1 | 1.6 | GO:0016082 | synaptic vesicle priming(GO:0016082) |
| 0.1 | 0.5 | GO:0044259 | collagen metabolic process(GO:0032963) multicellular organismal macromolecule metabolic process(GO:0044259) |
| 0.1 | 0.6 | GO:0006189 | 'de novo' IMP biosynthetic process(GO:0006189) |
| 0.1 | 1.2 | GO:0048936 | peripheral nervous system neuron axonogenesis(GO:0048936) |
| 0.1 | 2.7 | GO:0007019 | microtubule depolymerization(GO:0007019) |
| 0.1 | 2.2 | GO:0045103 | intermediate filament-based process(GO:0045103) intermediate filament cytoskeleton organization(GO:0045104) |
| 0.1 | 0.5 | GO:0006337 | nucleosome disassembly(GO:0006337) chromatin disassembly(GO:0031498) protein-DNA complex disassembly(GO:0032986) |
| 0.1 | 0.8 | GO:0015721 | bile acid and bile salt transport(GO:0015721) |
| 0.1 | 0.9 | GO:0036444 | calcium ion transmembrane import into mitochondrion(GO:0036444) |
| 0.1 | 0.5 | GO:0048172 | regulation of short-term neuronal synaptic plasticity(GO:0048172) |
| 0.1 | 0.8 | GO:0032332 | positive regulation of chondrocyte differentiation(GO:0032332) |
| 0.1 | 1.7 | GO:0048268 | clathrin coat assembly(GO:0048268) |
| 0.1 | 1.0 | GO:0030007 | cellular potassium ion homeostasis(GO:0030007) sodium ion export from cell(GO:0036376) sodium ion export(GO:0071436) |
| 0.1 | 0.9 | GO:0001990 | regulation of systemic arterial blood pressure by hormone(GO:0001990) |
| 0.1 | 0.9 | GO:0030183 | B cell differentiation(GO:0030183) |
| 0.0 | 0.2 | GO:0002681 | somatic diversification of T cell receptor genes(GO:0002568) somatic recombination of T cell receptor gene segments(GO:0002681) T cell receptor V(D)J recombination(GO:0033153) |
| 0.0 | 0.8 | GO:0030947 | regulation of vascular endothelial growth factor receptor signaling pathway(GO:0030947) |
| 0.0 | 1.1 | GO:0015986 | energy coupled proton transport, down electrochemical gradient(GO:0015985) ATP synthesis coupled proton transport(GO:0015986) |
| 0.0 | 0.2 | GO:0031444 | slow-twitch skeletal muscle fiber contraction(GO:0031444) |
| 0.0 | 0.4 | GO:0048208 | vesicle targeting, rough ER to cis-Golgi(GO:0048207) COPII vesicle coating(GO:0048208) |
| 0.0 | 0.9 | GO:0010257 | NADH dehydrogenase complex assembly(GO:0010257) mitochondrial respiratory chain complex I assembly(GO:0032981) mitochondrial respiratory chain complex I biogenesis(GO:0097031) |
| 0.0 | 0.9 | GO:0031033 | myosin filament organization(GO:0031033) |
| 0.0 | 0.6 | GO:0006228 | UTP biosynthetic process(GO:0006228) UTP metabolic process(GO:0046051) |
| 0.0 | 2.0 | GO:0070830 | apical junction assembly(GO:0043297) bicellular tight junction assembly(GO:0070830) |
| 0.0 | 3.3 | GO:0010951 | negative regulation of endopeptidase activity(GO:0010951) |
| 0.0 | 0.4 | GO:0070365 | hepatocyte differentiation(GO:0070365) |
| 0.0 | 0.4 | GO:2001238 | positive regulation of extrinsic apoptotic signaling pathway(GO:2001238) |
| 0.0 | 1.2 | GO:0006383 | transcription from RNA polymerase III promoter(GO:0006383) |
| 0.0 | 0.3 | GO:0070572 | positive regulation of axon regeneration(GO:0048680) positive regulation of neuron projection regeneration(GO:0070572) |
| 0.0 | 4.9 | GO:0002088 | lens development in camera-type eye(GO:0002088) |
| 0.0 | 0.4 | GO:0021754 | facial nucleus development(GO:0021754) |
| 0.0 | 0.3 | GO:1904861 | excitatory synapse assembly(GO:1904861) |
| 0.0 | 0.4 | GO:0031268 | pseudopodium organization(GO:0031268) pseudopodium assembly(GO:0031269) regulation of pseudopodium assembly(GO:0031272) positive regulation of pseudopodium assembly(GO:0031274) |
| 0.0 | 0.4 | GO:0071786 | endoplasmic reticulum tubular network organization(GO:0071786) |
| 0.0 | 0.8 | GO:0015671 | oxygen transport(GO:0015671) |
| 0.0 | 0.3 | GO:0060217 | hemangioblast cell differentiation(GO:0060217) |
| 0.0 | 0.3 | GO:0061588 | calcium activated phospholipid scrambling(GO:0061588) |
| 0.0 | 1.3 | GO:0060840 | artery development(GO:0060840) |
| 0.0 | 1.9 | GO:0030318 | melanocyte differentiation(GO:0030318) |
| 0.0 | 0.2 | GO:1903846 | positive regulation of transforming growth factor beta receptor signaling pathway(GO:0030511) positive regulation of cellular response to transforming growth factor beta stimulus(GO:1903846) |
| 0.0 | 1.0 | GO:0032482 | Rab protein signal transduction(GO:0032482) |
| 0.0 | 0.6 | GO:0009749 | response to glucose(GO:0009749) |
| 0.0 | 0.4 | GO:2000601 | positive regulation of actin nucleation(GO:0051127) positive regulation of Arp2/3 complex-mediated actin nucleation(GO:2000601) |
| 0.0 | 0.2 | GO:0048662 | regulation of smooth muscle cell proliferation(GO:0048660) negative regulation of smooth muscle cell proliferation(GO:0048662) |
| 0.0 | 0.1 | GO:0030224 | monocyte differentiation(GO:0030224) |
| 0.0 | 0.5 | GO:0035914 | skeletal muscle cell differentiation(GO:0035914) |
| 0.0 | 0.1 | GO:0035124 | embryonic caudal fin morphogenesis(GO:0035124) |
| 0.0 | 0.7 | GO:0042476 | odontogenesis(GO:0042476) |
| 0.0 | 0.4 | GO:0033173 | calcineurin-NFAT signaling cascade(GO:0033173) |
| 0.0 | 0.7 | GO:0007097 | nuclear migration(GO:0007097) establishment of nucleus localization(GO:0040023) |
| 0.0 | 0.2 | GO:0007288 | sperm axoneme assembly(GO:0007288) |
| 0.0 | 0.2 | GO:0009791 | post-embryonic development(GO:0009791) |
| 0.0 | 0.2 | GO:0034058 | endosomal vesicle fusion(GO:0034058) |
| 0.0 | 0.8 | GO:0050654 | chondroitin sulfate proteoglycan metabolic process(GO:0050654) |
| 0.0 | 0.4 | GO:0006120 | mitochondrial electron transport, NADH to ubiquinone(GO:0006120) |
| 0.0 | 0.2 | GO:0050667 | homocysteine metabolic process(GO:0050667) |
| 0.0 | 0.1 | GO:0001774 | microglial cell activation(GO:0001774) |
| 0.0 | 0.6 | GO:0021884 | forebrain neuron development(GO:0021884) |
| 0.0 | 0.4 | GO:1902882 | regulation of response to oxidative stress(GO:1902882) |
| 0.0 | 0.1 | GO:0034134 | toll-like receptor 2 signaling pathway(GO:0034134) |
| 0.0 | 0.3 | GO:0060396 | growth hormone receptor signaling pathway(GO:0060396) response to growth hormone(GO:0060416) cellular response to growth hormone stimulus(GO:0071378) |
| 0.0 | 0.7 | GO:0007040 | lysosome organization(GO:0007040) lytic vacuole organization(GO:0080171) |
| 0.0 | 0.1 | GO:0009298 | GDP-mannose biosynthetic process(GO:0009298) |
| 0.0 | 0.2 | GO:0019405 | alditol catabolic process(GO:0019405) |
| 0.0 | 0.6 | GO:0030513 | positive regulation of BMP signaling pathway(GO:0030513) |
| 0.0 | 0.5 | GO:0043124 | negative regulation of I-kappaB kinase/NF-kappaB signaling(GO:0043124) |
| 0.0 | 0.2 | GO:0006348 | chromatin silencing at telomere(GO:0006348) |
| 0.0 | 1.5 | GO:0048048 | embryonic eye morphogenesis(GO:0048048) |
| 0.0 | 1.5 | GO:0007043 | cell-cell junction assembly(GO:0007043) |
| 0.0 | 0.2 | GO:0071300 | cellular response to retinoic acid(GO:0071300) |
| 0.0 | 1.0 | GO:0045010 | actin nucleation(GO:0045010) |
| 0.0 | 0.3 | GO:0030150 | protein import into mitochondrial matrix(GO:0030150) |
| 0.0 | 0.7 | GO:0034111 | negative regulation of homotypic cell-cell adhesion(GO:0034111) negative regulation of T cell activation(GO:0050868) negative regulation of leukocyte cell-cell adhesion(GO:1903038) |
| 0.0 | 0.1 | GO:1990519 | pyrimidine nucleotide transport(GO:0006864) mitochondrial pyrimidine nucleotide import(GO:1990519) |
| 0.0 | 0.6 | GO:0048814 | regulation of dendrite morphogenesis(GO:0048814) |
| 0.0 | 0.5 | GO:0000184 | nuclear-transcribed mRNA catabolic process, nonsense-mediated decay(GO:0000184) |
| 0.0 | 0.2 | GO:0009251 | polysaccharide catabolic process(GO:0000272) glycogen catabolic process(GO:0005980) glucan catabolic process(GO:0009251) cellular polysaccharide catabolic process(GO:0044247) |
| 0.0 | 0.2 | GO:0009313 | oligosaccharide catabolic process(GO:0009313) |
| 0.0 | 0.2 | GO:0006561 | proline biosynthetic process(GO:0006561) L-proline biosynthetic process(GO:0055129) |
| 0.0 | 0.1 | GO:0006526 | arginine biosynthetic process(GO:0006526) |
| 0.0 | 0.2 | GO:0046549 | retinal cone cell development(GO:0046549) |
| 0.0 | 0.3 | GO:0051496 | positive regulation of stress fiber assembly(GO:0051496) |
| 0.0 | 0.9 | GO:0016575 | histone deacetylation(GO:0016575) |
| 0.0 | 1.9 | GO:0000910 | cytokinesis(GO:0000910) |
| 0.0 | 0.5 | GO:0045746 | negative regulation of Notch signaling pathway(GO:0045746) |
| 0.0 | 0.4 | GO:0035845 | photoreceptor cell outer segment organization(GO:0035845) |
| 0.0 | 0.1 | GO:0030325 | adrenal gland development(GO:0030325) |
| 0.0 | 0.1 | GO:0045050 | protein insertion into ER membrane by stop-transfer membrane-anchor sequence(GO:0045050) |
| 0.0 | 0.0 | GO:0019418 | sulfide oxidation(GO:0019418) sulfide oxidation, using sulfide:quinone oxidoreductase(GO:0070221) |
| 0.0 | 0.1 | GO:0071379 | cellular response to prostaglandin stimulus(GO:0071379) |
| 0.0 | 1.1 | GO:0019722 | calcium-mediated signaling(GO:0019722) |
| 0.0 | 0.6 | GO:0031122 | cytoplasmic microtubule organization(GO:0031122) |
| 0.0 | 0.8 | GO:0014904 | myotube cell development(GO:0014904) skeletal muscle fiber development(GO:0048741) |
| 0.0 | 0.9 | GO:0016079 | synaptic vesicle exocytosis(GO:0016079) |
| 0.0 | 0.5 | GO:0031532 | actin cytoskeleton reorganization(GO:0031532) |
| 0.0 | 0.3 | GO:0007340 | acrosome reaction(GO:0007340) |
| 0.0 | 1.6 | GO:0007626 | locomotory behavior(GO:0007626) |
| 0.0 | 0.3 | GO:0060078 | regulation of postsynaptic membrane potential(GO:0060078) |
| 0.0 | 0.5 | GO:0042149 | cellular response to glucose starvation(GO:0042149) |
| 0.0 | 0.6 | GO:0016358 | dendrite development(GO:0016358) |
| 0.0 | 0.5 | GO:0046579 | positive regulation of Ras protein signal transduction(GO:0046579) positive regulation of small GTPase mediated signal transduction(GO:0051057) |
| 0.0 | 0.1 | GO:0000186 | activation of MAPKK activity(GO:0000186) |
| 0.0 | 0.7 | GO:0034620 | cellular response to unfolded protein(GO:0034620) |
| 0.0 | 0.1 | GO:0060232 | regulation of epithelial to mesenchymal transition(GO:0010717) delamination(GO:0060232) |
| 0.0 | 0.3 | GO:0046475 | glycerophospholipid catabolic process(GO:0046475) |
| 0.0 | 0.7 | GO:1902668 | negative regulation of axon extension involved in axon guidance(GO:0048843) negative regulation of axon guidance(GO:1902668) |
| 0.0 | 0.4 | GO:0060914 | heart formation(GO:0060914) |
| 0.0 | 0.1 | GO:0043247 | protection from non-homologous end joining at telomere(GO:0031848) telomere maintenance in response to DNA damage(GO:0043247) |
| 0.0 | 0.2 | GO:0001867 | complement activation, lectin pathway(GO:0001867) |
| 0.0 | 1.3 | GO:1990266 | neutrophil migration(GO:1990266) |
| 0.0 | 0.1 | GO:0036368 | cone photoresponse recovery(GO:0036368) |
| 0.0 | 0.8 | GO:0008203 | cholesterol metabolic process(GO:0008203) |
| 0.0 | 0.2 | GO:0048096 | chromatin-mediated maintenance of transcription(GO:0048096) |
Gene overrepresentation in cellular component category:
| Log-likelihood per target | Total log-likelihood | Term | Description |
|---|---|---|---|
| 0.9 | 2.7 | GO:0005577 | fibrinogen complex(GO:0005577) |
| 0.2 | 1.4 | GO:0070032 | synaptobrevin 2-SNAP-25-syntaxin-1a-complexin I complex(GO:0070032) |
| 0.2 | 0.9 | GO:0034363 | intermediate-density lipoprotein particle(GO:0034363) |
| 0.2 | 2.7 | GO:0008540 | proteasome regulatory particle, base subcomplex(GO:0008540) |
| 0.1 | 0.6 | GO:0008290 | F-actin capping protein complex(GO:0008290) |
| 0.1 | 1.5 | GO:0098894 | presynaptic endocytic zone(GO:0098833) presynaptic endocytic zone membrane(GO:0098835) extrinsic component of presynaptic membrane(GO:0098888) extrinsic component of presynaptic endocytic zone(GO:0098894) |
| 0.1 | 0.9 | GO:0001891 | phagocytic cup(GO:0001891) |
| 0.1 | 1.6 | GO:1990589 | ATF4-CREB1 transcription factor complex(GO:1990589) |
| 0.1 | 0.5 | GO:1990909 | Wnt signalosome(GO:1990909) |
| 0.1 | 1.2 | GO:0045275 | mitochondrial respiratory chain complex III(GO:0005750) respiratory chain complex III(GO:0045275) |
| 0.1 | 1.2 | GO:0008541 | proteasome regulatory particle, lid subcomplex(GO:0008541) |
| 0.1 | 0.8 | GO:0000015 | phosphopyruvate hydratase complex(GO:0000015) |
| 0.1 | 0.4 | GO:0035339 | SPOTS complex(GO:0035339) |
| 0.1 | 1.9 | GO:0030057 | desmosome(GO:0030057) |
| 0.1 | 0.7 | GO:0033165 | interphotoreceptor matrix(GO:0033165) |
| 0.1 | 0.3 | GO:0001405 | presequence translocase-associated import motor(GO:0001405) |
| 0.1 | 1.2 | GO:0016328 | lateral plasma membrane(GO:0016328) |
| 0.1 | 1.7 | GO:0030175 | filopodium(GO:0030175) |
| 0.1 | 0.6 | GO:0000408 | EKC/KEOPS complex(GO:0000408) |
| 0.1 | 1.2 | GO:0005869 | dynactin complex(GO:0005869) |
| 0.1 | 0.5 | GO:0005854 | nascent polypeptide-associated complex(GO:0005854) |
| 0.1 | 1.1 | GO:0000276 | mitochondrial proton-transporting ATP synthase complex, coupling factor F(o)(GO:0000276) |
| 0.1 | 7.8 | GO:0005882 | intermediate filament(GO:0005882) |
| 0.1 | 0.3 | GO:0070195 | growth hormone receptor complex(GO:0070195) |
| 0.1 | 1.2 | GO:0005640 | nuclear outer membrane(GO:0005640) |
| 0.1 | 1.1 | GO:0036038 | MKS complex(GO:0036038) |
| 0.1 | 1.1 | GO:0042555 | MCM complex(GO:0042555) |
| 0.1 | 0.8 | GO:0031838 | haptoglobin-hemoglobin complex(GO:0031838) |
| 0.1 | 0.3 | GO:0033181 | plasma membrane proton-transporting V-type ATPase complex(GO:0033181) |
| 0.1 | 3.0 | GO:0097517 | stress fiber(GO:0001725) contractile actin filament bundle(GO:0097517) |
| 0.1 | 2.8 | GO:0005902 | microvillus(GO:0005902) |
| 0.1 | 1.2 | GO:0005666 | DNA-directed RNA polymerase III complex(GO:0005666) |
| 0.1 | 0.5 | GO:0042583 | chromaffin granule(GO:0042583) |
| 0.0 | 3.0 | GO:0034707 | chloride channel complex(GO:0034707) |
| 0.0 | 2.6 | GO:0030426 | growth cone(GO:0030426) |
| 0.0 | 1.7 | GO:0005940 | septin ring(GO:0005940) septin complex(GO:0031105) septin cytoskeleton(GO:0032156) |
| 0.0 | 0.7 | GO:0032591 | dendritic spine membrane(GO:0032591) |
| 0.0 | 1.2 | GO:0097610 | cleavage furrow(GO:0032154) cell surface furrow(GO:0097610) |
| 0.0 | 0.7 | GO:0031209 | SCAR complex(GO:0031209) |
| 0.0 | 0.8 | GO:0043195 | terminal bouton(GO:0043195) |
| 0.0 | 2.6 | GO:0030141 | secretory granule(GO:0030141) |
| 0.0 | 0.4 | GO:0071782 | endoplasmic reticulum tubular network(GO:0071782) endoplasmic reticulum subcompartment(GO:0098827) |
| 0.0 | 3.4 | GO:0044420 | extracellular matrix component(GO:0044420) |
| 0.0 | 0.5 | GO:0071564 | npBAF complex(GO:0071564) |
| 0.0 | 3.0 | GO:0005884 | actin filament(GO:0005884) |
| 0.0 | 1.4 | GO:0005811 | lipid particle(GO:0005811) |
| 0.0 | 1.1 | GO:0005747 | mitochondrial respiratory chain complex I(GO:0005747) NADH dehydrogenase complex(GO:0030964) respiratory chain complex I(GO:0045271) |
| 0.0 | 0.4 | GO:0043209 | myelin sheath(GO:0043209) |
| 0.0 | 1.5 | GO:0005581 | collagen trimer(GO:0005581) |
| 0.0 | 0.2 | GO:0030428 | cell septum(GO:0030428) |
| 0.0 | 0.2 | GO:0005952 | cAMP-dependent protein kinase complex(GO:0005952) |
| 0.0 | 0.5 | GO:0045180 | basal cortex(GO:0045180) |
| 0.0 | 0.3 | GO:0005922 | connexon complex(GO:0005922) |
| 0.0 | 5.1 | GO:0031012 | extracellular matrix(GO:0031012) |
| 0.0 | 0.1 | GO:0016234 | inclusion body(GO:0016234) |
| 0.0 | 0.5 | GO:0033017 | sarcoplasmic reticulum membrane(GO:0033017) |
| 0.0 | 0.6 | GO:0000159 | protein phosphatase type 2A complex(GO:0000159) |
| 0.0 | 0.4 | GO:0030127 | COPII vesicle coat(GO:0030127) |
| 0.0 | 0.6 | GO:0000421 | autophagosome membrane(GO:0000421) |
| 0.0 | 0.7 | GO:0017053 | transcriptional repressor complex(GO:0017053) |
| 0.0 | 0.1 | GO:0070419 | nonhomologous end joining complex(GO:0070419) |
| 0.0 | 0.7 | GO:0016342 | catenin complex(GO:0016342) |
| 0.0 | 0.5 | GO:0005861 | troponin complex(GO:0005861) |
| 0.0 | 0.1 | GO:0044613 | nuclear pore central transport channel(GO:0044613) |
| 0.0 | 0.1 | GO:0032426 | stereocilia coupling link(GO:0002139) stereocilia ankle link(GO:0002141) stereocilia ankle link complex(GO:0002142) stereocilium tip(GO:0032426) |
| 0.0 | 0.1 | GO:0034715 | pICln-Sm protein complex(GO:0034715) |
| 0.0 | 0.2 | GO:0048188 | Set1C/COMPASS complex(GO:0048188) |
| 0.0 | 1.3 | GO:0005923 | bicellular tight junction(GO:0005923) occluding junction(GO:0070160) |
Gene overrepresentation in molecular function category:
| Log-likelihood per target | Total log-likelihood | Term | Description |
|---|---|---|---|
| 0.5 | 2.1 | GO:0005173 | stem cell factor receptor binding(GO:0005173) |
| 0.4 | 2.8 | GO:0004329 | formate-tetrahydrofolate ligase activity(GO:0004329) |
| 0.4 | 1.1 | GO:0031704 | apelin receptor binding(GO:0031704) |
| 0.3 | 1.9 | GO:0004392 | heme oxygenase (decyclizing) activity(GO:0004392) |
| 0.3 | 1.2 | GO:0003884 | D-amino-acid oxidase activity(GO:0003884) |
| 0.3 | 0.9 | GO:0043395 | heparan sulfate proteoglycan binding(GO:0043395) |
| 0.3 | 1.4 | GO:0004012 | phospholipid-translocating ATPase activity(GO:0004012) phosphatidylcholine-translocating ATPase activity(GO:0090554) phosphatidylserine-translocating ATPase activity(GO:0090556) |
| 0.2 | 0.7 | GO:0031434 | mitogen-activated protein kinase kinase binding(GO:0031434) |
| 0.2 | 1.2 | GO:0008121 | ubiquinol-cytochrome-c reductase activity(GO:0008121) oxidoreductase activity, acting on diphenols and related substances as donors, cytochrome as acceptor(GO:0016681) |
| 0.2 | 1.5 | GO:0016316 | phosphatidylinositol-3,4-bisphosphate 4-phosphatase activity(GO:0016316) |
| 0.2 | 1.2 | GO:0019834 | phospholipase A2 inhibitor activity(GO:0019834) |
| 0.2 | 0.6 | GO:0008397 | sterol 12-alpha-hydroxylase activity(GO:0008397) |
| 0.2 | 0.9 | GO:0015288 | porin activity(GO:0015288) |
| 0.2 | 0.9 | GO:0046592 | polyamine oxidase activity(GO:0046592) |
| 0.2 | 1.4 | GO:0001972 | retinoic acid binding(GO:0001972) |
| 0.2 | 1.1 | GO:0008158 | hedgehog receptor activity(GO:0008158) |
| 0.2 | 1.4 | GO:0004745 | retinol dehydrogenase activity(GO:0004745) |
| 0.2 | 1.3 | GO:0043121 | neurotrophin binding(GO:0043121) |
| 0.2 | 0.5 | GO:0004422 | hypoxanthine phosphoribosyltransferase activity(GO:0004422) |
| 0.1 | 0.6 | GO:0004639 | phosphoribosylaminoimidazolesuccinocarboxamide synthase activity(GO:0004639) |
| 0.1 | 0.9 | GO:0008597 | calcium-dependent protein serine/threonine phosphatase regulator activity(GO:0008597) |
| 0.1 | 0.5 | GO:0031544 | procollagen-proline 3-dioxygenase activity(GO:0019797) peptidyl-proline 3-dioxygenase activity(GO:0031544) |
| 0.1 | 0.8 | GO:0008508 | bile acid:sodium symporter activity(GO:0008508) |
| 0.1 | 0.4 | GO:0001605 | adrenomedullin receptor activity(GO:0001605) calcitonin gene-related peptide receptor activity(GO:0001635) |
| 0.1 | 0.6 | GO:0038131 | neuregulin receptor activity(GO:0038131) neuregulin binding(GO:0038132) |
| 0.1 | 1.4 | GO:0005021 | vascular endothelial growth factor-activated receptor activity(GO:0005021) |
| 0.1 | 0.4 | GO:1990226 | histone methyltransferase binding(GO:1990226) |
| 0.1 | 1.5 | GO:0005545 | 1-phosphatidylinositol binding(GO:0005545) |
| 0.1 | 1.0 | GO:0004731 | purine-nucleoside phosphorylase activity(GO:0004731) |
| 0.1 | 0.7 | GO:0019215 | intermediate filament binding(GO:0019215) |
| 0.1 | 1.2 | GO:0008429 | phosphatidylethanolamine binding(GO:0008429) |
| 0.1 | 0.4 | GO:0005153 | interleukin-8 receptor binding(GO:0005153) |
| 0.1 | 14.1 | GO:0005201 | extracellular matrix structural constituent(GO:0005201) |
| 0.1 | 0.6 | GO:0004862 | cAMP-dependent protein kinase inhibitor activity(GO:0004862) |
| 0.1 | 0.8 | GO:0004634 | phosphopyruvate hydratase activity(GO:0004634) |
| 0.1 | 0.5 | GO:0004385 | guanylate kinase activity(GO:0004385) |
| 0.1 | 1.0 | GO:0005391 | sodium:potassium-exchanging ATPase activity(GO:0005391) |
| 0.1 | 2.3 | GO:0004623 | phospholipase A2 activity(GO:0004623) |
| 0.1 | 0.6 | GO:0019809 | spermidine binding(GO:0019809) |
| 0.1 | 1.1 | GO:0042285 | xylosyltransferase activity(GO:0042285) |
| 0.1 | 0.8 | GO:0004791 | thioredoxin-disulfide reductase activity(GO:0004791) |
| 0.1 | 0.5 | GO:0030548 | acetylcholine receptor regulator activity(GO:0030548) neurotransmitter receptor regulator activity(GO:0099602) |
| 0.1 | 2.3 | GO:0048306 | calcium-dependent protein binding(GO:0048306) |
| 0.1 | 0.4 | GO:1990756 | protein binding, bridging involved in substrate recognition for ubiquitination(GO:1990756) |
| 0.1 | 0.3 | GO:0046556 | alpha-L-arabinofuranosidase activity(GO:0046556) |
| 0.1 | 5.9 | GO:0005212 | structural constituent of eye lens(GO:0005212) |
| 0.1 | 0.2 | GO:0005502 | 11-cis retinal binding(GO:0005502) |
| 0.1 | 1.0 | GO:0008503 | benzodiazepine receptor activity(GO:0008503) GABA-gated chloride ion channel activity(GO:0022851) |
| 0.1 | 1.4 | GO:0051371 | muscle alpha-actinin binding(GO:0051371) alpha-actinin binding(GO:0051393) |
| 0.1 | 0.3 | GO:0004903 | growth hormone receptor activity(GO:0004903) |
| 0.1 | 0.5 | GO:0030274 | LIM domain binding(GO:0030274) |
| 0.1 | 0.2 | GO:0000810 | diacylglycerol diphosphate phosphatase activity(GO:0000810) |
| 0.1 | 0.6 | GO:0004359 | glutaminase activity(GO:0004359) |
| 0.1 | 0.3 | GO:0003989 | acetyl-CoA carboxylase activity(GO:0003989) |
| 0.1 | 0.2 | GO:0005183 | gonadotropin hormone-releasing hormone activity(GO:0005183) gonadotropin-releasing hormone receptor binding(GO:0031530) |
| 0.1 | 1.3 | GO:0003785 | actin monomer binding(GO:0003785) |
| 0.1 | 0.8 | GO:0031720 | haptoglobin binding(GO:0031720) |
| 0.1 | 0.9 | GO:0008510 | sodium:bicarbonate symporter activity(GO:0008510) |
| 0.1 | 1.3 | GO:0080025 | phosphatidylinositol-3,5-bisphosphate binding(GO:0080025) |
| 0.1 | 0.7 | GO:0015186 | L-glutamine transmembrane transporter activity(GO:0015186) |
| 0.1 | 0.3 | GO:0004999 | vasoactive intestinal polypeptide receptor activity(GO:0004999) |
| 0.1 | 0.8 | GO:0030506 | ankyrin binding(GO:0030506) |
| 0.1 | 2.5 | GO:0005200 | structural constituent of cytoskeleton(GO:0005200) |
| 0.1 | 0.3 | GO:1990380 | Lys48-specific deubiquitinase activity(GO:1990380) |
| 0.1 | 0.2 | GO:0097643 | calcitonin receptor activity(GO:0004948) calcitonin family receptor activity(GO:0097642) amylin receptor activity(GO:0097643) |
| 0.1 | 1.1 | GO:0003810 | protein-glutamine gamma-glutamyltransferase activity(GO:0003810) |
| 0.1 | 0.4 | GO:0016721 | superoxide dismutase activity(GO:0004784) oxidoreductase activity, acting on superoxide radicals as acceptor(GO:0016721) |
| 0.1 | 0.7 | GO:0008330 | protein tyrosine/threonine phosphatase activity(GO:0008330) |
| 0.1 | 0.2 | GO:0004133 | glycogen debranching enzyme activity(GO:0004133) 4-alpha-glucanotransferase activity(GO:0004134) amylo-alpha-1,6-glucosidase activity(GO:0004135) |
| 0.1 | 0.4 | GO:0001130 | bacterial-type RNA polymerase transcription factor activity, sequence-specific DNA binding(GO:0001130) bacterial-type RNA polymerase transcriptional repressor activity, sequence-specific DNA binding(GO:0001217) |
| 0.0 | 2.3 | GO:0031593 | polyubiquitin binding(GO:0031593) |
| 0.0 | 0.3 | GO:0050998 | nitric-oxide synthase binding(GO:0050998) |
| 0.0 | 1.1 | GO:0003688 | DNA replication origin binding(GO:0003688) |
| 0.0 | 0.3 | GO:0036402 | proteasome-activating ATPase activity(GO:0036402) |
| 0.0 | 0.7 | GO:0015026 | coreceptor activity(GO:0015026) |
| 0.0 | 0.3 | GO:0050262 | ribosylnicotinamide kinase activity(GO:0050262) |
| 0.0 | 2.7 | GO:0005484 | SNAP receptor activity(GO:0005484) |
| 0.0 | 0.4 | GO:0032036 | myosin heavy chain binding(GO:0032036) |
| 0.0 | 0.3 | GO:0003854 | 3-beta-hydroxy-delta5-steroid dehydrogenase activity(GO:0003854) |
| 0.0 | 1.5 | GO:0004869 | cysteine-type endopeptidase inhibitor activity(GO:0004869) |
| 0.0 | 0.2 | GO:0032422 | purine-rich negative regulatory element binding(GO:0032422) |
| 0.0 | 0.3 | GO:0000774 | adenyl-nucleotide exchange factor activity(GO:0000774) |
| 0.0 | 0.1 | GO:0051500 | D-aminoacyl-tRNA deacylase activity(GO:0051499) D-tyrosyl-tRNA(Tyr) deacylase activity(GO:0051500) |
| 0.0 | 0.4 | GO:0005007 | fibroblast growth factor-activated receptor activity(GO:0005007) |
| 0.0 | 0.1 | GO:0008905 | mannose-1-phosphate guanylyltransferase activity(GO:0004475) mannose-phosphate guanylyltransferase activity(GO:0008905) |
| 0.0 | 0.8 | GO:0005112 | Notch binding(GO:0005112) |
| 0.0 | 1.2 | GO:0050840 | extracellular matrix binding(GO:0050840) |
| 0.0 | 1.2 | GO:0004864 | protein phosphatase inhibitor activity(GO:0004864) |
| 0.0 | 3.1 | GO:0004867 | serine-type endopeptidase inhibitor activity(GO:0004867) |
| 0.0 | 0.7 | GO:0004806 | triglyceride lipase activity(GO:0004806) |
| 0.0 | 0.4 | GO:0019911 | structural constituent of myelin sheath(GO:0019911) |
| 0.0 | 1.0 | GO:0019003 | GDP binding(GO:0019003) |
| 0.0 | 0.7 | GO:0030165 | PDZ domain binding(GO:0030165) |
| 0.0 | 0.4 | GO:0045028 | G-protein coupled nucleotide receptor activity(GO:0001608) G-protein coupled purinergic nucleotide receptor activity(GO:0045028) |
| 0.0 | 0.6 | GO:0005154 | epidermal growth factor receptor binding(GO:0005154) |
| 0.0 | 0.4 | GO:0000340 | RNA 7-methylguanosine cap binding(GO:0000340) |
| 0.0 | 0.3 | GO:0004622 | lysophospholipase activity(GO:0004622) |
| 0.0 | 1.0 | GO:0005109 | frizzled binding(GO:0005109) |
| 0.0 | 0.4 | GO:0070003 | threonine-type endopeptidase activity(GO:0004298) threonine-type peptidase activity(GO:0070003) |
| 0.0 | 0.7 | GO:0005540 | hyaluronic acid binding(GO:0005540) |
| 0.0 | 0.2 | GO:0004100 | chitin synthase activity(GO:0004100) |
| 0.0 | 2.1 | GO:0045296 | cadherin binding(GO:0045296) |
| 0.0 | 0.1 | GO:0034618 | arginine binding(GO:0034618) |
| 0.0 | 8.7 | GO:0005198 | structural molecule activity(GO:0005198) |
| 0.0 | 0.5 | GO:0051787 | misfolded protein binding(GO:0051787) |
| 0.0 | 0.6 | GO:0004550 | nucleoside diphosphate kinase activity(GO:0004550) |
| 0.0 | 0.3 | GO:0005243 | gap junction channel activity(GO:0005243) |
| 0.0 | 0.2 | GO:0052794 | exo-alpha-(2->3)-sialidase activity(GO:0052794) exo-alpha-(2->6)-sialidase activity(GO:0052795) exo-alpha-(2->8)-sialidase activity(GO:0052796) |
| 0.0 | 0.1 | GO:0015218 | pyrimidine nucleotide transmembrane transporter activity(GO:0015218) |
| 0.0 | 0.2 | GO:0004046 | aminoacylase activity(GO:0004046) |
| 0.0 | 0.6 | GO:0005184 | neuropeptide hormone activity(GO:0005184) |
| 0.0 | 0.4 | GO:0004698 | protein kinase C activity(GO:0004697) calcium-dependent protein kinase C activity(GO:0004698) |
| 0.0 | 1.0 | GO:0051427 | hormone receptor binding(GO:0051427) |
| 0.0 | 0.6 | GO:0005178 | integrin binding(GO:0005178) |
| 0.0 | 2.0 | GO:0004879 | RNA polymerase II transcription factor activity, ligand-activated sequence-specific DNA binding(GO:0004879) |
| 0.0 | 0.5 | GO:0004364 | glutathione transferase activity(GO:0004364) |
| 0.0 | 0.5 | GO:0042162 | telomeric DNA binding(GO:0042162) |
| 0.0 | 0.1 | GO:0035312 | 5'-3' exodeoxyribonuclease activity(GO:0035312) |
| 0.0 | 0.0 | GO:0016672 | oxidoreductase activity, acting on a sulfur group of donors, quinone or similar compound as acceptor(GO:0016672) sulfide:quinone oxidoreductase activity(GO:0070224) |
| 0.0 | 0.1 | GO:0015355 | secondary active monocarboxylate transmembrane transporter activity(GO:0015355) |
| 0.0 | 0.1 | GO:0004726 | non-membrane spanning protein tyrosine phosphatase activity(GO:0004726) |
| 0.0 | 0.1 | GO:0004105 | choline-phosphate cytidylyltransferase activity(GO:0004105) |
| 0.0 | 0.2 | GO:0004955 | prostaglandin receptor activity(GO:0004955) |
| 0.0 | 1.9 | GO:0004222 | metalloendopeptidase activity(GO:0004222) |
| 0.0 | 0.7 | GO:0030215 | semaphorin receptor binding(GO:0030215) |
| 0.0 | 0.2 | GO:0005523 | tropomyosin binding(GO:0005523) |
| 0.0 | 1.0 | GO:0005254 | chloride channel activity(GO:0005254) |
| 0.0 | 0.4 | GO:0005164 | tumor necrosis factor receptor binding(GO:0005164) |
| 0.0 | 0.1 | GO:0032977 | membrane insertase activity(GO:0032977) |
| 0.0 | 0.2 | GO:0070492 | oligosaccharide binding(GO:0070492) |
| 0.0 | 0.5 | GO:0015485 | cholesterol binding(GO:0015485) |
| 0.0 | 0.2 | GO:0050291 | sphingosine N-acyltransferase activity(GO:0050291) |
Gene overrepresentation in curated gene sets: canonical pathways category:
| Log-likelihood per target | Total log-likelihood | Term | Description |
|---|---|---|---|
| 0.2 | 2.7 | PID INTEGRIN2 PATHWAY | Beta2 integrin cell surface interactions |
| 0.1 | 3.4 | PID FRA PATHWAY | Validated transcriptional targets of AP1 family members Fra1 and Fra2 |
| 0.1 | 0.6 | PID VEGF VEGFR PATHWAY | VEGF and VEGFR signaling network |
| 0.1 | 1.5 | PID HES HEY PATHWAY | Notch-mediated HES/HEY network |
| 0.1 | 1.0 | ST INTEGRIN SIGNALING PATHWAY | Integrin Signaling Pathway |
| 0.1 | 0.5 | PID TCR CALCIUM PATHWAY | Calcium signaling in the CD4+ TCR pathway |
| 0.0 | 2.0 | PID TAP63 PATHWAY | Validated transcriptional targets of TAp63 isoforms |
| 0.0 | 0.9 | PID NFAT TFPATHWAY | Calcineurin-regulated NFAT-dependent transcription in lymphocytes |
| 0.0 | 0.2 | PID INSULIN PATHWAY | Insulin Pathway |
| 0.0 | 2.1 | PID NOTCH PATHWAY | Notch signaling pathway |
| 0.0 | 0.9 | PID PRL SIGNALING EVENTS PATHWAY | Signaling events mediated by PRL |
| 0.0 | 1.3 | PID HIF1 TFPATHWAY | HIF-1-alpha transcription factor network |
| 0.0 | 0.6 | PID MAPK TRK PATHWAY | Trk receptor signaling mediated by the MAPK pathway |
| 0.0 | 3.1 | NABA ECM GLYCOPROTEINS | Genes encoding structural ECM glycoproteins |
| 0.0 | 0.4 | ST GRANULE CELL SURVIVAL PATHWAY | Granule Cell Survival Pathway is a specific case of more general PAC1 Receptor Pathway. |
| 0.0 | 0.5 | ST ERK1 ERK2 MAPK PATHWAY | ERK1/ERK2 MAPK Pathway |
| 0.0 | 0.7 | PID ECADHERIN NASCENT AJ PATHWAY | E-cadherin signaling in the nascent adherens junction |
| 0.0 | 0.6 | PID PTP1B PATHWAY | Signaling events mediated by PTP1B |
| 0.0 | 1.0 | PID E2F PATHWAY | E2F transcription factor network |
| 0.0 | 0.5 | PID SMAD2 3NUCLEAR PATHWAY | Regulation of nuclear SMAD2/3 signaling |
| 0.0 | 0.3 | PID AR TF PATHWAY | Regulation of Androgen receptor activity |
| 0.0 | 0.5 | PID MYC REPRESS PATHWAY | Validated targets of C-MYC transcriptional repression |
| 0.0 | 0.5 | NABA COLLAGENS | Genes encoding collagen proteins |
| 0.0 | 0.4 | PID P75 NTR PATHWAY | p75(NTR)-mediated signaling |
| 0.0 | 0.2 | PID WNT SIGNALING PATHWAY | Wnt signaling network |
Gene overrepresentation in curated gene sets: REACTOME pathways category:
| Log-likelihood per target | Total log-likelihood | Term | Description |
|---|---|---|---|
| 0.2 | 1.5 | REACTOME DEGRADATION OF THE EXTRACELLULAR MATRIX | Genes involved in Degradation of the extracellular matrix |
| 0.2 | 2.4 | REACTOME COMMON PATHWAY | Genes involved in Common Pathway |
| 0.1 | 0.7 | REACTOME GLUTAMATE NEUROTRANSMITTER RELEASE CYCLE | Genes involved in Glutamate Neurotransmitter Release Cycle |
| 0.1 | 0.8 | REACTOME RECEPTOR LIGAND BINDING INITIATES THE SECOND PROTEOLYTIC CLEAVAGE OF NOTCH RECEPTOR | Genes involved in Receptor-ligand binding initiates the second proteolytic cleavage of Notch receptor |
| 0.1 | 0.6 | REACTOME VEGF LIGAND RECEPTOR INTERACTIONS | Genes involved in VEGF ligand-receptor interactions |
| 0.1 | 1.1 | REACTOME UNWINDING OF DNA | Genes involved in Unwinding of DNA |
| 0.1 | 1.3 | REACTOME POST CHAPERONIN TUBULIN FOLDING PATHWAY | Genes involved in Post-chaperonin tubulin folding pathway |
| 0.1 | 0.8 | REACTOME CS DS DEGRADATION | Genes involved in CS/DS degradation |
| 0.1 | 0.3 | REACTOME SYNTHESIS OF BILE ACIDS AND BILE SALTS VIA 24 HYDROXYCHOLESTEROL | Genes involved in Synthesis of bile acids and bile salts via 24-hydroxycholesterol |
| 0.1 | 0.7 | REACTOME ERKS ARE INACTIVATED | Genes involved in ERKs are inactivated |
| 0.1 | 0.9 | REACTOME REGULATION OF HYPOXIA INDUCIBLE FACTOR HIF BY OXYGEN | Genes involved in Regulation of Hypoxia-inducible Factor (HIF) by Oxygen |
| 0.0 | 0.8 | REACTOME RNA POL III CHAIN ELONGATION | Genes involved in RNA Polymerase III Chain Elongation |
| 0.0 | 0.7 | REACTOME METABOLISM OF POLYAMINES | Genes involved in Metabolism of polyamines |
| 0.0 | 0.7 | REACTOME GLYCOLYSIS | Genes involved in Glycolysis |
| 0.0 | 0.6 | REACTOME PURINE RIBONUCLEOSIDE MONOPHOSPHATE BIOSYNTHESIS | Genes involved in Purine ribonucleoside monophosphate biosynthesis |
| 0.0 | 0.6 | REACTOME GABA A RECEPTOR ACTIVATION | Genes involved in GABA A receptor activation |
| 0.0 | 2.3 | REACTOME RESPIRATORY ELECTRON TRANSPORT | Genes involved in Respiratory electron transport |
| 0.0 | 0.2 | REACTOME OPSINS | Genes involved in Opsins |
| 0.0 | 0.2 | REACTOME PROSTANOID LIGAND RECEPTORS | Genes involved in Prostanoid ligand receptors |
| 0.0 | 0.4 | REACTOME P2Y RECEPTORS | Genes involved in P2Y receptors |
| 0.0 | 1.3 | REACTOME NUCLEAR RECEPTOR TRANSCRIPTION PATHWAY | Genes involved in Nuclear Receptor transcription pathway |
| 0.0 | 1.0 | REACTOME VIF MEDIATED DEGRADATION OF APOBEC3G | Genes involved in Vif-mediated degradation of APOBEC3G |
| 0.0 | 0.4 | REACTOME NA CL DEPENDENT NEUROTRANSMITTER TRANSPORTERS | Genes involved in Na+/Cl- dependent neurotransmitter transporters |
| 0.0 | 0.4 | REACTOME SMOOTH MUSCLE CONTRACTION | Genes involved in Smooth Muscle Contraction |
| 0.0 | 0.2 | REACTOME AMINO ACID SYNTHESIS AND INTERCONVERSION TRANSAMINATION | Genes involved in Amino acid synthesis and interconversion (transamination) |
| 0.0 | 0.9 | REACTOME CLASS B 2 SECRETIN FAMILY RECEPTORS | Genes involved in Class B/2 (Secretin family receptors) |
| 0.0 | 0.1 | REACTOME BETA DEFENSINS | Genes involved in Beta defensins |
| 0.0 | 0.8 | REACTOME RESPONSE TO ELEVATED PLATELET CYTOSOLIC CA2 | Genes involved in Response to elevated platelet cytosolic Ca2+ |
| 0.0 | 0.5 | REACTOME O LINKED GLYCOSYLATION OF MUCINS | Genes involved in O-linked glycosylation of mucins |
| 0.0 | 1.0 | REACTOME PEPTIDE LIGAND BINDING RECEPTORS | Genes involved in Peptide ligand-binding receptors |
| 0.0 | 0.6 | REACTOME EXTRACELLULAR MATRIX ORGANIZATION | Genes involved in Extracellular matrix organization |