Project
PRJNA195909:zebrafish embryo and larva development
Navigation
Downloads
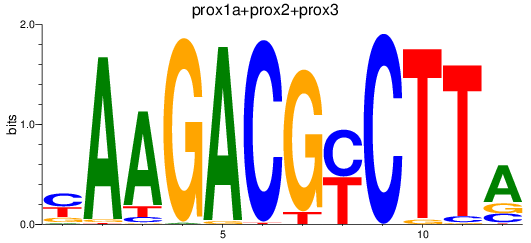
Results for prox1a+prox2+prox3
Z-value: 0.64
Motif logo
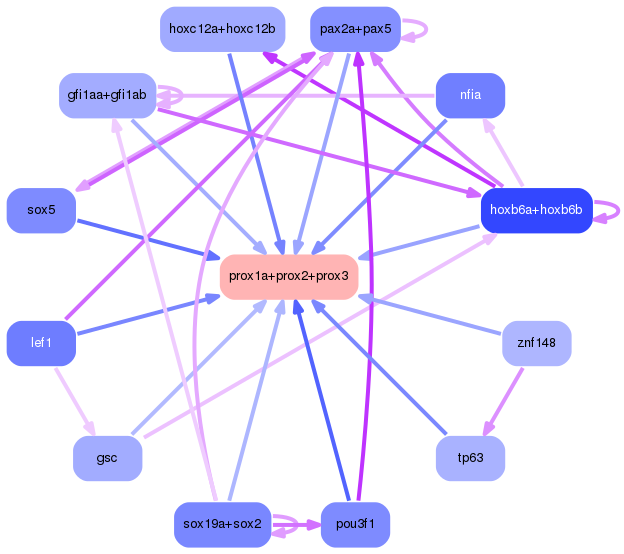
Transcription factors associated with prox1a+prox2+prox3
| Gene Symbol | Gene ID | Gene Info |
|---|---|---|
|
prox2
|
ENSDARG00000041952 | prospero homeobox 2 |
|
prox1a
|
ENSDARG00000055158 | prospero homeobox 1a |
|
prox3
|
ENSDARG00000088810 | prospero homeobox 3 |
|
prox3
|
ENSDARG00000113014 | prospero homeobox 3 |
|
prox2
|
ENSDARG00000117137 | prospero homeobox 2 |
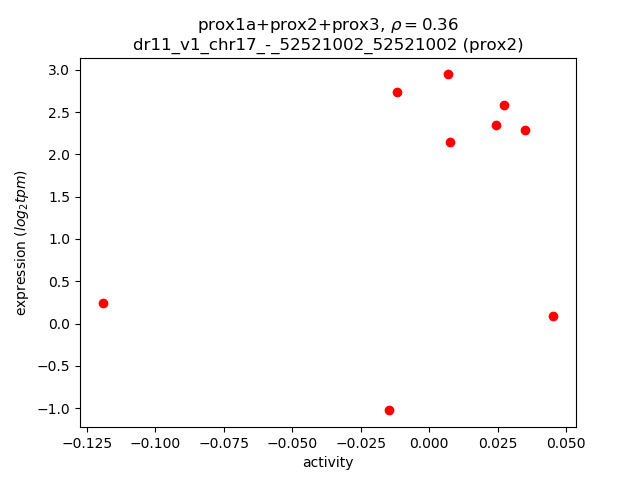
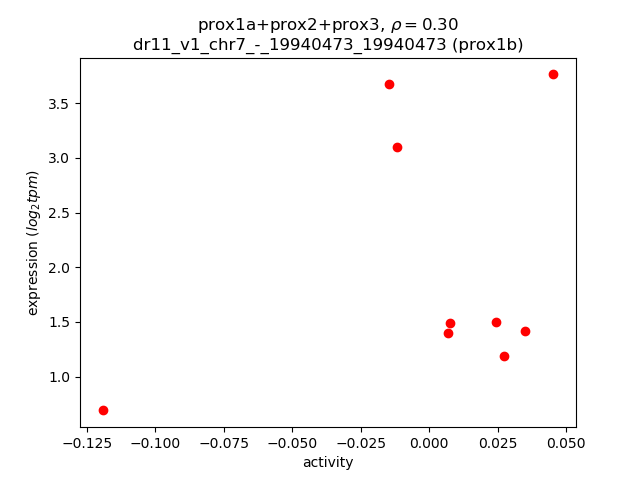
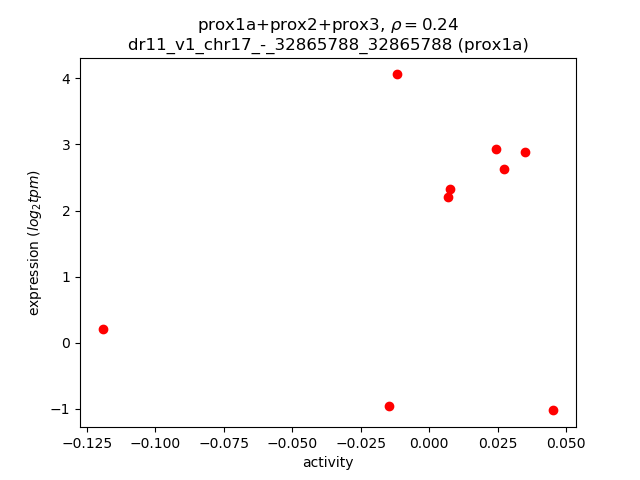
Activity-expression correlation:
| Gene | Promoter | Pearson corr. coef. | P-value | Plot |
|---|---|---|---|---|
| prox2 | dr11_v1_chr17_-_52521002_52521002 | 0.36 | 3.5e-01 | Click! |
| prox1b | dr11_v1_chr7_-_19940473_19940473 | 0.30 | 4.3e-01 | Click! |
| prox1a | dr11_v1_chr17_-_32865788_32865788 | 0.24 | 5.4e-01 | Click! |
Activity profile of prox1a+prox2+prox3 motif
Sorted Z-values of prox1a+prox2+prox3 motif
| Promoter | Log-likelihood | Transcript | Gene | Gene Info |
|---|---|---|---|---|
| chr7_+_29952169 | 1.02 |
ENSDART00000173540
ENSDART00000173940 ENSDART00000173906 ENSDART00000173772 ENSDART00000173506 ENSDART00000039657 |
tpma
|
alpha-tropomyosin |
| chr7_+_29951997 | 0.82 |
ENSDART00000173453
|
tpma
|
alpha-tropomyosin |
| chr10_-_31782616 | 0.63 |
ENSDART00000128839
|
fez1
|
fasciculation and elongation protein zeta 1 (zygin I) |
| chr9_-_23033818 | 0.62 |
ENSDART00000022392
|
rnd3b
|
Rho family GTPase 3b |
| chr2_+_2470687 | 0.61 |
ENSDART00000184024
ENSDART00000061955 |
myl13
|
myosin, light chain 13 |
| chr1_+_44442140 | 0.52 |
ENSDART00000190592
|
crybb1l2
|
crystallin, beta B1, like 2 |
| chr15_+_32711663 | 0.45 |
ENSDART00000157854
ENSDART00000167515 |
postnb
|
periostin, osteoblast specific factor b |
| chr2_+_25658112 | 0.42 |
ENSDART00000051234
|
tnika
|
TRAF2 and NCK interacting kinase a |
| chr19_+_42886413 | 0.39 |
ENSDART00000151298
|
arpp21
|
cAMP-regulated phosphoprotein, 21 |
| chr9_-_42696408 | 0.38 |
ENSDART00000144744
|
col5a2a
|
collagen, type V, alpha 2a |
| chr3_-_59981162 | 0.38 |
ENSDART00000128790
|
cdr2l
|
cerebellar degeneration-related protein 2-like |
| chr25_+_22587306 | 0.36 |
ENSDART00000067479
|
stra6
|
stimulated by retinoic acid 6 |
| chr20_-_40717900 | 0.34 |
ENSDART00000181663
|
cx43
|
connexin 43 |
| chr11_-_24681292 | 0.31 |
ENSDART00000089601
|
olfml3b
|
olfactomedin-like 3b |
| chr23_+_35672542 | 0.30 |
ENSDART00000046268
|
pmelb
|
premelanosome protein b |
| chr19_+_46372115 | 0.30 |
ENSDART00000163935
|
med30
|
mediator complex subunit 30 |
| chr5_+_27440325 | 0.29 |
ENSDART00000185815
ENSDART00000144013 |
loxl2b
|
lysyl oxidase-like 2b |
| chr21_-_13972745 | 0.29 |
ENSDART00000143874
|
akna
|
AT-hook transcription factor |
| chr19_-_21766461 | 0.28 |
ENSDART00000104279
|
znf516
|
zinc finger protein 516 |
| chr15_+_32249062 | 0.26 |
ENSDART00000133867
ENSDART00000152545 ENSDART00000082315 ENSDART00000152513 ENSDART00000152139 |
arfip2a
|
ADP-ribosylation factor interacting protein 2a |
| chr6_+_3934738 | 0.25 |
ENSDART00000159673
|
dync1i2b
|
dynein, cytoplasmic 1, intermediate chain 2b |
| chr11_-_23219367 | 0.25 |
ENSDART00000003646
|
optc
|
opticin |
| chr12_-_31422433 | 0.25 |
ENSDART00000186075
ENSDART00000153172 ENSDART00000066256 |
vti1a
|
vesicle transport through interaction with t-SNAREs 1A |
| chr17_-_5583345 | 0.24 |
ENSDART00000035944
|
clic5a
|
chloride intracellular channel 5a |
| chr12_-_23365737 | 0.24 |
ENSDART00000170376
|
mpp7a
|
membrane protein, palmitoylated 7a (MAGUK p55 subfamily member 7) |
| chr21_+_22124736 | 0.24 |
ENSDART00000130179
ENSDART00000172573 |
cul5b
|
cullin 5b |
| chr1_-_59065217 | 0.24 |
ENSDART00000188972
|
CABZ01080042.1
|
|
| chr3_+_22578369 | 0.22 |
ENSDART00000187695
ENSDART00000182678 ENSDART00000112270 |
tanc2a
|
tetratricopeptide repeat, ankyrin repeat and coiled-coil containing 2a |
| chr12_+_27117609 | 0.22 |
ENSDART00000076154
|
hoxb8b
|
homeobox B8b |
| chr23_+_36118738 | 0.22 |
ENSDART00000139319
|
hoxc5a
|
homeobox C5a |
| chr5_-_62306819 | 0.22 |
ENSDART00000168993
|
spata22
|
spermatogenesis associated 22 |
| chr9_+_21401189 | 0.21 |
ENSDART00000062669
|
cx30.3
|
connexin 30.3 |
| chr23_+_16889352 | 0.21 |
ENSDART00000145275
|
si:dkey-147f3.8
|
si:dkey-147f3.8 |
| chr2_+_6885852 | 0.20 |
ENSDART00000016607
|
rgs5b
|
regulator of G protein signaling 5b |
| chr2_+_50722439 | 0.20 |
ENSDART00000188927
|
fyco1b
|
FYVE and coiled-coil domain containing 1b |
| chr15_-_23475051 | 0.19 |
ENSDART00000152460
|
nlrx1
|
NLR family member X1 |
| chr17_+_15674052 | 0.18 |
ENSDART00000156726
|
bach2a
|
BTB and CNC homology 1, basic leucine zipper transcription factor 2a |
| chr23_+_13124085 | 0.18 |
ENSDART00000139475
|
samd10b
|
sterile alpha motif domain containing 10b |
| chr14_+_9287683 | 0.17 |
ENSDART00000122485
|
msnb
|
moesin b |
| chr3_+_21200763 | 0.15 |
ENSDART00000067841
|
zgc:112038
|
zgc:112038 |
| chr8_-_47800754 | 0.15 |
ENSDART00000115050
ENSDART00000133669 |
kank3
|
KN motif and ankyrin repeat domains 3 |
| chr19_-_13950231 | 0.15 |
ENSDART00000168665
|
sh3bgrl3
|
SH3 domain binding glutamate-rich protein like 3 |
| chr1_-_9485939 | 0.15 |
ENSDART00000157814
|
micall2b
|
mical-like 2b |
| chr1_-_9486214 | 0.14 |
ENSDART00000137821
|
micall2b
|
mical-like 2b |
| chr23_+_216012 | 0.14 |
ENSDART00000181115
ENSDART00000004678 ENSDART00000190439 ENSDART00000189322 |
PDZD4
|
si:ch73-162j3.4 |
| chr23_+_45845423 | 0.13 |
ENSDART00000183404
|
lmnl3
|
lamin L3 |
| chr19_-_31042570 | 0.13 |
ENSDART00000144337
ENSDART00000136213 ENSDART00000133101 ENSDART00000190949 |
bzw2
|
basic leucine zipper and W2 domains 2 |
| chr7_+_57866292 | 0.13 |
ENSDART00000138757
|
camk2d1
|
calcium/calmodulin-dependent protein kinase (CaM kinase) II delta 1 |
| chr23_+_21663631 | 0.13 |
ENSDART00000066125
|
dhrs3a
|
dehydrogenase/reductase (SDR family) member 3a |
| chr10_+_43037064 | 0.11 |
ENSDART00000160159
|
atg10
|
ATG10 autophagy related 10 homolog (S. cerevisiae) |
| chr16_+_39196727 | 0.10 |
ENSDART00000017017
|
zdhhc3a
|
zinc finger, DHHC-type containing 3a |
| chr19_-_22621811 | 0.10 |
ENSDART00000090669
|
pleca
|
plectin a |
| chr8_+_47219107 | 0.10 |
ENSDART00000146018
ENSDART00000075068 |
mthfr
|
methylenetetrahydrofolate reductase (NAD(P)H) |
| chr14_-_30971264 | 0.10 |
ENSDART00000010512
|
zgc:92907
|
zgc:92907 |
| chr8_+_11325310 | 0.09 |
ENSDART00000142577
|
fxn
|
frataxin |
| chr5_+_13870340 | 0.08 |
ENSDART00000160690
|
hk2
|
hexokinase 2 |
| chr23_-_13877898 | 0.07 |
ENSDART00000138696
|
g6pd
|
glucose-6-phosphate dehydrogenase |
| chr25_+_8407892 | 0.07 |
ENSDART00000153536
|
muc5.2
|
mucin 5.2 |
| chr10_-_38316134 | 0.07 |
ENSDART00000149580
|
nrip1b
|
nuclear receptor interacting protein 1b |
| chr4_+_20177526 | 0.07 |
ENSDART00000017947
ENSDART00000135451 |
ccdc146
|
coiled-coil domain containing 146 |
| chr6_+_11250033 | 0.07 |
ENSDART00000065411
ENSDART00000132677 |
atg9a
|
ATG9 autophagy related 9 homolog A (S. cerevisiae) |
| chr5_+_22510639 | 0.07 |
ENSDART00000080919
|
rpl36a
|
ribosomal protein L36A |
| chr10_+_29431529 | 0.07 |
ENSDART00000158154
|
dlg2
|
discs, large homolog 2 (Drosophila) |
| chrM_+_9052 | 0.06 |
ENSDART00000093612
|
mt-atp6
|
ATP synthase 6, mitochondrial |
| chr7_-_44604540 | 0.06 |
ENSDART00000149186
|
tk2
|
thymidine kinase 2, mitochondrial |
| chr7_-_44605050 | 0.06 |
ENSDART00000148471
ENSDART00000149072 |
tk2
|
thymidine kinase 2, mitochondrial |
| chr7_+_19562045 | 0.06 |
ENSDART00000077545
|
slc7a7
|
solute carrier family 7 (amino acid transporter light chain, y+L system), member 7 |
| chr17_-_20979077 | 0.06 |
ENSDART00000006676
|
phyhipla
|
phytanoyl-CoA 2-hydroxylase interacting protein-like a |
| chr10_-_20637098 | 0.06 |
ENSDART00000080391
|
sprn2
|
shadow of prion protein 2 |
| chr20_-_54014373 | 0.06 |
ENSDART00000152934
|
si:dkey-241l7.6
|
si:dkey-241l7.6 |
| chr6_-_34006917 | 0.05 |
ENSDART00000190702
ENSDART00000184003 |
tie1
|
tyrosine kinase with immunoglobulin-like and EGF-like domains 1 |
| chr20_+_38201644 | 0.05 |
ENSDART00000022694
|
ehd3
|
EH-domain containing 3 |
| chr8_+_2773776 | 0.05 |
ENSDART00000156796
ENSDART00000154529 ENSDART00000155092 |
sh3glb2a
|
SH3-domain GRB2-like endophilin B2a |
| chr19_+_19989380 | 0.05 |
ENSDART00000142841
|
osbpl3a
|
oxysterol binding protein-like 3a |
| chr8_-_49345388 | 0.05 |
ENSDART00000053203
|
plp2
|
proteolipid protein 2 |
| chr18_-_44611252 | 0.04 |
ENSDART00000173095
|
spred3
|
sprouty-related, EVH1 domain containing 3 |
| chr5_+_37517800 | 0.04 |
ENSDART00000048107
|
FP102018.1
|
Danio rerio latent transforming growth factor beta binding protein 3 (ltbp3), mRNA. |
| chr19_-_22621991 | 0.04 |
ENSDART00000175106
|
pleca
|
plectin a |
| chr17_+_48164536 | 0.03 |
ENSDART00000161750
ENSDART00000156923 |
plekhd1
|
pleckstrin homology domain containing, family D (with coiled-coil domains) member 1 |
| chr5_+_42136359 | 0.03 |
ENSDART00000083731
|
trpv1
|
transient receptor potential cation channel, subfamily V, member 1 |
| chr5_-_69707787 | 0.03 |
ENSDART00000108820
ENSDART00000149692 |
dguok
|
deoxyguanosine kinase |
| chr8_+_30600386 | 0.03 |
ENSDART00000164976
|
specc1la
|
sperm antigen with calponin homology and coiled-coil domains 1-like a |
| chr3_+_22335030 | 0.03 |
ENSDART00000055676
|
zgc:103564
|
zgc:103564 |
| chr21_+_21791343 | 0.03 |
ENSDART00000151654
|
neu3.1
|
sialidase 3 (membrane sialidase), tandem duplicate 1 |
| chr17_-_10059557 | 0.03 |
ENSDART00000092209
ENSDART00000161243 |
baz1a
|
bromodomain adjacent to zinc finger domain, 1A |
| chr18_+_16750080 | 0.03 |
ENSDART00000136320
|
rnf141
|
ring finger protein 141 |
| chr24_-_18809433 | 0.03 |
ENSDART00000152009
|
arfgef1
|
ADP-ribosylation factor guanine nucleotide-exchange factor 1 (brefeldin A-inhibited) |
| chr1_-_37087966 | 0.02 |
ENSDART00000172111
ENSDART00000160056 |
nr3c2
|
nuclear receptor subfamily 3, group C, member 2 |
| chr15_+_31735931 | 0.02 |
ENSDART00000185681
ENSDART00000149137 |
rxfp2b
|
relaxin/insulin-like family peptide receptor 2b |
| chr10_-_36254445 | 0.02 |
ENSDART00000123571
|
or110-2
|
odorant receptor, family D, subfamily 110, member 2 |
| chr10_+_7719796 | 0.02 |
ENSDART00000191795
|
ggcx
|
gamma-glutamyl carboxylase |
| chr17_-_37195354 | 0.02 |
ENSDART00000190963
|
asxl2
|
additional sex combs like transcriptional regulator 2 |
| chr22_+_17286841 | 0.01 |
ENSDART00000133176
|
FAM163A
|
si:dkey-171o17.8 |
| chr7_+_7019911 | 0.01 |
ENSDART00000172421
|
rbm14b
|
RNA binding motif protein 14b |
| chr25_+_19947298 | 0.01 |
ENSDART00000067648
|
kcna6a
|
potassium voltage-gated channel, shaker-related, subfamily, member 6 a |
| chr17_+_5616826 | 0.00 |
ENSDART00000178720
|
fam167aa
|
family with sequence similarity 167, member Aa |
| chr15_-_31177324 | 0.00 |
ENSDART00000008854
|
wsb1
|
WD repeat and SOCS box containing 1 |
Network of associatons between targets according to the STRING database.

First level regulatory network of prox1a+prox2+prox3
Gene Ontology Analysis
Gene overrepresentation in biological process category:
| Log-likelihood per target | Total log-likelihood | Term | Description |
|---|---|---|---|
| 0.1 | 0.3 | GO:1902455 | negative regulation of stem cell population maintenance(GO:1902455) |
| 0.1 | 0.2 | GO:0000711 | meiotic DNA repair synthesis(GO:0000711) |
| 0.1 | 0.4 | GO:0071939 | vitamin A transport(GO:0071938) vitamin A import(GO:0071939) |
| 0.0 | 0.2 | GO:1901098 | positive regulation of autophagosome maturation(GO:1901098) |
| 0.0 | 0.2 | GO:0048280 | vesicle fusion with Golgi apparatus(GO:0048280) |
| 0.0 | 0.5 | GO:0016203 | muscle attachment(GO:0016203) |
| 0.0 | 1.9 | GO:0061515 | myeloid cell development(GO:0061515) |
| 0.0 | 0.3 | GO:0032438 | melanosome organization(GO:0032438) |
| 0.0 | 0.3 | GO:0034315 | regulation of Arp2/3 complex-mediated actin nucleation(GO:0034315) |
Gene overrepresentation in cellular component category:
| Log-likelihood per target | Total log-likelihood | Term | Description |
|---|---|---|---|
| 0.1 | 0.4 | GO:0005588 | collagen type V trimer(GO:0005588) |
| 0.1 | 0.2 | GO:0031466 | Cul5-RING ubiquitin ligase complex(GO:0031466) |
| 0.0 | 0.3 | GO:0005868 | cytoplasmic dynein complex(GO:0005868) |
| 0.0 | 1.9 | GO:0005884 | actin filament(GO:0005884) |
| 0.0 | 0.3 | GO:0032588 | trans-Golgi network membrane(GO:0032588) |
Gene overrepresentation in molecular function category:
| Log-likelihood per target | Total log-likelihood | Term | Description |
|---|---|---|---|
| 0.1 | 0.4 | GO:0034632 | retinol transporter activity(GO:0034632) |
| 0.0 | 0.1 | GO:0019777 | Atg12 transferase activity(GO:0019777) |
| 0.0 | 0.1 | GO:0004345 | glucose-6-phosphate dehydrogenase activity(GO:0004345) |
| 0.0 | 0.1 | GO:0019107 | myristoyltransferase activity(GO:0019107) |
| 0.0 | 0.3 | GO:0045503 | dynein light chain binding(GO:0045503) |
| 0.0 | 0.1 | GO:0019136 | deoxynucleoside kinase activity(GO:0019136) |
| 0.0 | 0.3 | GO:0004720 | protein-lysine 6-oxidase activity(GO:0004720) |
| 0.0 | 0.1 | GO:0004745 | retinol dehydrogenase activity(GO:0004745) |
| 0.0 | 0.1 | GO:0004396 | glucokinase activity(GO:0004340) hexokinase activity(GO:0004396) glucose binding(GO:0005536) fructokinase activity(GO:0008865) mannokinase activity(GO:0019158) |
| 0.0 | 1.7 | GO:0042803 | protein homodimerization activity(GO:0042803) |
| 0.0 | 0.1 | GO:0016530 | metallochaperone activity(GO:0016530) |