Project
PRJNA195909:zebrafish embryo and larva development
Navigation
Downloads
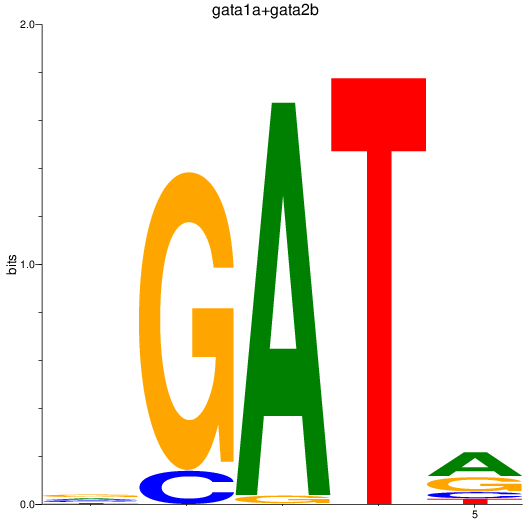
Results for gata1a+gata2b
Z-value: 0.35
Motif logo
Transcription factors associated with gata1a+gata2b
| Gene Symbol | Gene ID | Gene Info |
|---|---|---|
|
gata2b
|
ENSDARG00000009094 | GATA binding protein 2b |
|
gata1a
|
ENSDARG00000013477 | GATA binding protein 1a |
|
gata1a
|
ENSDARG00000117116 | GATA binding protein 1a |
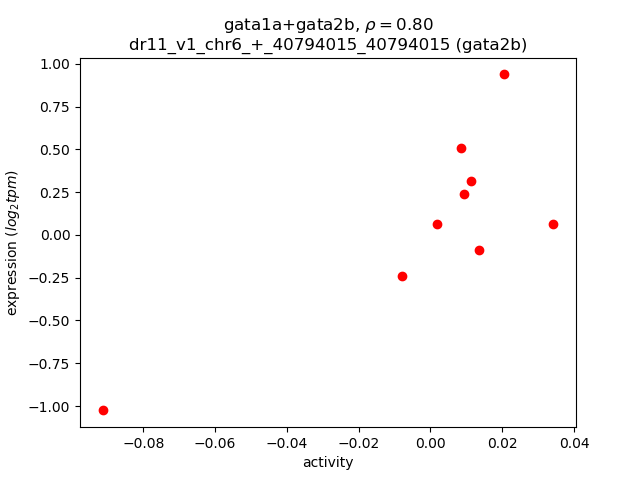
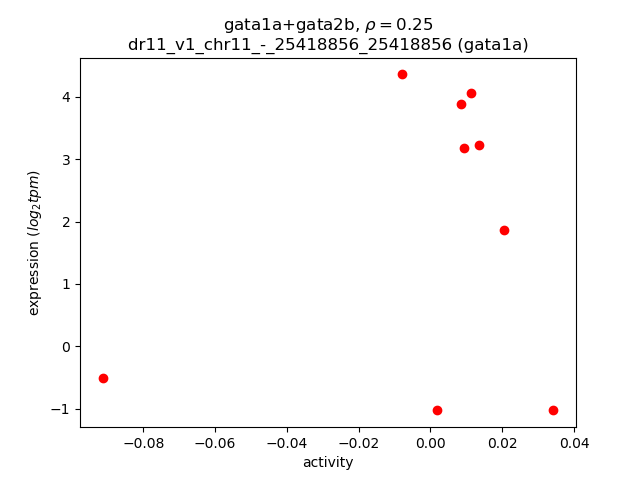
Activity-expression correlation:
| Gene | Promoter | Pearson corr. coef. | P-value | Plot |
|---|---|---|---|---|
| gata2b | dr11_v1_chr6_+_40794015_40794015 | 0.80 | 9.2e-03 | Click! |
| gata1a | dr11_v1_chr11_-_25418856_25418856 | 0.25 | 5.1e-01 | Click! |
Activity profile of gata1a+gata2b motif
Sorted Z-values of gata1a+gata2b motif
| Promoter | Log-likelihood | Transcript | Gene | Gene Info |
|---|---|---|---|---|
| chr10_-_31175744 | 0.51 |
ENSDART00000191728
|
pknox2
|
pbx/knotted 1 homeobox 2 |
| chr21_+_24287403 | 0.34 |
ENSDART00000111169
|
cadm1a
|
cell adhesion molecule 1a |
| chr19_-_32710922 | 0.33 |
ENSDART00000004034
|
hpca
|
hippocalcin |
| chr19_+_12444943 | 0.28 |
ENSDART00000135706
|
ldlrad4a
|
low density lipoprotein receptor class A domain containing 4a |
| chr12_-_5505205 | 0.27 |
ENSDART00000092319
|
abi3b
|
ABI family, member 3b |
| chr16_-_35532937 | 0.24 |
ENSDART00000193209
|
ctps1b
|
CTP synthase 1b |
| chr22_+_21398508 | 0.22 |
ENSDART00000089408
ENSDART00000186091 |
shdb
|
Src homology 2 domain containing transforming protein D, b |
| chr22_+_15507218 | 0.22 |
ENSDART00000125450
|
gpc1a
|
glypican 1a |
| chr6_-_49159207 | 0.20 |
ENSDART00000041942
|
tspan2a
|
tetraspanin 2a |
| chr18_-_22753637 | 0.14 |
ENSDART00000181589
ENSDART00000009912 |
hsf4
|
heat shock transcription factor 4 |
| chr8_-_6825588 | 0.11 |
ENSDART00000135834
|
dock5
|
dedicator of cytokinesis 5 |
| chr11_-_40457325 | 0.11 |
ENSDART00000128442
|
tnfrsf1b
|
tumor necrosis factor receptor superfamily, member 1B |
| chr4_-_1360495 | 0.09 |
ENSDART00000164623
|
ptn
|
pleiotrophin |
| chr21_+_43561650 | 0.02 |
ENSDART00000085071
|
gpr185a
|
G protein-coupled receptor 185 a |
| chr22_+_635813 | 0.01 |
ENSDART00000179067
|
CU856139.1
|
|
| chr17_+_5768608 | 0.00 |
ENSDART00000157039
|
rp1l1a
|
retinitis pigmentosa 1-like 1a |
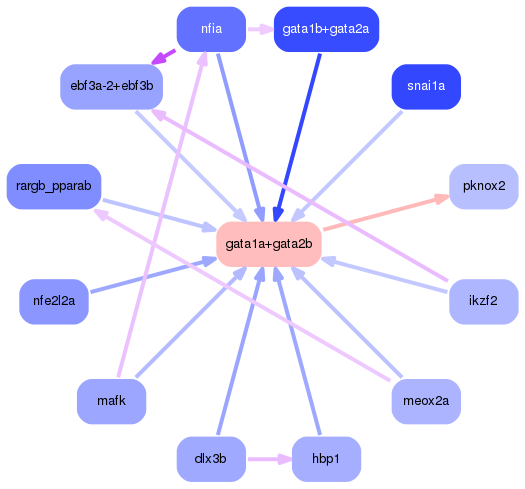
Network of associatons between targets according to the STRING database.

First level regulatory network of gata1a+gata2b
Gene Ontology Analysis
Gene overrepresentation in biological process category:
| Log-likelihood per target | Total log-likelihood | Term | Description |
|---|---|---|---|
| 0.1 | 0.2 | GO:0044210 | 'de novo' CTP biosynthetic process(GO:0044210) |
| 0.0 | 0.1 | GO:1902746 | regulation of lens fiber cell differentiation(GO:1902746) |
| 0.0 | 0.3 | GO:0060394 | negative regulation of pathway-restricted SMAD protein phosphorylation(GO:0060394) |
Gene overrepresentation in cellular component category:
| Log-likelihood per target | Total log-likelihood | Term | Description |
|---|---|---|---|
| 0.1 | 0.2 | GO:0097268 | cytoophidium(GO:0097268) |
Gene overrepresentation in molecular function category:
| Log-likelihood per target | Total log-likelihood | Term | Description |
|---|---|---|---|
| 0.1 | 0.2 | GO:0003883 | CTP synthase activity(GO:0003883) |
| 0.1 | 0.3 | GO:0070412 | R-SMAD binding(GO:0070412) |
| 0.0 | 0.2 | GO:0001784 | phosphotyrosine binding(GO:0001784) |
Gene overrepresentation in curated gene sets: canonical pathways category:
| Log-likelihood per target | Total log-likelihood | Term | Description |
|---|---|---|---|
| 0.0 | 0.1 | SA MMP CYTOKINE CONNECTION | Cytokines can induce activation of matrix metalloproteinases, which degrade extracellular matrix. |