Project
PRJNA195909:zebrafish embryo and larva development
Navigation
Downloads
Results for foxa_foxa1_foxa2
Z-value: 1.55
Motif logo
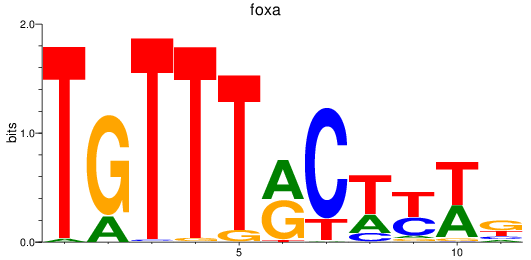
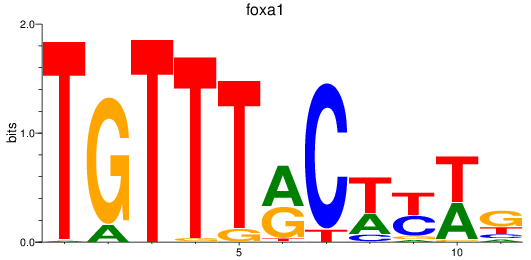
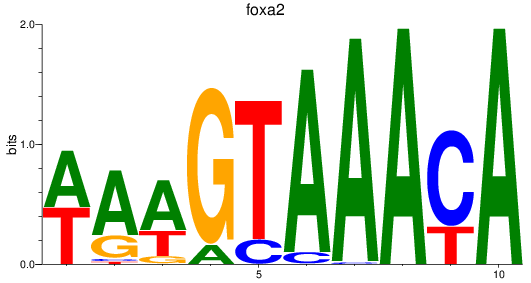
Transcription factors associated with foxa_foxa1_foxa2
| Gene Symbol | Gene ID | Gene Info |
|---|---|---|
|
foxa
|
ENSDARG00000087094 | forkhead box A sequence |
|
foxa
|
ENSDARG00000110743 | forkhead box A sequence |
|
foxa
|
ENSDARG00000115019 | forkhead box A sequence |
|
foxa1
|
ENSDARG00000102138 | forkhead box A1 |
|
foxa2
|
ENSDARG00000003411 | forkhead box A2 |
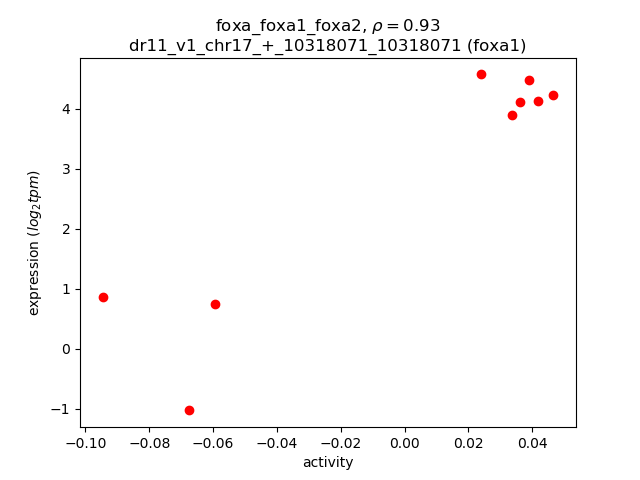
Activity-expression correlation:
| Gene | Promoter | Pearson corr. coef. | P-value | Plot |
|---|---|---|---|---|
| foxa1 | dr11_v1_chr17_+_10318071_10318071 | 0.93 | 3.2e-04 | Click! |
| foxa | dr11_v1_chr14_-_33981544_33981544 | -0.88 | 1.8e-03 | Click! |
| foxa2 | dr11_v1_chr17_-_42568498_42568498 | 0.60 | 9.0e-02 | Click! |
Activity profile of foxa_foxa1_foxa2 motif
Sorted Z-values of foxa_foxa1_foxa2 motif
| Promoter | Log-likelihood | Transcript | Gene | Gene Info |
|---|---|---|---|---|
| chr12_+_31616412 | 4.84 |
ENSDART00000124439
|
cpn1
|
carboxypeptidase N, polypeptide 1 |
| chr9_+_53725294 | 3.66 |
ENSDART00000165991
|
cnmd
|
chondromodulin |
| chr5_+_49744713 | 3.64 |
ENSDART00000133384
|
nr2f1a
|
nuclear receptor subfamily 2, group F, member 1a |
| chr9_+_53725128 | 3.55 |
ENSDART00000169062
|
cnmd
|
chondromodulin |
| chr16_-_21785261 | 3.20 |
ENSDART00000078858
|
si:ch73-86n18.1
|
si:ch73-86n18.1 |
| chr3_-_50863370 | 3.00 |
ENSDART00000169771
ENSDART00000165083 |
pmp22a
|
peripheral myelin protein 22a |
| chr16_+_23978978 | 2.91 |
ENSDART00000058964
ENSDART00000135084 |
apoa2
|
apolipoprotein A-II |
| chr15_-_18138607 | 2.85 |
ENSDART00000176690
|
CR385077.1
|
|
| chr4_+_17417111 | 2.80 |
ENSDART00000056005
|
ascl1a
|
achaete-scute family bHLH transcription factor 1a |
| chr6_+_24817852 | 2.57 |
ENSDART00000165609
|
barhl2
|
BarH-like homeobox 2 |
| chr12_-_4781801 | 2.42 |
ENSDART00000167490
ENSDART00000121718 |
mapta
|
microtubule-associated protein tau a |
| chr15_+_7176182 | 2.30 |
ENSDART00000101578
|
her8.2
|
hairy-related 8.2 |
| chr24_-_38288883 | 2.26 |
ENSDART00000169988
|
zgc:91999
|
zgc:91999 |
| chr6_-_32703317 | 2.18 |
ENSDART00000064833
|
mafaa
|
v-maf avian musculoaponeurotic fibrosarcoma oncogene homolog Aa |
| chr2_+_38161318 | 2.09 |
ENSDART00000044264
|
mmp14b
|
matrix metallopeptidase 14b (membrane-inserted) |
| chr12_-_31103906 | 1.92 |
ENSDART00000189099
ENSDART00000121527 ENSDART00000185635 ENSDART00000183754 |
tcf7l2
|
transcription factor 7 like 2 |
| chr25_-_15049694 | 1.89 |
ENSDART00000162485
ENSDART00000164384 ENSDART00000165632 ENSDART00000159490 |
pax6a
|
paired box 6a |
| chr23_+_28770225 | 1.83 |
ENSDART00000132179
ENSDART00000142273 |
masp2
|
mannan-binding lectin serine peptidase 2 |
| chr20_+_26881600 | 1.78 |
ENSDART00000174799
|
serpinb1
|
serpin peptidase inhibitor, clade B (ovalbumin), member 1 |
| chr16_-_29277164 | 1.75 |
ENSDART00000058870
|
rhbg
|
Rh family, B glycoprotein (gene/pseudogene) |
| chr20_-_20533865 | 1.69 |
ENSDART00000125039
|
six6b
|
SIX homeobox 6b |
| chr6_+_14949950 | 1.68 |
ENSDART00000149202
ENSDART00000149949 |
pou3f3b
|
POU class 3 homeobox 3b |
| chr18_-_14777092 | 1.67 |
ENSDART00000144660
|
mtss1la
|
metastasis suppressor 1-like a |
| chr3_-_50865079 | 1.66 |
ENSDART00000164295
|
pmp22a
|
peripheral myelin protein 22a |
| chr19_-_28789404 | 1.61 |
ENSDART00000191453
ENSDART00000026992 |
sox4a
|
SRY (sex determining region Y)-box 4a |
| chr16_-_54455573 | 1.57 |
ENSDART00000075275
|
pklr
|
pyruvate kinase L/R |
| chr4_-_16353733 | 1.56 |
ENSDART00000186785
|
lum
|
lumican |
| chr13_-_31647323 | 1.56 |
ENSDART00000135381
|
six4a
|
SIX homeobox 4a |
| chr23_+_36115541 | 1.55 |
ENSDART00000130090
|
hoxc6a
|
homeobox C6a |
| chr14_-_34044369 | 1.55 |
ENSDART00000149396
ENSDART00000123607 ENSDART00000190746 |
cyfip2
|
cytoplasmic FMR1 interacting protein 2 |
| chr12_-_31103187 | 1.54 |
ENSDART00000005562
ENSDART00000031408 ENSDART00000125046 ENSDART00000009237 ENSDART00000122972 ENSDART00000153068 |
tcf7l2
|
transcription factor 7 like 2 |
| chr15_+_36941490 | 1.53 |
ENSDART00000172664
|
kirrel3l
|
kirre like nephrin family adhesion molecule 3, like |
| chr2_+_16780643 | 1.52 |
ENSDART00000125647
ENSDART00000108611 ENSDART00000181245 ENSDART00000163194 |
tfa
|
transferrin-a |
| chr16_+_11724230 | 1.50 |
ENSDART00000060266
|
ceacam1
|
carcinoembryonic antigen-related cell adhesion molecule 1 |
| chr4_+_7677318 | 1.49 |
ENSDART00000149218
|
elk3
|
ELK3, ETS-domain protein |
| chr17_+_15297398 | 1.44 |
ENSDART00000156574
|
si:ch211-270g19.5
|
si:ch211-270g19.5 |
| chr20_-_19365875 | 1.44 |
ENSDART00000063703
ENSDART00000187707 ENSDART00000161065 |
si:dkey-71h2.2
|
si:dkey-71h2.2 |
| chr21_-_36972127 | 1.42 |
ENSDART00000100310
|
dbn1
|
drebrin 1 |
| chr9_+_52411530 | 1.42 |
ENSDART00000163684
|
nme8
|
NME/NM23 family member 8 |
| chr3_-_43356082 | 1.41 |
ENSDART00000171213
|
uncx
|
UNC homeobox |
| chr4_-_17725008 | 1.41 |
ENSDART00000016658
|
chpt1
|
choline phosphotransferase 1 |
| chr24_+_20575259 | 1.40 |
ENSDART00000010488
|
klhl40b
|
kelch-like family member 40b |
| chr16_-_35952789 | 1.40 |
ENSDART00000180118
|
eva1ba
|
eva-1 homolog Ba (C. elegans) |
| chr21_+_13861589 | 1.39 |
ENSDART00000015629
ENSDART00000171306 |
stxbp1a
|
syntaxin binding protein 1a |
| chr8_+_25902170 | 1.38 |
ENSDART00000193130
|
rhoab
|
ras homolog gene family, member Ab |
| chr6_-_8736766 | 1.37 |
ENSDART00000143956
|
cavin2b
|
caveolae associated protein 2b |
| chr14_-_36799280 | 1.36 |
ENSDART00000168615
|
rnf130
|
ring finger protein 130 |
| chr2_+_16781015 | 1.34 |
ENSDART00000155147
ENSDART00000003845 |
tfa
|
transferrin-a |
| chr9_+_51265283 | 1.31 |
ENSDART00000137426
|
gcgb
|
glucagon b |
| chr18_-_16795262 | 1.30 |
ENSDART00000048722
|
ampd3b
|
adenosine monophosphate deaminase 3b |
| chr23_+_36063599 | 1.29 |
ENSDART00000103147
|
hoxc12a
|
homeobox C12a |
| chr17_-_42213285 | 1.28 |
ENSDART00000140549
|
nkx2.2a
|
NK2 homeobox 2a |
| chr8_-_14184423 | 1.28 |
ENSDART00000063817
|
ndufb11
|
NADH dehydrogenase (ubiquinone) 1 beta subcomplex, 11 |
| chr14_+_33722950 | 1.26 |
ENSDART00000075312
|
apln
|
apelin |
| chr18_-_18543358 | 1.25 |
ENSDART00000126460
|
il34
|
interleukin 34 |
| chr7_-_58729894 | 1.24 |
ENSDART00000149347
|
chchd7
|
coiled-coil-helix-coiled-coil-helix domain containing 7 |
| chr14_+_16937997 | 1.22 |
ENSDART00000163013
ENSDART00000167856 |
limch1b
|
LIM and calponin homology domains 1b |
| chr19_-_35733401 | 1.21 |
ENSDART00000066712
|
trappc3
|
trafficking protein particle complex 3 |
| chr15_+_24644016 | 1.21 |
ENSDART00000043292
|
smtnl
|
smoothelin, like |
| chr23_-_30787932 | 1.21 |
ENSDART00000135771
|
myt1a
|
myelin transcription factor 1a |
| chr10_+_39084354 | 1.21 |
ENSDART00000158245
|
si:ch73-1a9.3
|
si:ch73-1a9.3 |
| chr22_+_3914318 | 1.18 |
ENSDART00000188774
ENSDART00000082034 |
FO904903.1
|
Danio rerio major histocompatibility complex class I ULA (mhc1ula), mRNA. |
| chr23_-_33750135 | 1.18 |
ENSDART00000187641
|
bin2a
|
bridging integrator 2a |
| chr7_-_58098814 | 1.17 |
ENSDART00000147287
ENSDART00000043984 |
ank2b
|
ankyrin 2b, neuronal |
| chr7_+_33314925 | 1.16 |
ENSDART00000148590
|
coro2ba
|
coronin, actin binding protein, 2Ba |
| chr16_-_43025885 | 1.15 |
ENSDART00000193146
ENSDART00000157302 |
si:dkey-7j14.5
|
si:dkey-7j14.5 |
| chr22_-_36856405 | 1.14 |
ENSDART00000029588
|
kng1
|
kininogen 1 |
| chr10_-_17232372 | 1.12 |
ENSDART00000135679
|
rab36
|
RAB36, member RAS oncogene family |
| chr20_+_6590220 | 1.12 |
ENSDART00000136567
|
tns3.2
|
tensin 3, tandem duplicate 2 |
| chr1_-_25177086 | 1.11 |
ENSDART00000144711
ENSDART00000177225 |
tmem154
|
transmembrane protein 154 |
| chr7_+_48805534 | 1.10 |
ENSDART00000145375
ENSDART00000148744 |
cpt1aa
|
carnitine palmitoyltransferase 1Aa (liver) |
| chr19_+_16032383 | 1.10 |
ENSDART00000046530
|
rab42a
|
RAB42, member RAS oncogene family a |
| chr6_+_40775800 | 1.08 |
ENSDART00000085090
|
si:ch211-157b11.8
|
si:ch211-157b11.8 |
| chr11_-_12051805 | 1.07 |
ENSDART00000110117
ENSDART00000182744 |
socs7
|
suppressor of cytokine signaling 7 |
| chr22_-_3914162 | 1.06 |
ENSDART00000187174
ENSDART00000190612 ENSDART00000187928 ENSDART00000057224 ENSDART00000184758 |
mhc1uma
|
major histocompatibility complex class I UMA |
| chr7_-_72605673 | 1.05 |
ENSDART00000123887
|
MAPK8IP1 (1 of many)
|
mitogen-activated protein kinase 8 interacting protein 1 |
| chr14_-_33894915 | 1.04 |
ENSDART00000143290
|
urp1
|
urotensin-related peptide 1 |
| chr8_+_49570884 | 1.03 |
ENSDART00000182117
ENSDART00000108613 |
rasef
|
RAS and EF-hand domain containing |
| chr10_+_6318227 | 1.03 |
ENSDART00000170872
ENSDART00000162428 ENSDART00000158994 |
tpm2
|
tropomyosin 2 (beta) |
| chr1_+_36612660 | 1.02 |
ENSDART00000190784
|
ednraa
|
endothelin receptor type Aa |
| chr17_-_42218652 | 1.01 |
ENSDART00000081396
ENSDART00000190007 |
nkx2.2a
|
NK2 homeobox 2a |
| chr25_-_35360096 | 1.01 |
ENSDART00000154053
ENSDART00000171917 |
si:ch73-147o17.1
|
si:ch73-147o17.1 |
| chr20_+_25225112 | 1.01 |
ENSDART00000153088
ENSDART00000127291 ENSDART00000130494 |
moxd1
|
monooxygenase, DBH-like 1 |
| chr14_-_29799993 | 1.00 |
ENSDART00000133775
ENSDART00000005568 |
pdlim3b
|
PDZ and LIM domain 3b |
| chr4_+_8797197 | 0.98 |
ENSDART00000158671
|
sult4a1
|
sulfotransferase family 4A, member 1 |
| chr19_+_2275019 | 0.98 |
ENSDART00000136138
|
itgb8
|
integrin, beta 8 |
| chr16_-_13595027 | 0.97 |
ENSDART00000060004
|
ntd5
|
ntl-dependent gene 5 |
| chr16_+_23431189 | 0.96 |
ENSDART00000004679
|
icn
|
ictacalcin |
| chr23_-_33750307 | 0.95 |
ENSDART00000162772
|
bin2a
|
bridging integrator 2a |
| chr22_-_14128716 | 0.95 |
ENSDART00000140323
|
si:ch211-246m6.4
|
si:ch211-246m6.4 |
| chr13_-_34781984 | 0.95 |
ENSDART00000172138
|
ism1
|
isthmin 1 |
| chr2_-_30200206 | 0.94 |
ENSDART00000130142
|
ube2w
|
ubiquitin-conjugating enzyme E2W (putative) |
| chr1_-_22834824 | 0.94 |
ENSDART00000043556
|
ldb2b
|
LIM domain binding 2b |
| chr24_-_31306724 | 0.93 |
ENSDART00000165399
|
acp5b
|
acid phosphatase 5b, tartrate resistant |
| chr10_+_31951338 | 0.93 |
ENSDART00000019416
|
lhfpl6
|
LHFPL tetraspan subfamily member 6 |
| chr20_+_52546186 | 0.93 |
ENSDART00000110777
ENSDART00000153377 ENSDART00000153013 ENSDART00000042704 |
eef1db
|
eukaryotic translation elongation factor 1 delta b (guanine nucleotide exchange protein) |
| chr1_+_25801648 | 0.92 |
ENSDART00000129471
|
gucy1b1
|
guanylate cyclase 1 soluble subunit beta 1 |
| chr15_-_28247583 | 0.91 |
ENSDART00000112967
|
rilp
|
Rab interacting lysosomal protein |
| chr21_+_11503212 | 0.90 |
ENSDART00000146701
|
si:dkey-184p9.7
|
si:dkey-184p9.7 |
| chr8_+_26818446 | 0.90 |
ENSDART00000134987
ENSDART00000138835 |
si:ch211-156j16.1
|
si:ch211-156j16.1 |
| chr18_+_26899316 | 0.90 |
ENSDART00000050230
|
tspan3a
|
tetraspanin 3a |
| chr20_-_36809059 | 0.90 |
ENSDART00000062925
|
slc25a27
|
solute carrier family 25, member 27 |
| chr18_-_40901707 | 0.89 |
ENSDART00000139352
|
foxg1c
|
forkhead box G1c |
| chr13_-_21701323 | 0.88 |
ENSDART00000164112
|
si:dkey-191g9.7
|
si:dkey-191g9.7 |
| chr25_-_13188678 | 0.88 |
ENSDART00000125754
|
si:ch211-147m6.1
|
si:ch211-147m6.1 |
| chr15_-_41245962 | 0.88 |
ENSDART00000155359
|
smco4
|
single-pass membrane protein with coiled-coil domains 4 |
| chr1_+_41849152 | 0.85 |
ENSDART00000053685
|
smox
|
spermine oxidase |
| chr9_-_19161982 | 0.85 |
ENSDART00000081878
|
pou1f1
|
POU class 1 homeobox 1 |
| chr21_-_22951604 | 0.85 |
ENSDART00000083449
ENSDART00000180129 |
dub
|
duboraya |
| chr15_-_30816370 | 0.84 |
ENSDART00000142982
ENSDART00000050649 ENSDART00000136901 ENSDART00000100194 |
msi2b
|
musashi RNA-binding protein 2b |
| chr14_-_26177156 | 0.83 |
ENSDART00000014149
|
fat2
|
FAT atypical cadherin 2 |
| chr10_+_39091716 | 0.83 |
ENSDART00000193072
|
si:ch73-1a9.4
|
si:ch73-1a9.4 |
| chr17_-_52587598 | 0.82 |
ENSDART00000061497
|
si:ch211-173a9.6
|
si:ch211-173a9.6 |
| chr20_+_4060839 | 0.82 |
ENSDART00000178565
|
TRIM67
|
tripartite motif containing 67 |
| chr1_+_2190714 | 0.82 |
ENSDART00000132126
|
mbnl2
|
muscleblind-like splicing regulator 2 |
| chr5_-_46329880 | 0.81 |
ENSDART00000156577
|
si:ch211-130m23.5
|
si:ch211-130m23.5 |
| chr23_+_39606108 | 0.81 |
ENSDART00000109464
|
g0s2
|
G0/G1 switch 2 |
| chr1_+_44439661 | 0.80 |
ENSDART00000100309
|
crybb1l2
|
crystallin, beta B1, like 2 |
| chr12_-_8504278 | 0.79 |
ENSDART00000135865
|
egr2b
|
early growth response 2b |
| chr2_+_30916188 | 0.79 |
ENSDART00000137012
|
myom1a
|
myomesin 1a (skelemin) |
| chr20_-_26001288 | 0.78 |
ENSDART00000136518
ENSDART00000063177 |
capn3b
|
calpain 3b |
| chr21_-_26071773 | 0.78 |
ENSDART00000141382
|
rab34b
|
RAB34, member RAS oncogene family b |
| chr10_-_15128771 | 0.76 |
ENSDART00000101261
|
spp1
|
secreted phosphoprotein 1 |
| chr4_+_2230701 | 0.76 |
ENSDART00000080439
|
cmah
|
cytidine monophospho-N-acetylneuraminic acid hydroxylase |
| chr17_-_42213822 | 0.75 |
ENSDART00000187904
ENSDART00000180029 |
nkx2.2a
|
NK2 homeobox 2a |
| chr6_+_13933464 | 0.75 |
ENSDART00000109144
|
ptprnb
|
protein tyrosine phosphatase, receptor type, Nb |
| chr1_-_39909985 | 0.75 |
ENSDART00000181673
|
stox2a
|
storkhead box 2a |
| chr3_+_50310684 | 0.75 |
ENSDART00000112152
|
gas7a
|
growth arrest-specific 7a |
| chr5_+_28797771 | 0.74 |
ENSDART00000188845
ENSDART00000149066 |
si:ch211-186e20.7
|
si:ch211-186e20.7 |
| chr4_+_1530287 | 0.74 |
ENSDART00000067446
|
slc38a4
|
solute carrier family 38, member 4 |
| chr12_+_8373525 | 0.73 |
ENSDART00000152180
|
arid5b
|
AT-rich interaction domain 5B |
| chr14_-_36378494 | 0.73 |
ENSDART00000058503
|
gpm6aa
|
glycoprotein M6Aa |
| chr15_-_29586747 | 0.72 |
ENSDART00000076749
|
samsn1a
|
SAM domain, SH3 domain and nuclear localisation signals 1a |
| chr13_-_40726865 | 0.71 |
ENSDART00000099847
|
st3gal7
|
ST3 beta-galactoside alpha-2,3-sialyltransferase 7 |
| chr17_+_27434626 | 0.71 |
ENSDART00000052446
|
vgll2b
|
vestigial-like family member 2b |
| chr20_-_10120442 | 0.70 |
ENSDART00000144970
|
meis2b
|
Meis homeobox 2b |
| chr17_-_53440284 | 0.70 |
ENSDART00000126976
|
mycbp
|
c-myc binding protein |
| chr7_+_48805725 | 0.70 |
ENSDART00000166543
|
cpt1aa
|
carnitine palmitoyltransferase 1Aa (liver) |
| chr13_+_28903959 | 0.70 |
ENSDART00000166435
|
si:ch73-28h20.1
|
si:ch73-28h20.1 |
| chr18_+_48423973 | 0.69 |
ENSDART00000184233
ENSDART00000147074 |
fli1a
|
Fli-1 proto-oncogene, ETS transcription factor a |
| chr17_+_32571584 | 0.69 |
ENSDART00000087565
|
eva1a
|
eva-1 homolog A (C. elegans) |
| chr7_+_26132665 | 0.69 |
ENSDART00000129834
|
nat16
|
N-acetyltransferase 16 |
| chr11_-_30158609 | 0.69 |
ENSDART00000006669
|
scml2
|
Scm polycomb group protein like 2 |
| chr14_-_6931889 | 0.68 |
ENSDART00000166439
|
si:ch211-266k2.1
|
si:ch211-266k2.1 |
| chr21_+_17110598 | 0.68 |
ENSDART00000101282
ENSDART00000191864 |
bcr
|
breakpoint cluster region |
| chr3_-_21280373 | 0.68 |
ENSDART00000003939
|
syngr1a
|
synaptogyrin 1a |
| chr21_-_39081107 | 0.68 |
ENSDART00000075935
|
vtnb
|
vitronectin b |
| chr4_-_13921185 | 0.68 |
ENSDART00000143202
ENSDART00000080334 |
yaf2
|
YY1 associated factor 2 |
| chr15_-_28596507 | 0.67 |
ENSDART00000156800
|
si:ch211-225b7.5
|
si:ch211-225b7.5 |
| chr18_+_40354998 | 0.67 |
ENSDART00000098791
ENSDART00000049171 |
sema6dl
|
sema domain, transmembrane domain (TM), and cytoplasmic domain, (semaphorin) 6D, like |
| chr24_-_4973765 | 0.67 |
ENSDART00000127597
|
zic1
|
zic family member 1 (odd-paired homolog, Drosophila) |
| chr4_-_13995766 | 0.66 |
ENSDART00000147955
|
prickle1b
|
prickle homolog 1b |
| chr7_+_20110336 | 0.66 |
ENSDART00000179395
|
zgc:114045
|
zgc:114045 |
| chr21_+_26071874 | 0.66 |
ENSDART00000003001
ENSDART00000146573 |
rpl23a
|
ribosomal protein L23a |
| chr22_+_17784414 | 0.65 |
ENSDART00000188189
ENSDART00000145260 |
tm6sf2
|
transmembrane 6 superfamily member 2 |
| chr6_-_41085692 | 0.65 |
ENSDART00000181463
|
srsf3a
|
serine/arginine-rich splicing factor 3a |
| chr1_+_37391716 | 0.65 |
ENSDART00000191986
|
sparcl1
|
SPARC-like 1 |
| chr7_-_33023404 | 0.65 |
ENSDART00000052383
|
cd81a
|
CD81 molecule a |
| chr3_+_57038033 | 0.65 |
ENSDART00000162930
|
bahcc1a
|
BAH domain and coiled-coil containing 1a |
| chr6_+_21095918 | 0.65 |
ENSDART00000167225
|
spega
|
SPEG complex locus a |
| chr14_-_25040359 | 0.65 |
ENSDART00000162556
|
TMEM216
|
si:rp71-1d10.5 |
| chr17_+_16755287 | 0.64 |
ENSDART00000080129
|
ston2
|
stonin 2 |
| chr5_+_32345187 | 0.64 |
ENSDART00000147132
|
c9
|
complement component 9 |
| chr6_+_37894220 | 0.64 |
ENSDART00000087311
|
oca2
|
oculocutaneous albinism II |
| chr9_+_3388099 | 0.64 |
ENSDART00000019910
|
dlx1a
|
distal-less homeobox 1a |
| chr8_-_13029297 | 0.63 |
ENSDART00000144305
|
dennd2da
|
DENN/MADD domain containing 2Da |
| chr11_-_30158191 | 0.63 |
ENSDART00000155278
ENSDART00000156121 |
scml2
|
Scm polycomb group protein like 2 |
| chr14_+_33723309 | 0.63 |
ENSDART00000132488
|
apln
|
apelin |
| chr25_-_3228025 | 0.63 |
ENSDART00000165924
|
cib1
|
calcium and integrin binding 1 (calmyrin) |
| chr17_-_17130942 | 0.63 |
ENSDART00000064241
|
nrxn3a
|
neurexin 3a |
| chr10_+_9561066 | 0.62 |
ENSDART00000136281
|
si:ch211-243g18.2
|
si:ch211-243g18.2 |
| chr20_+_27003558 | 0.62 |
ENSDART00000125688
|
si:dkey-177p2.18
|
si:dkey-177p2.18 |
| chr9_+_3282369 | 0.62 |
ENSDART00000044128
|
hat1
|
histone acetyltransferase 1 |
| chr3_-_28428198 | 0.61 |
ENSDART00000151546
|
rbfox1
|
RNA binding fox-1 homolog 1 |
| chr18_-_16123222 | 0.61 |
ENSDART00000061189
|
sspn
|
sarcospan (Kras oncogene-associated gene) |
| chr23_+_21479958 | 0.60 |
ENSDART00000188302
ENSDART00000144320 |
si:dkey-1c11.1
|
si:dkey-1c11.1 |
| chr8_-_14151051 | 0.59 |
ENSDART00000090427
|
si:dkey-6n6.1
|
si:dkey-6n6.1 |
| chr10_+_31244619 | 0.59 |
ENSDART00000145562
ENSDART00000184412 |
robo4
|
roundabout, axon guidance receptor, homolog 4 (Drosophila) |
| chr23_+_11347313 | 0.59 |
ENSDART00000135406
|
chl1a
|
cell adhesion molecule L1-like a |
| chr8_-_7093507 | 0.59 |
ENSDART00000045669
|
si:dkey-222n6.2
|
si:dkey-222n6.2 |
| chr11_+_6819050 | 0.59 |
ENSDART00000104289
|
rab3ab
|
RAB3A, member RAS oncogene family, b |
| chr23_-_31763753 | 0.59 |
ENSDART00000053399
|
aldh8a1
|
aldehyde dehydrogenase 8 family, member A1 |
| chr15_+_29123031 | 0.58 |
ENSDART00000133988
ENSDART00000060030 |
zgc:101731
|
zgc:101731 |
| chr9_+_21722733 | 0.58 |
ENSDART00000102021
|
sox1a
|
SRY (sex determining region Y)-box 1a |
| chr16_+_14588141 | 0.58 |
ENSDART00000140469
ENSDART00000059984 ENSDART00000167411 ENSDART00000133566 |
deptor
|
DEP domain containing MTOR-interacting protein |
| chr2_+_5563077 | 0.58 |
ENSDART00000111220
|
mb21d2
|
Mab-21 domain containing 2 |
| chr25_+_15647993 | 0.58 |
ENSDART00000186578
ENSDART00000031828 |
spon1b
|
spondin 1b |
| chr4_-_1824836 | 0.58 |
ENSDART00000111858
|
mrpl42
|
mitochondrial ribosomal protein L42 |
| chr1_+_1599979 | 0.58 |
ENSDART00000097626
|
urp2
|
urotensin II-related peptide |
| chr23_+_36653376 | 0.58 |
ENSDART00000053189
|
gpr182
|
G protein-coupled receptor 182 |
| chr25_-_25434479 | 0.57 |
ENSDART00000171589
|
hrasa
|
v-Ha-ras Harvey rat sarcoma viral oncogene homolog a |
| chr22_+_26400519 | 0.57 |
ENSDART00000159839
ENSDART00000144585 |
capn8
|
calpain 8 |
| chr2_+_1487118 | 0.57 |
ENSDART00000147283
|
c8a
|
complement component 8, alpha polypeptide |
| chr15_-_47841259 | 0.57 |
ENSDART00000155384
|
kbtbd3
|
kelch repeat and BTB (POZ) domain containing 3 |
| chr7_+_11197940 | 0.56 |
ENSDART00000081346
|
cemip
|
cell migration inducing protein, hyaluronan binding |
| chr19_+_25649626 | 0.56 |
ENSDART00000146947
|
tac1
|
tachykinin 1 |
| chr20_+_6142433 | 0.55 |
ENSDART00000054084
ENSDART00000136986 |
ttr
|
transthyretin (prealbumin, amyloidosis type I) |
| chr15_+_36187434 | 0.55 |
ENSDART00000181536
ENSDART00000099501 ENSDART00000154432 |
masp1
|
mannan-binding lectin serine peptidase 1 |
| chr3_-_37571601 | 0.55 |
ENSDART00000016407
|
arf2a
|
ADP-ribosylation factor 2a |
| chr7_-_31759394 | 0.55 |
ENSDART00000193040
|
igdcc4
|
immunoglobulin superfamily, DCC subclass, member 4 |
Network of associatons between targets according to the STRING database.

First level regulatory network of foxa_foxa1_foxa2
Gene Ontology Analysis
Gene overrepresentation in biological process category:
| Log-likelihood per target | Total log-likelihood | Term | Description |
|---|---|---|---|
| 1.4 | 7.2 | GO:0001886 | endothelial cell morphogenesis(GO:0001886) |
| 1.0 | 3.0 | GO:0021530 | spinal cord oligodendrocyte cell fate specification(GO:0021530) |
| 0.9 | 3.5 | GO:0010226 | response to lithium ion(GO:0010226) |
| 0.7 | 2.8 | GO:0061549 | sympathetic ganglion development(GO:0061549) |
| 0.5 | 1.4 | GO:0098528 | skeletal muscle fiber differentiation(GO:0098528) |
| 0.4 | 1.3 | GO:0045649 | regulation of macrophage differentiation(GO:0045649) |
| 0.4 | 3.6 | GO:0055011 | atrial cardiac muscle cell differentiation(GO:0055011) |
| 0.4 | 1.2 | GO:0042421 | octopamine biosynthetic process(GO:0006589) dopamine catabolic process(GO:0042420) norepinephrine biosynthetic process(GO:0042421) octopamine metabolic process(GO:0046333) |
| 0.4 | 2.1 | GO:0071800 | podosome assembly(GO:0071800) |
| 0.3 | 1.7 | GO:0097272 | ammonia homeostasis(GO:0097272) |
| 0.3 | 1.0 | GO:1903069 | regulation of ER-associated ubiquitin-dependent protein catabolic process(GO:1903069) |
| 0.3 | 1.4 | GO:0098974 | postsynaptic actin cytoskeleton organization(GO:0098974) |
| 0.3 | 0.8 | GO:0061341 | non-canonical Wnt signaling pathway involved in heart development(GO:0061341) |
| 0.3 | 1.9 | GO:0060221 | retinal rod cell differentiation(GO:0060221) |
| 0.3 | 1.6 | GO:0090134 | mesendoderm migration(GO:0090133) cell migration involved in mesendoderm migration(GO:0090134) |
| 0.3 | 2.9 | GO:0019731 | antibacterial humoral response(GO:0019731) |
| 0.3 | 0.8 | GO:0097264 | self proteolysis(GO:0097264) |
| 0.2 | 1.2 | GO:0036371 | protein localization to T-tubule(GO:0036371) |
| 0.2 | 2.1 | GO:0001958 | endochondral ossification(GO:0001958) replacement ossification(GO:0036075) |
| 0.2 | 0.9 | GO:0099548 | trans-synaptic signaling by soluble gas(GO:0099543) trans-synaptic signaling by nitric oxide(GO:0099548) |
| 0.2 | 0.6 | GO:0006957 | complement activation, alternative pathway(GO:0006957) |
| 0.2 | 1.2 | GO:0051703 | social behavior(GO:0035176) intraspecies interaction between organisms(GO:0051703) |
| 0.2 | 0.6 | GO:0001954 | positive regulation of cell-matrix adhesion(GO:0001954) |
| 0.2 | 1.4 | GO:1902766 | skeletal muscle satellite cell migration(GO:1902766) |
| 0.2 | 0.6 | GO:0031630 | regulation of synaptic vesicle fusion to presynaptic membrane(GO:0031630) |
| 0.2 | 0.6 | GO:0097052 | L-kynurenine metabolic process(GO:0097052) L-kynurenine catabolic process(GO:0097053) |
| 0.2 | 1.8 | GO:0031998 | regulation of fatty acid beta-oxidation(GO:0031998) |
| 0.2 | 0.5 | GO:0042416 | dopamine biosynthetic process from tyrosine(GO:0006585) dopamine biosynthetic process(GO:0042416) |
| 0.2 | 0.5 | GO:0001937 | negative regulation of endothelial cell proliferation(GO:0001937) |
| 0.2 | 0.5 | GO:0034375 | high-density lipoprotein particle remodeling(GO:0034375) |
| 0.1 | 2.3 | GO:0097320 | membrane tubulation(GO:0097320) |
| 0.1 | 1.8 | GO:0001867 | complement activation, lectin pathway(GO:0001867) |
| 0.1 | 0.5 | GO:0006565 | L-serine catabolic process(GO:0006565) |
| 0.1 | 1.2 | GO:0090109 | cell-substrate adherens junction assembly(GO:0007045) focal adhesion assembly(GO:0048041) regulation of focal adhesion assembly(GO:0051893) regulation of cell-substrate junction assembly(GO:0090109) |
| 0.1 | 0.6 | GO:0002025 | vasodilation by norepinephrine-epinephrine involved in regulation of systemic arterial blood pressure(GO:0002025) |
| 0.1 | 0.5 | GO:0010133 | proline catabolic process to glutamate(GO:0010133) |
| 0.1 | 0.3 | GO:0010430 | fatty acid omega-oxidation(GO:0010430) |
| 0.1 | 0.6 | GO:0035881 | amacrine cell differentiation(GO:0035881) |
| 0.1 | 0.5 | GO:0055005 | ventricular cardiac myofibril assembly(GO:0055005) |
| 0.1 | 1.5 | GO:0001964 | startle response(GO:0001964) |
| 0.1 | 0.5 | GO:0003261 | cardiac muscle progenitor cell migration to the midline involved in heart field formation(GO:0003261) |
| 0.1 | 1.4 | GO:0043462 | regulation of ATPase activity(GO:0043462) |
| 0.1 | 0.7 | GO:0021534 | cell proliferation in hindbrain(GO:0021534) |
| 0.1 | 4.6 | GO:0071391 | cellular response to estrogen stimulus(GO:0071391) |
| 0.1 | 1.7 | GO:0097178 | ruffle assembly(GO:0097178) |
| 0.1 | 1.3 | GO:0032264 | IMP salvage(GO:0032264) |
| 0.1 | 1.2 | GO:0045880 | positive regulation of smoothened signaling pathway(GO:0045880) |
| 0.1 | 0.5 | GO:0003232 | bulbus arteriosus development(GO:0003232) |
| 0.1 | 0.6 | GO:0090385 | phagosome-lysosome fusion(GO:0090385) |
| 0.1 | 0.6 | GO:0042438 | melanin biosynthetic process(GO:0042438) |
| 0.1 | 0.9 | GO:0021754 | facial nucleus development(GO:0021754) |
| 0.1 | 0.8 | GO:0006054 | N-acetylneuraminate metabolic process(GO:0006054) |
| 0.1 | 0.3 | GO:1901492 | positive regulation of lymphangiogenesis(GO:1901492) |
| 0.1 | 0.7 | GO:0060612 | adipose tissue development(GO:0060612) |
| 0.1 | 2.1 | GO:0006949 | syncytium formation by plasma membrane fusion(GO:0000768) syncytium formation(GO:0006949) |
| 0.1 | 0.6 | GO:0006348 | chromatin silencing at telomere(GO:0006348) |
| 0.1 | 0.7 | GO:0003209 | cardiac atrium morphogenesis(GO:0003209) |
| 0.1 | 0.2 | GO:0010633 | negative regulation of epithelial cell migration(GO:0010633) |
| 0.1 | 0.4 | GO:0045898 | regulation of RNA polymerase II transcriptional preinitiation complex assembly(GO:0045898) positive regulation of RNA polymerase II transcriptional preinitiation complex assembly(GO:0045899) |
| 0.1 | 1.7 | GO:0045879 | negative regulation of smoothened signaling pathway(GO:0045879) |
| 0.1 | 0.8 | GO:0048941 | myelination of lateral line nerve axons(GO:0048897) posterior lateral line nerve glial cell differentiation(GO:0048931) myelination of posterior lateral line nerve axons(GO:0048932) lateral line nerve glial cell morphogenesis involved in differentiation(GO:0048938) posterior lateral line nerve glial cell development(GO:0048941) posterior lateral line nerve glial cell morphogenesis involved in differentiation(GO:0048942) |
| 0.1 | 0.4 | GO:0097476 | spinal cord motor neuron migration(GO:0097476) lateral motor column neuron migration(GO:0097477) |
| 0.1 | 0.5 | GO:0048730 | epidermis morphogenesis(GO:0048730) |
| 0.1 | 0.4 | GO:2001239 | histone dephosphorylation(GO:0016576) negative regulation of signal transduction in absence of ligand(GO:1901099) regulation of extrinsic apoptotic signaling pathway in absence of ligand(GO:2001239) negative regulation of extrinsic apoptotic signaling pathway in absence of ligand(GO:2001240) |
| 0.1 | 0.6 | GO:0072337 | modified amino acid transport(GO:0072337) |
| 0.1 | 0.4 | GO:1900047 | negative regulation of blood coagulation(GO:0030195) negative regulation of hemostasis(GO:1900047) |
| 0.1 | 1.4 | GO:0019835 | cytolysis(GO:0019835) |
| 0.1 | 0.9 | GO:0071425 | hematopoietic stem cell proliferation(GO:0071425) |
| 0.1 | 0.3 | GO:0035475 | angioblast cell migration involved in selective angioblast sprouting(GO:0035475) |
| 0.1 | 0.2 | GO:1903504 | regulation of spindle checkpoint(GO:0090231) regulation of mitotic cell cycle spindle assembly checkpoint(GO:0090266) regulation of mitotic spindle checkpoint(GO:1903504) |
| 0.0 | 0.3 | GO:0021588 | cerebellum formation(GO:0021588) |
| 0.0 | 0.9 | GO:0009409 | response to cold(GO:0009409) |
| 0.0 | 0.3 | GO:0046600 | negative regulation of centriole replication(GO:0046600) |
| 0.0 | 0.1 | GO:1903779 | regulation of cardiac conduction(GO:1903779) |
| 0.0 | 0.2 | GO:0031627 | telomeric loop formation(GO:0031627) |
| 0.0 | 0.2 | GO:2000171 | negative regulation of dendrite development(GO:2000171) |
| 0.0 | 0.4 | GO:0038007 | netrin-activated signaling pathway(GO:0038007) |
| 0.0 | 1.6 | GO:0030199 | collagen fibril organization(GO:0030199) |
| 0.0 | 0.5 | GO:0016199 | axon midline choice point recognition(GO:0016199) |
| 0.0 | 1.2 | GO:0006891 | intra-Golgi vesicle-mediated transport(GO:0006891) |
| 0.0 | 0.2 | GO:0019483 | beta-alanine metabolic process(GO:0019482) beta-alanine biosynthetic process(GO:0019483) |
| 0.0 | 0.5 | GO:0071501 | response to sterol depletion(GO:0006991) SREBP signaling pathway(GO:0032933) cellular response to sterol depletion(GO:0071501) |
| 0.0 | 1.0 | GO:0051923 | sulfation(GO:0051923) |
| 0.0 | 0.3 | GO:0097104 | presynaptic membrane organization(GO:0097090) postsynaptic membrane assembly(GO:0097104) presynaptic membrane assembly(GO:0097105) |
| 0.0 | 0.1 | GO:2000252 | negative regulation of behavior(GO:0048521) negative regulation of feeding behavior(GO:2000252) |
| 0.0 | 0.1 | GO:0048014 | Tie signaling pathway(GO:0048014) |
| 0.0 | 0.6 | GO:0010811 | positive regulation of cell-substrate adhesion(GO:0010811) |
| 0.0 | 0.5 | GO:0060021 | palate development(GO:0060021) |
| 0.0 | 0.2 | GO:1901031 | response to leucine(GO:0043201) cellular response to leucine(GO:0071233) regulation of response to reactive oxygen species(GO:1901031) |
| 0.0 | 0.2 | GO:0048662 | regulation of smooth muscle cell proliferation(GO:0048660) negative regulation of smooth muscle cell proliferation(GO:0048662) |
| 0.0 | 1.0 | GO:0033627 | cell adhesion mediated by integrin(GO:0033627) |
| 0.0 | 0.5 | GO:0040033 | miRNA mediated inhibition of translation(GO:0035278) negative regulation of translation, ncRNA-mediated(GO:0040033) regulation of translation, ncRNA-mediated(GO:0045974) |
| 0.0 | 0.2 | GO:0051988 | regulation of attachment of spindle microtubules to kinetochore(GO:0051988) |
| 0.0 | 2.2 | GO:0055113 | epiboly involved in gastrulation with mouth forming second(GO:0055113) |
| 0.0 | 0.4 | GO:0031641 | regulation of myelination(GO:0031641) |
| 0.0 | 1.9 | GO:0008217 | regulation of blood pressure(GO:0008217) |
| 0.0 | 0.1 | GO:0008635 | activation of cysteine-type endopeptidase activity involved in apoptotic process by cytochrome c(GO:0008635) |
| 0.0 | 0.1 | GO:0007217 | tachykinin receptor signaling pathway(GO:0007217) |
| 0.0 | 0.4 | GO:0000186 | activation of MAPKK activity(GO:0000186) |
| 0.0 | 0.2 | GO:0061641 | chromatin remodeling at centromere(GO:0031055) CENP-A containing nucleosome assembly(GO:0034080) CENP-A containing chromatin organization(GO:0061641) |
| 0.0 | 0.3 | GO:0045453 | bone resorption(GO:0045453) |
| 0.0 | 0.7 | GO:0000027 | ribosomal large subunit assembly(GO:0000027) |
| 0.0 | 0.1 | GO:0019323 | pentose catabolic process(GO:0019323) |
| 0.0 | 0.8 | GO:0032482 | Rab protein signal transduction(GO:0032482) |
| 0.0 | 0.7 | GO:0070831 | basement membrane assembly(GO:0070831) |
| 0.0 | 0.1 | GO:0061015 | RNA import into nucleus(GO:0006404) snRNA import into nucleus(GO:0061015) |
| 0.0 | 0.2 | GO:1901341 | activation of store-operated calcium channel activity(GO:0032237) positive regulation of store-operated calcium channel activity(GO:1901341) |
| 0.0 | 0.4 | GO:0048769 | sarcomerogenesis(GO:0048769) |
| 0.0 | 0.1 | GO:0038161 | prolactin signaling pathway(GO:0038161) |
| 0.0 | 1.6 | GO:0006096 | glycolytic process(GO:0006096) |
| 0.0 | 0.1 | GO:0021523 | somatic motor neuron differentiation(GO:0021523) |
| 0.0 | 0.2 | GO:0045604 | regulation of epidermal cell differentiation(GO:0045604) |
| 0.0 | 0.5 | GO:0051932 | synaptic transmission, GABAergic(GO:0051932) |
| 0.0 | 0.1 | GO:1901673 | regulation of mitotic spindle assembly(GO:1901673) |
| 0.0 | 0.4 | GO:0031167 | rRNA methylation(GO:0031167) |
| 0.0 | 1.8 | GO:0000381 | regulation of alternative mRNA splicing, via spliceosome(GO:0000381) |
| 0.0 | 0.2 | GO:0051601 | exocyst localization(GO:0051601) |
| 0.0 | 0.4 | GO:0006198 | cAMP catabolic process(GO:0006198) |
| 0.0 | 0.1 | GO:0038003 | opioid receptor signaling pathway(GO:0038003) |
| 0.0 | 0.2 | GO:0007023 | post-chaperonin tubulin folding pathway(GO:0007023) |
| 0.0 | 0.1 | GO:0032637 | interleukin-8 production(GO:0032637) regulation of interleukin-8 production(GO:0032677) positive regulation of interleukin-8 production(GO:0032757) |
| 0.0 | 0.4 | GO:0021986 | habenula development(GO:0021986) |
| 0.0 | 0.6 | GO:0007586 | digestion(GO:0007586) |
| 0.0 | 0.4 | GO:0035622 | intrahepatic bile duct development(GO:0035622) |
| 0.0 | 1.2 | GO:0006414 | translational elongation(GO:0006414) |
| 0.0 | 0.4 | GO:0030497 | fatty acid elongation(GO:0030497) |
| 0.0 | 0.8 | GO:0060348 | bone development(GO:0060348) |
| 0.0 | 0.4 | GO:0070593 | dendrite self-avoidance(GO:0070593) |
| 0.0 | 1.2 | GO:0046854 | phosphatidylinositol phosphorylation(GO:0046854) |
| 0.0 | 0.6 | GO:0032007 | negative regulation of TOR signaling(GO:0032007) |
| 0.0 | 1.3 | GO:0042594 | response to starvation(GO:0042594) |
| 0.0 | 0.4 | GO:0021514 | ventral spinal cord interneuron differentiation(GO:0021514) |
| 0.0 | 0.3 | GO:0044273 | sulfur compound catabolic process(GO:0044273) |
| 0.0 | 0.2 | GO:0048672 | positive regulation of collateral sprouting(GO:0048672) |
| 0.0 | 0.3 | GO:0042541 | hemoglobin biosynthetic process(GO:0042541) |
| 0.0 | 0.7 | GO:0003333 | amino acid transmembrane transport(GO:0003333) |
| 0.0 | 0.5 | GO:0006956 | complement activation(GO:0006956) |
| 0.0 | 0.7 | GO:0042737 | drug metabolic process(GO:0017144) drug catabolic process(GO:0042737) exogenous drug catabolic process(GO:0042738) |
| 0.0 | 0.0 | GO:0032847 | regulation of cellular pH reduction(GO:0032847) synaptic vesicle lumen acidification(GO:0097401) regulation of synaptic vesicle lumen acidification(GO:1901546) |
| 0.0 | 0.7 | GO:0048488 | synaptic vesicle endocytosis(GO:0048488) |
| 0.0 | 0.0 | GO:0097067 | cellular response to thyroid hormone stimulus(GO:0097067) |
| 0.0 | 0.1 | GO:0021702 | cerebellar granular layer development(GO:0021681) cerebellar granular layer morphogenesis(GO:0021683) cerebellar granular layer formation(GO:0021684) cerebellar Purkinje cell layer formation(GO:0021694) cerebellar Purkinje cell differentiation(GO:0021702) cerebellar granule cell differentiation(GO:0021707) |
| 0.0 | 0.1 | GO:0097107 | postsynaptic density assembly(GO:0097107) modulation of excitatory postsynaptic potential(GO:0098815) positive regulation of excitatory postsynaptic potential(GO:2000463) |
| 0.0 | 0.4 | GO:0006904 | vesicle docking involved in exocytosis(GO:0006904) |
| 0.0 | 0.7 | GO:1902668 | negative regulation of axon extension involved in axon guidance(GO:0048843) negative regulation of axon guidance(GO:1902668) |
| 0.0 | 0.3 | GO:0006301 | postreplication repair(GO:0006301) |
| 0.0 | 0.2 | GO:0016486 | peptide hormone processing(GO:0016486) |
| 0.0 | 0.2 | GO:0033173 | calcineurin-NFAT signaling cascade(GO:0033173) |
| 0.0 | 0.6 | GO:0030514 | negative regulation of BMP signaling pathway(GO:0030514) |
| 0.0 | 0.3 | GO:0051014 | actin filament severing(GO:0051014) |
| 0.0 | 0.0 | GO:2001244 | positive regulation of intrinsic apoptotic signaling pathway(GO:2001244) |
| 0.0 | 1.6 | GO:0006936 | muscle contraction(GO:0006936) |
| 0.0 | 0.1 | GO:1903963 | icosanoid secretion(GO:0032309) arachidonic acid secretion(GO:0050482) arachidonate transport(GO:1903963) |
| 0.0 | 0.4 | GO:0055013 | cardiac muscle cell development(GO:0055013) |
| 0.0 | 0.3 | GO:0016525 | negative regulation of angiogenesis(GO:0016525) negative regulation of blood vessel morphogenesis(GO:2000181) |
Gene overrepresentation in cellular component category:
| Log-likelihood per target | Total log-likelihood | Term | Description |
|---|---|---|---|
| 0.9 | 3.5 | GO:0071664 | catenin-TCF7L2 complex(GO:0071664) |
| 0.3 | 1.2 | GO:0016460 | myosin II complex(GO:0016460) |
| 0.3 | 2.1 | GO:0001891 | phagocytic cup(GO:0001891) |
| 0.2 | 0.7 | GO:0044216 | other organism(GO:0044215) other organism cell(GO:0044216) other organism part(GO:0044217) other organism cell membrane(GO:0044218) other organism membrane(GO:0044279) |
| 0.1 | 0.9 | GO:0005853 | eukaryotic translation elongation factor 1 complex(GO:0005853) |
| 0.1 | 0.4 | GO:0043218 | compact myelin(GO:0043218) Schmidt-Lanterman incisure(GO:0043220) |
| 0.1 | 0.3 | GO:0043614 | multi-eIF complex(GO:0043614) |
| 0.1 | 1.5 | GO:0031209 | SCAR complex(GO:0031209) |
| 0.1 | 1.4 | GO:0005579 | membrane attack complex(GO:0005579) |
| 0.1 | 0.4 | GO:0016533 | cyclin-dependent protein kinase 5 holoenzyme complex(GO:0016533) |
| 0.1 | 1.2 | GO:0030315 | T-tubule(GO:0030315) |
| 0.1 | 1.2 | GO:0030008 | TRAPP complex(GO:0030008) |
| 0.1 | 2.2 | GO:0031672 | A band(GO:0031672) |
| 0.1 | 0.6 | GO:0031526 | brush border membrane(GO:0031526) |
| 0.1 | 0.7 | GO:0044295 | axonal growth cone(GO:0044295) |
| 0.1 | 1.3 | GO:0033017 | sarcoplasmic reticulum membrane(GO:0033017) |
| 0.1 | 2.3 | GO:0031012 | extracellular matrix(GO:0031012) |
| 0.1 | 0.6 | GO:0042583 | chromaffin granule(GO:0042583) |
| 0.1 | 0.6 | GO:0045095 | keratin filament(GO:0045095) |
| 0.1 | 0.4 | GO:0005614 | interstitial matrix(GO:0005614) |
| 0.0 | 0.2 | GO:0005797 | Golgi medial cisterna(GO:0005797) |
| 0.0 | 2.4 | GO:0097517 | stress fiber(GO:0001725) contractile actin filament bundle(GO:0097517) |
| 0.0 | 0.1 | GO:0030906 | retromer, cargo-selective complex(GO:0030906) |
| 0.0 | 0.8 | GO:0030667 | secretory granule membrane(GO:0030667) |
| 0.0 | 1.8 | GO:0044853 | caveola(GO:0005901) plasma membrane raft(GO:0044853) |
| 0.0 | 0.2 | GO:0005854 | nascent polypeptide-associated complex(GO:0005854) |
| 0.0 | 0.5 | GO:1990589 | ATF4-CREB1 transcription factor complex(GO:1990589) |
| 0.0 | 0.3 | GO:0030904 | retromer complex(GO:0030904) |
| 0.0 | 0.3 | GO:0031371 | ubiquitin conjugating enzyme complex(GO:0031371) |
| 0.0 | 0.5 | GO:0008250 | oligosaccharyltransferase complex(GO:0008250) |
| 0.0 | 0.7 | GO:0005605 | basal lamina(GO:0005605) laminin complex(GO:0043256) |
| 0.0 | 1.2 | GO:0032154 | cleavage furrow(GO:0032154) cell surface furrow(GO:0097610) |
| 0.0 | 2.6 | GO:0055037 | recycling endosome(GO:0055037) |
| 0.0 | 0.5 | GO:0034364 | high-density lipoprotein particle(GO:0034364) |
| 0.0 | 0.3 | GO:0034451 | centriolar satellite(GO:0034451) |
| 0.0 | 1.4 | GO:0030864 | cortical actin cytoskeleton(GO:0030864) |
| 0.0 | 1.3 | GO:0045271 | mitochondrial respiratory chain complex I(GO:0005747) NADH dehydrogenase complex(GO:0030964) respiratory chain complex I(GO:0045271) |
| 0.0 | 0.6 | GO:0016010 | dystrophin-associated glycoprotein complex(GO:0016010) glycoprotein complex(GO:0090665) |
| 0.0 | 1.7 | GO:0030141 | secretory granule(GO:0030141) |
| 0.0 | 0.2 | GO:0061700 | GATOR2 complex(GO:0061700) |
| 0.0 | 0.2 | GO:0005955 | calcineurin complex(GO:0005955) |
| 0.0 | 0.4 | GO:0008540 | proteasome regulatory particle, base subcomplex(GO:0008540) |
| 0.0 | 0.9 | GO:1902711 | GABA receptor complex(GO:1902710) GABA-A receptor complex(GO:1902711) |
| 0.0 | 1.2 | GO:0008305 | integrin complex(GO:0008305) |
| 0.0 | 1.5 | GO:0036379 | striated muscle thin filament(GO:0005865) myofilament(GO:0036379) |
| 0.0 | 0.8 | GO:0005844 | polysome(GO:0005844) |
| 0.0 | 0.7 | GO:0033116 | endoplasmic reticulum-Golgi intermediate compartment membrane(GO:0033116) |
| 0.0 | 0.1 | GO:0005845 | mRNA cap binding complex(GO:0005845) |
| 0.0 | 0.5 | GO:0043204 | perikaryon(GO:0043204) |
| 0.0 | 6.0 | GO:0005667 | transcription factor complex(GO:0005667) |
| 0.0 | 1.1 | GO:0022625 | cytosolic large ribosomal subunit(GO:0022625) |
| 0.0 | 1.0 | GO:0005942 | phosphatidylinositol 3-kinase complex(GO:0005942) |
| 0.0 | 1.1 | GO:0031225 | anchored component of membrane(GO:0031225) |
| 0.0 | 0.3 | GO:0033180 | proton-transporting V-type ATPase, V1 domain(GO:0033180) |
| 0.0 | 29.1 | GO:0005576 | extracellular region(GO:0005576) |
| 0.0 | 1.4 | GO:0005741 | mitochondrial outer membrane(GO:0005741) |
| 0.0 | 0.0 | GO:0043291 | RAVE complex(GO:0043291) |
| 0.0 | 0.1 | GO:0043625 | delta DNA polymerase complex(GO:0043625) |
| 0.0 | 0.1 | GO:0030991 | intraciliary transport particle A(GO:0030991) |
| 0.0 | 0.7 | GO:0030672 | synaptic vesicle membrane(GO:0030672) exocytic vesicle membrane(GO:0099501) |
| 0.0 | 0.4 | GO:0000315 | organellar large ribosomal subunit(GO:0000315) mitochondrial large ribosomal subunit(GO:0005762) |
Gene overrepresentation in molecular function category:
| Log-likelihood per target | Total log-likelihood | Term | Description |
|---|---|---|---|
| 0.6 | 1.9 | GO:0031704 | apelin receptor binding(GO:0031704) |
| 0.4 | 1.2 | GO:0004500 | dopamine beta-monooxygenase activity(GO:0004500) |
| 0.3 | 1.2 | GO:0032038 | myosin head/neck binding(GO:0032028) myosin II head/neck binding(GO:0032034) myosin II heavy chain binding(GO:0032038) |
| 0.3 | 1.4 | GO:0042030 | ATPase inhibitor activity(GO:0042030) |
| 0.3 | 1.4 | GO:0004142 | diacylglycerol cholinephosphotransferase activity(GO:0004142) |
| 0.3 | 1.3 | GO:0031769 | glucagon receptor binding(GO:0031769) |
| 0.3 | 1.6 | GO:0004743 | pyruvate kinase activity(GO:0004743) |
| 0.3 | 1.8 | GO:0016416 | carnitine O-palmitoyltransferase activity(GO:0004095) O-palmitoyltransferase activity(GO:0016416) |
| 0.3 | 0.8 | GO:0016716 | oxidoreductase activity, acting on paired donors, with incorporation or reduction of molecular oxygen, another compound as one donor, and incorporation of one atom of oxygen(GO:0016716) |
| 0.2 | 0.7 | GO:0047291 | lactosylceramide alpha-2,3-sialyltransferase activity(GO:0047291) |
| 0.2 | 0.6 | GO:0050253 | retinyl-palmitate esterase activity(GO:0050253) |
| 0.2 | 4.8 | GO:0004181 | metallocarboxypeptidase activity(GO:0004181) |
| 0.2 | 1.2 | GO:0004962 | endothelin receptor activity(GO:0004962) |
| 0.1 | 0.6 | GO:0070052 | collagen V binding(GO:0070052) |
| 0.1 | 0.6 | GO:0051380 | norepinephrine binding(GO:0051380) |
| 0.1 | 0.6 | GO:0070324 | thyroid hormone binding(GO:0070324) |
| 0.1 | 0.9 | GO:0030274 | LIM domain binding(GO:0030274) |
| 0.1 | 0.5 | GO:0048407 | platelet-derived growth factor-activated receptor activity(GO:0005017) platelet-derived growth factor binding(GO:0048407) |
| 0.1 | 1.0 | GO:0003993 | acid phosphatase activity(GO:0003993) |
| 0.1 | 1.3 | GO:0003876 | AMP deaminase activity(GO:0003876) adenosine-phosphate deaminase activity(GO:0047623) |
| 0.1 | 0.4 | GO:0018812 | 3-hydroxyacyl-CoA dehydratase activity(GO:0018812) 3-hydroxy-behenoyl-CoA dehydratase activity(GO:0102344) 3-hydroxy-lignoceroyl-CoA dehydratase activity(GO:0102345) |
| 0.1 | 0.6 | GO:0046592 | polyamine oxidase activity(GO:0046592) |
| 0.1 | 1.7 | GO:0000340 | RNA 7-methylguanosine cap binding(GO:0000340) |
| 0.1 | 0.5 | GO:0047066 | phospholipid-hydroperoxide glutathione peroxidase activity(GO:0047066) |
| 0.1 | 0.5 | GO:0016841 | ammonia-lyase activity(GO:0016841) |
| 0.1 | 0.3 | GO:0070643 | vitamin D 25-hydroxylase activity(GO:0070643) |
| 0.1 | 1.2 | GO:0004190 | aspartic-type endopeptidase activity(GO:0004190) aspartic-type peptidase activity(GO:0070001) |
| 0.1 | 0.4 | GO:0000179 | rRNA (adenine-N6,N6-)-dimethyltransferase activity(GO:0000179) |
| 0.1 | 3.9 | GO:0008013 | beta-catenin binding(GO:0008013) |
| 0.1 | 1.7 | GO:0008519 | ammonium transmembrane transporter activity(GO:0008519) |
| 0.1 | 1.3 | GO:0051371 | muscle alpha-actinin binding(GO:0051371) alpha-actinin binding(GO:0051393) |
| 0.1 | 0.4 | GO:0036402 | proteasome-activating ATPase activity(GO:0036402) |
| 0.1 | 0.6 | GO:0010485 | H4 histone acetyltransferase activity(GO:0010485) |
| 0.1 | 0.5 | GO:0016714 | oxidoreductase activity, acting on paired donors, with incorporation or reduction of molecular oxygen, reduced pteridine as one donor, and incorporation of one atom of oxygen(GO:0016714) |
| 0.1 | 1.2 | GO:0031492 | nucleosomal DNA binding(GO:0031492) |
| 0.1 | 0.2 | GO:0048487 | beta-tubulin binding(GO:0048487) |
| 0.1 | 0.9 | GO:0005080 | protein kinase C binding(GO:0005080) |
| 0.0 | 0.1 | GO:0031834 | neurokinin receptor binding(GO:0031834) substance P receptor binding(GO:0031835) |
| 0.0 | 1.5 | GO:0098632 | protein binding involved in cell-cell adhesion(GO:0098632) |
| 0.0 | 0.4 | GO:0005042 | netrin receptor activity(GO:0005042) |
| 0.0 | 1.4 | GO:0004198 | calcium-dependent cysteine-type endopeptidase activity(GO:0004198) |
| 0.0 | 0.1 | GO:0004980 | melanocyte-stimulating hormone receptor activity(GO:0004980) |
| 0.0 | 0.5 | GO:0004687 | myosin light chain kinase activity(GO:0004687) |
| 0.0 | 0.2 | GO:0070180 | large ribosomal subunit rRNA binding(GO:0070180) |
| 0.0 | 1.1 | GO:0046935 | 1-phosphatidylinositol-3-kinase regulator activity(GO:0046935) |
| 0.0 | 0.2 | GO:0033842 | N-acetyl-beta-glucosaminyl-glycoprotein 4-beta-N-acetylgalactosaminyltransferase activity(GO:0033842) |
| 0.0 | 1.0 | GO:0048306 | calcium-dependent protein binding(GO:0048306) |
| 0.0 | 1.4 | GO:0017075 | syntaxin-1 binding(GO:0017075) |
| 0.0 | 0.5 | GO:0022851 | benzodiazepine receptor activity(GO:0008503) GABA-gated chloride ion channel activity(GO:0022851) |
| 0.0 | 0.4 | GO:0061575 | cyclin-dependent protein serine/threonine kinase activator activity(GO:0061575) |
| 0.0 | 0.3 | GO:0005159 | insulin-like growth factor receptor binding(GO:0005159) |
| 0.0 | 0.1 | GO:0031544 | procollagen-proline 3-dioxygenase activity(GO:0019797) peptidyl-proline 3-dioxygenase activity(GO:0031544) |
| 0.0 | 0.2 | GO:0070728 | leucine binding(GO:0070728) |
| 0.0 | 0.3 | GO:0046934 | phosphatidylinositol-4,5-bisphosphate 3-kinase activity(GO:0046934) phosphatidylinositol-3,4-bisphosphate 5-kinase activity(GO:0052812) |
| 0.0 | 0.1 | GO:0097108 | hedgehog family protein binding(GO:0097108) |
| 0.0 | 0.6 | GO:0098748 | clathrin adaptor activity(GO:0035615) endocytic adaptor activity(GO:0098748) |
| 0.0 | 0.2 | GO:0004723 | calcium-dependent protein serine/threonine phosphatase activity(GO:0004723) calmodulin-dependent protein phosphatase activity(GO:0033192) |
| 0.0 | 0.5 | GO:0004383 | guanylate cyclase activity(GO:0004383) |
| 0.0 | 0.2 | GO:0035312 | 5'-3' exodeoxyribonuclease activity(GO:0035312) |
| 0.0 | 0.1 | GO:0005094 | Rho GDP-dissociation inhibitor activity(GO:0005094) |
| 0.0 | 1.5 | GO:0005178 | integrin binding(GO:0005178) |
| 0.0 | 0.4 | GO:0019911 | structural constituent of myelin sheath(GO:0019911) |
| 0.0 | 1.2 | GO:0003746 | translation elongation factor activity(GO:0003746) |
| 0.0 | 0.7 | GO:0001871 | pattern binding(GO:0001871) polysaccharide binding(GO:0030247) |
| 0.0 | 0.1 | GO:0004925 | prolactin receptor activity(GO:0004925) |
| 0.0 | 1.1 | GO:0016620 | oxidoreductase activity, acting on the aldehyde or oxo group of donors, NAD or NADP as acceptor(GO:0016620) |
| 0.0 | 0.3 | GO:0046933 | proton-transporting ATP synthase activity, rotational mechanism(GO:0046933) |
| 0.0 | 0.6 | GO:0005518 | collagen binding(GO:0005518) |
| 0.0 | 0.5 | GO:0008253 | 5'-nucleotidase activity(GO:0008253) |
| 0.0 | 0.6 | GO:0051787 | misfolded protein binding(GO:0051787) |
| 0.0 | 0.3 | GO:0050291 | sphingosine N-acyltransferase activity(GO:0050291) |
| 0.0 | 2.7 | GO:0004879 | RNA polymerase II transcription factor activity, ligand-activated sequence-specific DNA binding(GO:0004879) |
| 0.0 | 0.4 | GO:0004890 | GABA-A receptor activity(GO:0004890) |
| 0.0 | 0.8 | GO:0016493 | C-C chemokine receptor activity(GO:0016493) |
| 0.0 | 0.8 | GO:0004869 | cysteine-type endopeptidase inhibitor activity(GO:0004869) |
| 0.0 | 0.4 | GO:0004709 | MAP kinase kinase kinase activity(GO:0004709) |
| 0.0 | 0.4 | GO:0004115 | 3',5'-cyclic-AMP phosphodiesterase activity(GO:0004115) |
| 0.0 | 0.2 | GO:0004955 | prostaglandin receptor activity(GO:0004955) |
| 0.0 | 0.4 | GO:0005520 | insulin-like growth factor binding(GO:0005520) |
| 0.0 | 2.3 | GO:0030414 | peptidase inhibitor activity(GO:0030414) |
| 0.0 | 3.5 | GO:0004252 | serine-type endopeptidase activity(GO:0004252) |
| 0.0 | 0.6 | GO:0019003 | GDP binding(GO:0019003) |
| 0.0 | 0.4 | GO:0031210 | phosphatidylcholine binding(GO:0031210) |
| 0.0 | 0.7 | GO:0019843 | rRNA binding(GO:0019843) |
| 0.0 | 2.1 | GO:0005179 | hormone activity(GO:0005179) |
| 0.0 | 0.3 | GO:0005003 | ephrin receptor activity(GO:0005003) |
| 0.0 | 0.4 | GO:0042043 | neurexin family protein binding(GO:0042043) |
| 0.0 | 0.1 | GO:0030955 | potassium ion binding(GO:0030955) alkali metal ion binding(GO:0031420) |
| 0.0 | 4.9 | GO:0051015 | actin filament binding(GO:0051015) |
| 0.0 | 0.2 | GO:0005163 | nerve growth factor receptor binding(GO:0005163) neurotrophin receptor binding(GO:0005165) |
| 0.0 | 0.4 | GO:0008307 | structural constituent of muscle(GO:0008307) |
| 0.0 | 3.2 | GO:0030246 | carbohydrate binding(GO:0030246) |
| 0.0 | 0.1 | GO:0047498 | calcium-dependent phospholipase A2 activity(GO:0047498) |
| 0.0 | 6.5 | GO:0046983 | protein dimerization activity(GO:0046983) |
| 0.0 | 0.0 | GO:0042809 | vitamin D receptor binding(GO:0042809) |
| 0.0 | 0.3 | GO:0005104 | fibroblast growth factor receptor binding(GO:0005104) |
| 0.0 | 0.1 | GO:0030160 | GKAP/Homer scaffold activity(GO:0030160) ionotropic glutamate receptor binding(GO:0035255) |
| 0.0 | 0.0 | GO:0030228 | lipoprotein particle receptor activity(GO:0030228) |
| 0.0 | 0.7 | GO:0030215 | semaphorin receptor binding(GO:0030215) |
| 0.0 | 0.3 | GO:0005540 | hyaluronic acid binding(GO:0005540) |
| 0.0 | 0.5 | GO:0031490 | chromatin DNA binding(GO:0031490) |
| 0.0 | 1.5 | GO:0050839 | cell adhesion molecule binding(GO:0050839) |
| 0.0 | 0.1 | GO:0000048 | peptidyltransferase activity(GO:0000048) glutathione hydrolase activity(GO:0036374) |
| 0.0 | 20.2 | GO:0000981 | RNA polymerase II transcription factor activity, sequence-specific DNA binding(GO:0000981) |
| 0.0 | 0.7 | GO:0016712 | oxidoreductase activity, acting on paired donors, with incorporation or reduction of molecular oxygen, reduced flavin or flavoprotein as one donor, and incorporation of one atom of oxygen(GO:0016712) |
Gene overrepresentation in curated gene sets: canonical pathways category:
| Log-likelihood per target | Total log-likelihood | Term | Description |
|---|---|---|---|
| 0.1 | 1.0 | PID INTEGRIN5 PATHWAY | Beta5 beta6 beta7 and beta8 integrin cell surface interactions |
| 0.1 | 4.5 | PID AP1 PATHWAY | AP-1 transcription factor network |
| 0.1 | 1.1 | PID INTEGRIN2 PATHWAY | Beta2 integrin cell surface interactions |
| 0.1 | 2.0 | PID HNF3B PATHWAY | FOXA2 and FOXA3 transcription factor networks |
| 0.0 | 1.6 | NABA PROTEOGLYCANS | Genes encoding proteoglycans |
| 0.0 | 1.6 | PID ECADHERIN STABILIZATION PATHWAY | Stabilization and expansion of the E-cadherin adherens junction |
| 0.0 | 0.4 | PID INTEGRIN4 PATHWAY | Alpha6 beta4 integrin-ligand interactions |
| 0.0 | 0.3 | PID INTEGRIN CS PATHWAY | Integrin family cell surface interactions |
| 0.0 | 0.8 | PID INTEGRIN3 PATHWAY | Beta3 integrin cell surface interactions |
| 0.0 | 0.1 | PID SYNDECAN 3 PATHWAY | Syndecan-3-mediated signaling events |
| 0.0 | 0.5 | PID IL12 STAT4 PATHWAY | IL12 signaling mediated by STAT4 |
| 0.0 | 1.0 | PID PDGFRA PATHWAY | PDGFR-alpha signaling pathway |
| 0.0 | 0.3 | PID A6B1 A6B4 INTEGRIN PATHWAY | a6b1 and a6b4 Integrin signaling |
| 0.0 | 1.2 | PID NOTCH PATHWAY | Notch signaling pathway |
| 0.0 | 0.4 | SA B CELL RECEPTOR COMPLEXES | Antigen binding to B cell receptors activates protein tyrosine kinases, such as the Src family, which ultimate activate MAP kinases. |
| 0.0 | 0.3 | PID TRAIL PATHWAY | TRAIL signaling pathway |
| 0.0 | 0.6 | PID MTOR 4PATHWAY | mTOR signaling pathway |
| 0.0 | 0.8 | PID REG GR PATHWAY | Glucocorticoid receptor regulatory network |
| 0.0 | 0.2 | PID TXA2PATHWAY | Thromboxane A2 receptor signaling |
| 0.0 | 0.5 | PID DELTA NP63 PATHWAY | Validated transcriptional targets of deltaNp63 isoforms |
| 0.0 | 1.8 | NABA ECM REGULATORS | Genes encoding enzymes and their regulators involved in the remodeling of the extracellular matrix |
| 0.0 | 0.4 | PID TRKR PATHWAY | Neurotrophic factor-mediated Trk receptor signaling |
Gene overrepresentation in curated gene sets: REACTOME pathways category:
| Log-likelihood per target | Total log-likelihood | Term | Description |
|---|---|---|---|
| 0.3 | 2.9 | REACTOME CHYLOMICRON MEDIATED LIPID TRANSPORT | Genes involved in Chylomicron-mediated lipid transport |
| 0.2 | 1.0 | REACTOME CYTOSOLIC SULFONATION OF SMALL MOLECULES | Genes involved in Cytosolic sulfonation of small molecules |
| 0.2 | 2.9 | REACTOME INITIAL TRIGGERING OF COMPLEMENT | Genes involved in Initial triggering of complement |
| 0.1 | 1.6 | REACTOME KERATAN SULFATE DEGRADATION | Genes involved in Keratan sulfate degradation |
| 0.1 | 0.5 | REACTOME DCC MEDIATED ATTRACTIVE SIGNALING | Genes involved in DCC mediated attractive signaling |
| 0.1 | 1.2 | REACTOME COMPLEMENT CASCADE | Genes involved in Complement cascade |
| 0.1 | 1.4 | REACTOME REGULATION OF GENE EXPRESSION IN BETA CELLS | Genes involved in Regulation of gene expression in beta cells |
| 0.1 | 1.1 | REACTOME INTRINSIC PATHWAY | Genes involved in Intrinsic Pathway |
| 0.1 | 1.4 | REACTOME SMOOTH MUSCLE CONTRACTION | Genes involved in Smooth Muscle Contraction |
| 0.1 | 0.7 | REACTOME AMINE DERIVED HORMONES | Genes involved in Amine-derived hormones |
| 0.1 | 0.5 | REACTOME HORMONE SENSITIVE LIPASE HSL MEDIATED TRIACYLGLYCEROL HYDROLYSIS | Genes involved in Hormone-sensitive lipase (HSL)-mediated triacylglycerol hydrolysis |
| 0.0 | 0.3 | REACTOME HYALURONAN UPTAKE AND DEGRADATION | Genes involved in Hyaluronan uptake and degradation |
| 0.0 | 0.5 | REACTOME LIPOPROTEIN METABOLISM | Genes involved in Lipoprotein metabolism |
| 0.0 | 0.7 | REACTOME METABOLISM OF POLYAMINES | Genes involved in Metabolism of polyamines |
| 0.0 | 0.4 | REACTOME ROLE OF DCC IN REGULATING APOPTOSIS | Genes involved in Role of DCC in regulating apoptosis |
| 0.0 | 0.2 | REACTOME PROSTANOID LIGAND RECEPTORS | Genes involved in Prostanoid ligand receptors |
| 0.0 | 0.3 | REACTOME CD28 DEPENDENT VAV1 PATHWAY | Genes involved in CD28 dependent Vav1 pathway |
| 0.0 | 0.9 | REACTOME AMINO ACID TRANSPORT ACROSS THE PLASMA MEMBRANE | Genes involved in Amino acid transport across the plasma membrane |
| 0.0 | 0.3 | REACTOME ACTIVATION OF BH3 ONLY PROTEINS | Genes involved in Activation of BH3-only proteins |
| 0.0 | 0.6 | REACTOME AMYLOIDS | Genes involved in Amyloids |
| 0.0 | 0.4 | REACTOME SYNTHESIS OF PC | Genes involved in Synthesis of PC |
| 0.0 | 0.2 | REACTOME PYRIMIDINE CATABOLISM | Genes involved in Pyrimidine catabolism |
| 0.0 | 0.2 | REACTOME RECEPTOR LIGAND BINDING INITIATES THE SECOND PROTEOLYTIC CLEAVAGE OF NOTCH RECEPTOR | Genes involved in Receptor-ligand binding initiates the second proteolytic cleavage of Notch receptor |
| 0.0 | 1.5 | REACTOME INTEGRIN CELL SURFACE INTERACTIONS | Genes involved in Integrin cell surface interactions |
| 0.0 | 0.3 | REACTOME REGULATION OF SIGNALING BY CBL | Genes involved in Regulation of signaling by CBL |
| 0.0 | 0.6 | REACTOME SIGNALING BY FGFR1 FUSION MUTANTS | Genes involved in Signaling by FGFR1 fusion mutants |
| 0.0 | 0.2 | REACTOME DARPP 32 EVENTS | Genes involved in DARPP-32 events |
| 0.0 | 1.5 | REACTOME PEPTIDE LIGAND BINDING RECEPTORS | Genes involved in Peptide ligand-binding receptors |
| 0.0 | 0.2 | REACTOME PEPTIDE HORMONE BIOSYNTHESIS | Genes involved in Peptide hormone biosynthesis |
| 0.0 | 0.2 | REACTOME ACTIVATION OF IRF3 IRF7 MEDIATED BY TBK1 IKK EPSILON | Genes involved in Activation of IRF3/IRF7 mediated by TBK1/IKK epsilon |
| 0.0 | 0.2 | REACTOME POST CHAPERONIN TUBULIN FOLDING PATHWAY | Genes involved in Post-chaperonin tubulin folding pathway |
| 0.0 | 0.3 | REACTOME CYTOCHROME P450 ARRANGED BY SUBSTRATE TYPE | Genes involved in Cytochrome P450 - arranged by substrate type |
| 0.0 | 0.9 | REACTOME MHC CLASS II ANTIGEN PRESENTATION | Genes involved in MHC class II antigen presentation |
| 0.0 | 0.2 | REACTOME BILE SALT AND ORGANIC ANION SLC TRANSPORTERS | Genes involved in Bile salt and organic anion SLC transporters |
| 0.0 | 0.1 | REACTOME TRAF6 MEDIATED IRF7 ACTIVATION | Genes involved in TRAF6 mediated IRF7 activation |
| 0.0 | 0.3 | REACTOME SIGNALING BY ROBO RECEPTOR | Genes involved in Signaling by Robo receptor |
| 0.0 | 0.6 | REACTOME RESPONSE TO ELEVATED PLATELET CYTOSOLIC CA2 | Genes involved in Response to elevated platelet cytosolic Ca2+ |