Project
PRJNA195909:zebrafish embryo and larva development
Navigation
Downloads
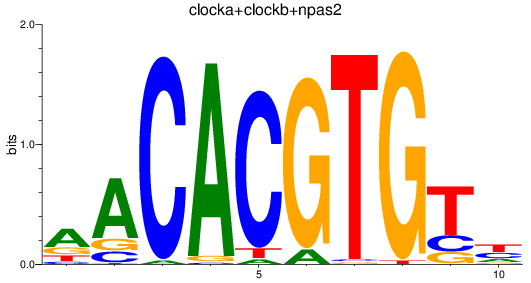
Results for clocka+clockb+npas2
Z-value: 3.48
Motif logo
Transcription factors associated with clocka+clockb+npas2
| Gene Symbol | Gene ID | Gene Info |
|---|---|---|
|
clockb
|
ENSDARG00000003631 | clock circadian regulator b |
|
clocka
|
ENSDARG00000011703 | clock circadian regulator a |
|
npas2
|
ENSDARG00000016536 | neuronal PAS domain protein 2 |
|
npas2
|
ENSDARG00000116993 | neuronal PAS domain protein 2 |
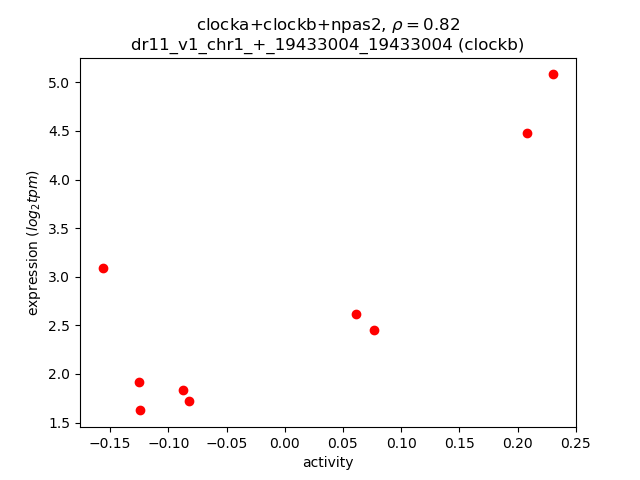
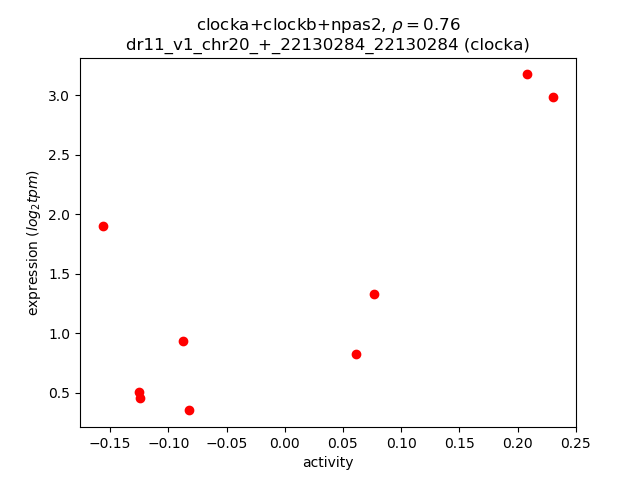
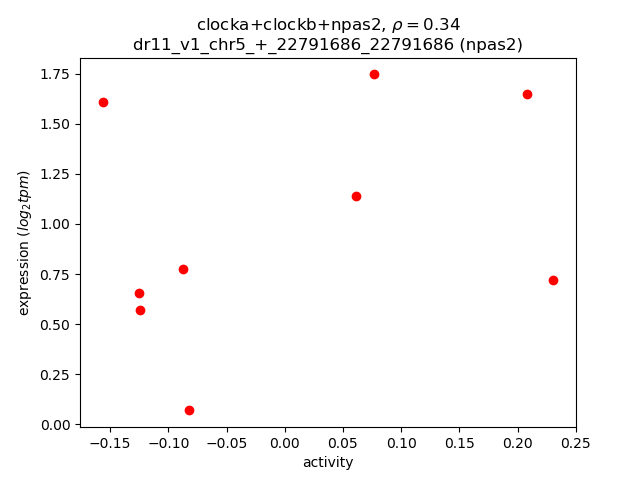
Activity-expression correlation:
| Gene | Promoter | Pearson corr. coef. | P-value | Plot |
|---|---|---|---|---|
| clockb | dr11_v1_chr1_+_19433004_19433004 | 0.82 | 6.3e-03 | Click! |
| clocka | dr11_v1_chr20_+_22130284_22130284 | 0.76 | 1.7e-02 | Click! |
| npas2 | dr11_v1_chr5_+_22791686_22791686 | 0.34 | 3.7e-01 | Click! |
Activity profile of clocka+clockb+npas2 motif
Sorted Z-values of clocka+clockb+npas2 motif
| Promoter | Log-likelihood | Transcript | Gene | Gene Info |
|---|---|---|---|---|
| chr16_-_34195002 | 5.79 |
ENSDART00000054026
|
rcc1
|
regulator of chromosome condensation 1 |
| chr12_+_13091842 | 5.49 |
ENSDART00000185477
ENSDART00000181435 ENSDART00000124799 |
si:ch211-103b1.2
|
si:ch211-103b1.2 |
| chr11_-_12800945 | 5.07 |
ENSDART00000191178
|
txlng
|
taxilin gamma |
| chr11_-_12801157 | 4.94 |
ENSDART00000103449
|
txlng
|
taxilin gamma |
| chr22_-_20695237 | 4.86 |
ENSDART00000112722
|
org
|
oogenesis-related gene |
| chr5_-_16475374 | 4.52 |
ENSDART00000134274
ENSDART00000136004 |
piwil2
|
piwi-like RNA-mediated gene silencing 2 |
| chr9_+_20781047 | 4.38 |
ENSDART00000139174
|
fam46c
|
family with sequence similarity 46, member C |
| chr24_-_38644937 | 3.74 |
ENSDART00000170194
|
slc6a16b
|
solute carrier family 6, member 16b |
| chr5_+_24543862 | 3.61 |
ENSDART00000029699
|
atp6v0a2b
|
ATPase H+ transporting V0 subunit a2b |
| chr24_+_34069675 | 3.60 |
ENSDART00000143995
|
si:ch211-190p8.2
|
si:ch211-190p8.2 |
| chr6_+_38626926 | 3.59 |
ENSDART00000190339
|
atp10a
|
ATPase phospholipid transporting 10A |
| chr22_+_835728 | 3.55 |
ENSDART00000003325
|
dennd2db
|
DENN/MADD domain containing 2Db |
| chr22_+_17261801 | 3.48 |
ENSDART00000192978
ENSDART00000193187 ENSDART00000179953 ENSDART00000134798 |
tdrd5
|
tudor domain containing 5 |
| chr20_+_42537768 | 3.42 |
ENSDART00000134066
ENSDART00000153434 |
si:dkeyp-93d12.1
|
si:dkeyp-93d12.1 |
| chr10_+_22034477 | 3.39 |
ENSDART00000133304
ENSDART00000134189 ENSDART00000021240 ENSDART00000100526 |
npm1a
|
nucleophosmin 1a |
| chr3_-_3398383 | 3.31 |
ENSDART00000047865
|
si:dkey-46g23.2
|
si:dkey-46g23.2 |
| chr15_+_5116179 | 3.25 |
ENSDART00000101937
|
pgm2l1
|
phosphoglucomutase 2-like 1 |
| chr15_-_17099560 | 3.21 |
ENSDART00000101724
|
mos
|
v-mos Moloney murine sarcoma viral oncogene homolog |
| chr15_+_44250335 | 3.14 |
ENSDART00000186162
ENSDART00000193503 ENSDART00000180275 |
zgc:162962
|
zgc:162962 |
| chr1_+_6135176 | 3.09 |
ENSDART00000092324
ENSDART00000179970 |
abcb6a
|
ATP-binding cassette, sub-family B (MDR/TAP), member 6a |
| chr7_-_32021853 | 3.01 |
ENSDART00000134521
|
kif18a
|
kinesin family member 18A |
| chr12_-_33359654 | 2.92 |
ENSDART00000001907
|
slc16a3
|
solute carrier family 16 (monocarboxylate transporter), member 3 |
| chr13_+_8892784 | 2.91 |
ENSDART00000075054
ENSDART00000143705 |
thada
|
thyroid adenoma associated |
| chr18_+_184746 | 2.90 |
ENSDART00000140897
|
larp6a
|
La ribonucleoprotein domain family, member 6a |
| chr13_+_39277178 | 2.85 |
ENSDART00000113259
|
si:dkey-85a20.4
|
si:dkey-85a20.4 |
| chr13_-_24260609 | 2.83 |
ENSDART00000138747
|
urb2
|
URB2 ribosome biogenesis 2 homolog (S. cerevisiae) |
| chr7_+_41812636 | 2.76 |
ENSDART00000174333
|
orc6
|
origin recognition complex, subunit 6 |
| chr2_+_205763 | 2.76 |
ENSDART00000160164
ENSDART00000101071 |
zgc:113293
|
zgc:113293 |
| chr15_-_14038227 | 2.75 |
ENSDART00000139068
|
zgc:114130
|
zgc:114130 |
| chr23_+_43684494 | 2.75 |
ENSDART00000149878
|
otud4
|
OTU deubiquitinase 4 |
| chr20_+_2642855 | 2.74 |
ENSDART00000058775
|
zgc:101562
|
zgc:101562 |
| chr18_+_8917766 | 2.73 |
ENSDART00000145226
|
si:ch211-233h19.2
|
si:ch211-233h19.2 |
| chr13_+_31402067 | 2.67 |
ENSDART00000019202
|
tdrd9
|
tudor domain containing 9 |
| chr24_+_36317544 | 2.67 |
ENSDART00000048640
ENSDART00000156096 |
pus3
|
pseudouridylate synthase 3 |
| chr16_-_21540077 | 2.66 |
ENSDART00000078790
|
stk31
|
serine/threonine kinase 31 |
| chr1_-_26676391 | 2.63 |
ENSDART00000152492
|
trmo
|
tRNA methyltransferase O |
| chr9_+_20780813 | 2.63 |
ENSDART00000142787
|
fam46c
|
family with sequence similarity 46, member C |
| chr14_-_49992709 | 2.62 |
ENSDART00000159988
|
fam193b
|
family with sequence similarity 193, member B |
| chr25_-_8625601 | 2.62 |
ENSDART00000155280
|
GDPGP1
|
zgc:153343 |
| chr1_+_14454663 | 2.61 |
ENSDART00000005067
|
rbpja
|
recombination signal binding protein for immunoglobulin kappa J region a |
| chr17_-_45370200 | 2.61 |
ENSDART00000186208
|
znf106a
|
zinc finger protein 106a |
| chr21_-_44081540 | 2.60 |
ENSDART00000130833
|
FO704810.1
|
|
| chr7_+_47243564 | 2.55 |
ENSDART00000098942
ENSDART00000162237 |
znf507
|
zinc finger protein 507 |
| chr7_+_41812817 | 2.55 |
ENSDART00000174165
|
orc6
|
origin recognition complex, subunit 6 |
| chr3_+_7763114 | 2.53 |
ENSDART00000057434
|
hook2
|
hook microtubule-tethering protein 2 |
| chr1_-_26675969 | 2.51 |
ENSDART00000054184
|
trmo
|
tRNA methyltransferase O |
| chr22_-_11054244 | 2.51 |
ENSDART00000105823
|
insrb
|
insulin receptor b |
| chr16_+_25259313 | 2.46 |
ENSDART00000058938
|
fbxo32
|
F-box protein 32 |
| chr2_-_32594777 | 2.45 |
ENSDART00000134125
|
fastk
|
Fas-activated serine/threonine kinase |
| chr25_-_13871118 | 2.45 |
ENSDART00000160866
|
cry2
|
cryptochrome circadian clock 2 |
| chr13_-_4992395 | 2.43 |
ENSDART00000102651
|
nolc1
|
nucleolar and coiled-body phosphoprotein 1 |
| chr4_-_4570475 | 2.43 |
ENSDART00000184955
|
rassf3
|
Ras association (RalGDS/AF-6) domain family member 3 |
| chr8_-_43689324 | 2.41 |
ENSDART00000159904
|
ep400
|
E1A binding protein p400 |
| chr22_-_19102256 | 2.30 |
ENSDART00000171866
ENSDART00000166295 |
polrmt
|
polymerase (RNA) mitochondrial (DNA directed) |
| chr8_-_53044300 | 2.27 |
ENSDART00000191653
|
nr6a1a
|
nuclear receptor subfamily 6, group A, member 1a |
| chr19_+_43579786 | 2.26 |
ENSDART00000138404
|
si:ch211-199g17.2
|
si:ch211-199g17.2 |
| chr22_-_17653143 | 2.25 |
ENSDART00000089171
|
hmha1b
|
histocompatibility (minor) HA-1 b |
| chr16_+_50741154 | 2.24 |
ENSDART00000101627
|
IGLON5
|
zgc:110372 |
| chr7_+_32021669 | 2.24 |
ENSDART00000173976
|
mettl15
|
methyltransferase like 15 |
| chr10_-_39283883 | 2.22 |
ENSDART00000023831
|
cry5
|
cryptochrome circadian clock 5 |
| chr7_+_41812190 | 2.22 |
ENSDART00000113732
ENSDART00000174137 |
orc6
|
origin recognition complex, subunit 6 |
| chr4_-_14192254 | 2.21 |
ENSDART00000143804
|
pus7l
|
pseudouridylate synthase 7-like |
| chr3_+_24511959 | 2.20 |
ENSDART00000133898
|
dnal4a
|
dynein, axonemal, light chain 4a |
| chr20_-_16453602 | 2.19 |
ENSDART00000006443
|
gtf2a1
|
general transcription factor IIA, 1 |
| chr10_-_14943281 | 2.17 |
ENSDART00000143608
|
smad2
|
SMAD family member 2 |
| chr11_-_2297832 | 2.16 |
ENSDART00000158266
|
znf740a
|
zinc finger protein 740a |
| chr19_+_20201254 | 2.16 |
ENSDART00000010140
|
igf2bp3
|
insulin-like growth factor 2 mRNA binding protein 3 |
| chr5_+_68807170 | 2.14 |
ENSDART00000017849
|
her7
|
hairy and enhancer of split related-7 |
| chr6_-_57476465 | 2.13 |
ENSDART00000128065
|
ddx27
|
DEAD (Asp-Glu-Ala-Asp) box polypeptide 27 |
| chr16_-_38333976 | 2.13 |
ENSDART00000031895
|
cdc42se1
|
CDC42 small effector 1 |
| chr14_+_22076596 | 2.12 |
ENSDART00000106147
ENSDART00000100278 ENSDART00000131489 |
slc43a1a
|
solute carrier family 43 (amino acid system L transporter), member 1a |
| chr13_+_15701849 | 2.12 |
ENSDART00000003517
|
trmt61a
|
tRNA methyltransferase 61A |
| chr14_+_31509922 | 2.11 |
ENSDART00000124499
|
hprt1
|
hypoxanthine phosphoribosyltransferase 1 |
| chr3_-_1339220 | 2.11 |
ENSDART00000172000
|
tmem106c
|
transmembrane protein 106C |
| chr5_+_69950882 | 2.08 |
ENSDART00000097359
|
dnajc25
|
DnaJ (Hsp40) homolog, subfamily C , member 25 |
| chr4_-_12286067 | 2.08 |
ENSDART00000022646
|
cnot4b
|
CCR4-NOT transcription complex, subunit 4b |
| chr5_-_45958838 | 2.08 |
ENSDART00000135072
|
poc5
|
POC5 centriolar protein homolog (Chlamydomonas) |
| chr5_-_18897482 | 2.07 |
ENSDART00000010101
ENSDART00000099434 |
aacs
|
acetoacetyl-CoA synthetase |
| chr14_+_16151636 | 2.02 |
ENSDART00000159352
|
polr1a
|
polymerase (RNA) I polypeptide A |
| chr19_-_47832853 | 2.02 |
ENSDART00000170988
|
ago4
|
argonaute RISC catalytic component 4 |
| chr12_-_33359052 | 2.01 |
ENSDART00000135943
|
slc16a3
|
solute carrier family 16 (monocarboxylate transporter), member 3 |
| chr14_+_35414632 | 2.00 |
ENSDART00000191516
ENSDART00000084914 |
trmt12
|
tRNA methyltransferase 12 homolog (S. cerevisiae) |
| chr21_-_21465111 | 1.99 |
ENSDART00000141487
|
nectin3b
|
nectin cell adhesion molecule 3b |
| chr16_+_40954481 | 1.99 |
ENSDART00000058587
|
gbp
|
glycogen synthase kinase binding protein |
| chr7_+_32021982 | 1.97 |
ENSDART00000173848
|
mettl15
|
methyltransferase like 15 |
| chr23_+_20705849 | 1.95 |
ENSDART00000079538
|
ccdc30
|
coiled-coil domain containing 30 |
| chr21_+_3941758 | 1.94 |
ENSDART00000181345
|
setx
|
senataxin |
| chr13_+_15702142 | 1.93 |
ENSDART00000135960
|
trmt61a
|
tRNA methyltransferase 61A |
| chr12_+_48390715 | 1.93 |
ENSDART00000149351
|
scd
|
stearoyl-CoA desaturase (delta-9-desaturase) |
| chr5_-_33935396 | 1.90 |
ENSDART00000133578
|
si:dkeyp-72a4.1
|
si:dkeyp-72a4.1 |
| chr23_-_17101360 | 1.90 |
ENSDART00000053418
|
dnmt3bb.1
|
DNA (cytosine-5-)-methyltransferase 3 beta, duplicate b.1 |
| chr3_-_18805225 | 1.87 |
ENSDART00000133471
ENSDART00000131758 |
msrb1a
|
methionine sulfoxide reductase B1a |
| chr16_-_5844881 | 1.85 |
ENSDART00000085678
|
trak1a
|
trafficking protein, kinesin binding 1a |
| chr9_-_27391908 | 1.85 |
ENSDART00000135221
|
nepro
|
nucleolus and neural progenitor protein |
| chr23_+_44236281 | 1.84 |
ENSDART00000149842
|
MEPCE
|
si:ch1073-157b13.1 |
| chr13_+_35925490 | 1.84 |
ENSDART00000046115
|
mfsd2aa
|
major facilitator superfamily domain containing 2aa |
| chr17_-_26507289 | 1.84 |
ENSDART00000155616
|
ccser2a
|
coiled-coil serine-rich protein 2a |
| chr15_-_34930727 | 1.83 |
ENSDART00000179723
|
dhx16
|
DEAH (Asp-Glu-Ala-His) box polypeptide 16 |
| chr15_+_14378829 | 1.81 |
ENSDART00000160145
|
si:ch211-11n16.2
|
si:ch211-11n16.2 |
| chr10_+_39283985 | 1.80 |
ENSDART00000016464
|
dcps
|
decapping enzyme, scavenger |
| chr11_+_45092866 | 1.80 |
ENSDART00000163408
|
si:dkey-93h22.8
|
si:dkey-93h22.8 |
| chr16_-_13388821 | 1.80 |
ENSDART00000144062
|
grin2db
|
glutamate receptor, ionotropic, N-methyl D-aspartate 2D, b |
| chr20_-_33675676 | 1.79 |
ENSDART00000147168
|
rock2b
|
rho-associated, coiled-coil containing protein kinase 2b |
| chr1_-_9195629 | 1.78 |
ENSDART00000143587
ENSDART00000192174 |
ern2
|
endoplasmic reticulum to nucleus signaling 2 |
| chr8_-_22288258 | 1.78 |
ENSDART00000140978
ENSDART00000100046 |
si:ch211-147a11.3
|
si:ch211-147a11.3 |
| chr12_+_45150709 | 1.77 |
ENSDART00000112750
|
dhx32a
|
DEAH (Asp-Glu-Ala-His) box polypeptide 32a |
| chr5_-_24543526 | 1.77 |
ENSDART00000046384
|
trmt2a
|
tRNA methyltransferase 2 homolog A |
| chr5_+_13870340 | 1.76 |
ENSDART00000160690
|
hk2
|
hexokinase 2 |
| chr10_+_8437930 | 1.75 |
ENSDART00000074553
|
pptc7b
|
PTC7 protein phosphatase homolog b |
| chr1_+_494297 | 1.75 |
ENSDART00000108579
ENSDART00000146732 |
blzf1
|
basic leucine zipper nuclear factor 1 |
| chr9_+_24065855 | 1.75 |
ENSDART00000161468
ENSDART00000171577 ENSDART00000172743 ENSDART00000159324 ENSDART00000079689 ENSDART00000023196 ENSDART00000101577 |
lrrfip1a
|
leucine rich repeat (in FLII) interacting protein 1a |
| chr24_+_39518774 | 1.74 |
ENSDART00000132939
|
dcun1d3
|
defective in cullin neddylation 1 domain containing 3 |
| chr14_+_16151368 | 1.73 |
ENSDART00000160973
|
polr1a
|
polymerase (RNA) I polypeptide A |
| chr19_+_16016038 | 1.73 |
ENSDART00000131319
|
ctps1a
|
CTP synthase 1a |
| chr9_+_27720428 | 1.73 |
ENSDART00000112415
|
lcmt2
|
leucine carboxyl methyltransferase 2 |
| chr14_+_24845941 | 1.72 |
ENSDART00000187513
|
arhgef37
|
Rho guanine nucleotide exchange factor (GEF) 37 |
| chr18_+_44631789 | 1.71 |
ENSDART00000144271
|
bicra
|
BRD4 interacting chromatin remodeling complex associated protein |
| chr8_-_22288004 | 1.70 |
ENSDART00000100042
|
si:ch211-147a11.3
|
si:ch211-147a11.3 |
| chr12_-_1034383 | 1.69 |
ENSDART00000152455
ENSDART00000152346 |
polr3e
|
polymerase (RNA) III (DNA directed) polypeptide E |
| chr5_+_37744625 | 1.69 |
ENSDART00000014031
|
dpf2
|
D4, zinc and double PHD fingers family 2 |
| chr9_-_3958533 | 1.67 |
ENSDART00000129091
|
ubr3
|
ubiquitin protein ligase E3 component n-recognin 3 |
| chr9_-_27719998 | 1.65 |
ENSDART00000161068
ENSDART00000148195 ENSDART00000138386 |
gtf2e1
|
general transcription factor IIE, polypeptide 1, alpha |
| chr4_+_6869847 | 1.65 |
ENSDART00000036646
|
dock4b
|
dedicator of cytokinesis 4b |
| chr13_-_31025505 | 1.65 |
ENSDART00000137709
|
wdfy4
|
WDFY family member 4 |
| chr20_-_3310017 | 1.65 |
ENSDART00000099315
|
cebpz
|
CCAAT/enhancer binding protein (C/EBP), zeta |
| chr7_+_30201611 | 1.64 |
ENSDART00000075588
|
wdr76
|
WD repeat domain 76 |
| chr9_+_24920677 | 1.62 |
ENSDART00000037025
|
slc39a10
|
solute carrier family 39 (zinc transporter), member 10 |
| chr25_-_14424406 | 1.62 |
ENSDART00000073609
|
prmt7
|
protein arginine methyltransferase 7 |
| chr25_+_16356083 | 1.61 |
ENSDART00000125925
ENSDART00000125444 |
tead1a
|
TEA domain family member 1a |
| chr14_+_30774032 | 1.61 |
ENSDART00000139552
|
atl3
|
atlastin 3 |
| chr8_-_19051906 | 1.60 |
ENSDART00000089024
|
sema6bb
|
sema domain, transmembrane domain (TM), and cytoplasmic domain, (semaphorin) 6Bb |
| chr15_-_26568278 | 1.59 |
ENSDART00000182609
|
wdr81
|
WD repeat domain 81 |
| chr12_-_27588299 | 1.59 |
ENSDART00000178023
ENSDART00000066282 |
dhx8
|
DEAH (Asp-Glu-Ala-His) box polypeptide 8 |
| chr13_+_40635844 | 1.59 |
ENSDART00000137310
|
hpse2
|
heparanase 2 |
| chr16_-_52646789 | 1.58 |
ENSDART00000035761
|
ubr5
|
ubiquitin protein ligase E3 component n-recognin 5 |
| chr5_+_62356304 | 1.58 |
ENSDART00000148381
|
aspa
|
aspartoacylase |
| chr4_-_18840487 | 1.57 |
ENSDART00000066978
|
cbll1
|
Cbl proto-oncogene-like 1, E3 ubiquitin protein ligase |
| chr23_+_7548797 | 1.57 |
ENSDART00000006765
|
tm9sf4
|
transmembrane 9 superfamily protein member 4 |
| chr17_-_49407091 | 1.56 |
ENSDART00000021950
|
mthfd1b
|
methylenetetrahydrofolate dehydrogenase (NADP+ dependent) 1b |
| chr7_+_30202104 | 1.56 |
ENSDART00000173525
|
wdr76
|
WD repeat domain 76 |
| chr1_+_49814942 | 1.55 |
ENSDART00000164936
|
lef1
|
lymphoid enhancer-binding factor 1 |
| chr8_-_52091696 | 1.54 |
ENSDART00000108923
|
vps13a
|
vacuolar protein sorting 13 homolog A (S. cerevisiae) |
| chr9_-_21460164 | 1.54 |
ENSDART00000133469
|
zmym2
|
zinc finger, MYM-type 2 |
| chr8_+_54135642 | 1.54 |
ENSDART00000170712
|
brpf1
|
bromodomain and PHD finger containing, 1 |
| chr16_-_21489514 | 1.52 |
ENSDART00000149525
ENSDART00000148517 ENSDART00000146914 ENSDART00000186493 ENSDART00000193081 ENSDART00000186017 |
mpp6a
|
membrane protein, palmitoylated 6a (MAGUK p55 subfamily member 6) |
| chr15_+_784149 | 1.52 |
ENSDART00000155114
|
znf970
|
zinc finger protein 970 |
| chr13_-_31370184 | 1.52 |
ENSDART00000034829
|
rrp12
|
ribosomal RNA processing 12 homolog |
| chr12_+_29240124 | 1.51 |
ENSDART00000053761
ENSDART00000130172 |
bms1
|
BMS1 ribosome biogenesis factor |
| chr19_-_8940068 | 1.51 |
ENSDART00000043507
|
ciarta
|
circadian associated repressor of transcription a |
| chr5_-_30145939 | 1.51 |
ENSDART00000086795
|
zbtb44
|
zinc finger and BTB domain containing 44 |
| chr25_+_21098675 | 1.50 |
ENSDART00000079012
|
rad52
|
RAD52 homolog, DNA repair protein |
| chr23_-_43595956 | 1.50 |
ENSDART00000162186
|
itchb
|
itchy E3 ubiquitin protein ligase b |
| chr5_-_56416188 | 1.49 |
ENSDART00000146773
|
acaca
|
acetyl-CoA carboxylase alpha |
| chr22_+_1440702 | 1.49 |
ENSDART00000165677
|
si:dkeyp-53d3.3
|
si:dkeyp-53d3.3 |
| chr25_-_35101673 | 1.49 |
ENSDART00000140864
|
zgc:162611
|
zgc:162611 |
| chr25_-_12803723 | 1.48 |
ENSDART00000158787
|
ca5a
|
carbonic anhydrase Va |
| chr12_+_47081783 | 1.48 |
ENSDART00000158568
|
mtr
|
5-methyltetrahydrofolate-homocysteine methyltransferase |
| chr17_-_29249258 | 1.48 |
ENSDART00000031458
|
traf3
|
TNF receptor-associated factor 3 |
| chr5_+_31791001 | 1.48 |
ENSDART00000043010
|
slc25a25b
|
solute carrier family 25 (mitochondrial carrier; phosphate carrier), member 25b |
| chr16_+_35535375 | 1.47 |
ENSDART00000171675
|
cited4b
|
Cbp/p300-interacting transactivator, with Glu/Asp-rich carboxy-terminal domain, 4b |
| chr12_-_21684197 | 1.47 |
ENSDART00000152999
ENSDART00000153109 ENSDART00000148698 |
eme1
|
essential meiotic structure-specific endonuclease 1 |
| chr6_+_58522738 | 1.47 |
ENSDART00000157327
|
arfrp1
|
ADP-ribosylation factor related protein 1 |
| chr17_+_24109012 | 1.46 |
ENSDART00000156251
|
ehbp1
|
EH domain binding protein 1 |
| chr15_-_25304710 | 1.46 |
ENSDART00000190690
|
pafah1b1a
|
platelet-activating factor acetylhydrolase 1b, regulatory subunit 1a |
| chr6_+_58280936 | 1.46 |
ENSDART00000155244
|
ralgapb
|
Ral GTPase activating protein, beta subunit (non-catalytic) |
| chr13_+_11073282 | 1.44 |
ENSDART00000114911
ENSDART00000182462 ENSDART00000148100 ENSDART00000137816 ENSDART00000134888 ENSDART00000131320 |
sdccag8
|
serologically defined colon cancer antigen 8 |
| chr8_+_26879358 | 1.44 |
ENSDART00000132485
|
rimkla
|
ribosomal modification protein rimK-like family member A |
| chr1_+_57347888 | 1.43 |
ENSDART00000104222
|
b3gntl1
|
UDP-GlcNAc:betaGal beta-1,3-N-acetylglucosaminyltransferase-like 1 |
| chr9_-_27720612 | 1.43 |
ENSDART00000000566
|
gtf2e1
|
general transcription factor IIE, polypeptide 1, alpha |
| chr19_+_48359259 | 1.42 |
ENSDART00000167353
|
sgo1
|
shugoshin 1 |
| chr17_+_32158951 | 1.41 |
ENSDART00000165348
ENSDART00000108736 |
adam12
|
ADAM metallopeptidase domain 12 |
| chr6_-_18531349 | 1.41 |
ENSDART00000160693
ENSDART00000169780 |
utp6
|
UTP6, small subunit (SSU) processome component, homolog (yeast) |
| chr13_-_8892514 | 1.39 |
ENSDART00000144553
|
plekhh2
|
pleckstrin homology domain containing, family H (with MyTH4 domain) member 2 |
| chr6_-_40063359 | 1.39 |
ENSDART00000157119
ENSDART00000059636 ENSDART00000156385 |
chchd4b
|
coiled-coil-helix-coiled-coil-helix domain containing 4b |
| chr25_-_37121335 | 1.38 |
ENSDART00000017805
|
nfat5a
|
nuclear factor of activated T cells 5a |
| chr19_+_20201593 | 1.38 |
ENSDART00000163026
|
igf2bp3
|
insulin-like growth factor 2 mRNA binding protein 3 |
| chr13_+_6188759 | 1.38 |
ENSDART00000161062
|
ppm1g
|
protein phosphatase, Mg2+/Mn2+ dependent, 1G |
| chr22_-_5099824 | 1.37 |
ENSDART00000122341
ENSDART00000161345 |
zfr2
|
zinc finger RNA binding protein 2 |
| chr5_-_27994679 | 1.37 |
ENSDART00000132740
|
ppp3cca
|
protein phosphatase 3, catalytic subunit, gamma isozyme, a |
| chr1_-_51219965 | 1.37 |
ENSDART00000146612
|
esf1
|
ESF1, nucleolar pre-rRNA processing protein, homolog (S. cerevisiae) |
| chr5_-_67993086 | 1.37 |
ENSDART00000049331
|
gtf3aa
|
general transcription factor IIIAa |
| chr19_-_18135724 | 1.36 |
ENSDART00000186609
|
cbx3a
|
chromobox homolog 3a (HP1 gamma homolog, Drosophila) |
| chr4_+_17642731 | 1.36 |
ENSDART00000026509
|
cwf19l1
|
CWF19-like 1, cell cycle control |
| chr6_-_18531760 | 1.36 |
ENSDART00000167167
|
utp6
|
UTP6, small subunit (SSU) processome component, homolog (yeast) |
| chr25_+_28555584 | 1.35 |
ENSDART00000157046
|
SLC15A5
|
si:ch211-190o6.3 |
| chr3_-_34586403 | 1.35 |
ENSDART00000151515
|
sept9a
|
septin 9a |
| chr16_-_35427060 | 1.34 |
ENSDART00000172294
|
ctps1b
|
CTP synthase 1b |
| chr18_+_660578 | 1.34 |
ENSDART00000161203
|
CELF6
|
si:dkey-205h23.2 |
| chr2_+_30513887 | 1.34 |
ENSDART00000137048
|
march6
|
membrane-associated ring finger (C3HC4) 6 |
| chr6_+_48978202 | 1.34 |
ENSDART00000150023
|
slc16a1a
|
solute carrier family 16 (monocarboxylate transporter), member 1a |
| chr6_-_7735153 | 1.34 |
ENSDART00000151545
|
slc25a38b
|
solute carrier family 25, member 38b |
| chr21_+_38855551 | 1.33 |
ENSDART00000171977
|
ddx52
|
DEAD (Asp-Glu-Ala-Asp) box polypeptide 52 |
| chr3_-_43662495 | 1.33 |
ENSDART00000166729
|
axin1
|
axin 1 |
| chr23_-_35347714 | 1.33 |
ENSDART00000161770
ENSDART00000165615 |
cpne9
|
copine family member IX |
| chr7_+_29163762 | 1.32 |
ENSDART00000173762
|
slc38a8b
|
solute carrier family 38, member 8b |
| chr10_-_7821686 | 1.32 |
ENSDART00000121531
|
mat2aa
|
methionine adenosyltransferase II, alpha a |
| chr12_-_9700605 | 1.31 |
ENSDART00000161063
|
heatr1
|
HEAT repeat containing 1 |
| chr7_-_1108935 | 1.31 |
ENSDART00000102795
|
dctn1a
|
dynactin 1a |
| chr25_-_35101396 | 1.31 |
ENSDART00000138865
|
zgc:162611
|
zgc:162611 |
| chr9_-_11587070 | 1.30 |
ENSDART00000030995
|
umps
|
uridine monophosphate synthetase |
Network of associatons between targets according to the STRING database.

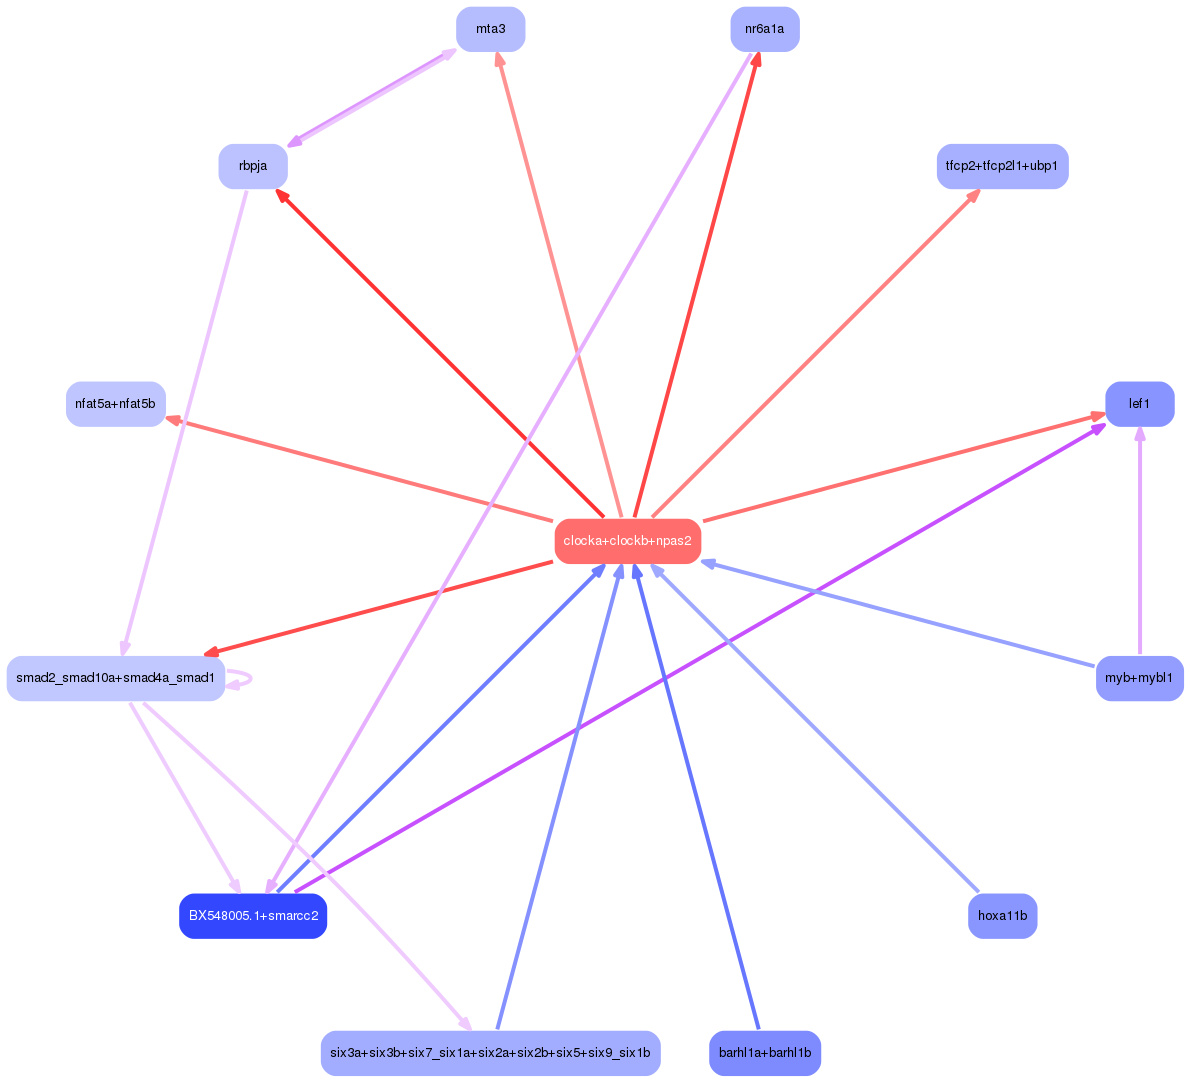
First level regulatory network of clocka+clockb+npas2
Gene Ontology Analysis
Gene overrepresentation in biological process category:
| Log-likelihood per target | Total log-likelihood | Term | Description |
|---|---|---|---|
| 1.2 | 12.3 | GO:0043046 | DNA methylation involved in gamete generation(GO:0043046) |
| 1.1 | 3.2 | GO:1902102 | meiotic cell cycle phase transition(GO:0044771) metaphase/anaphase transition of meiotic cell cycle(GO:0044785) regulation of meiotic cell cycle phase transition(GO:1901993) negative regulation of meiotic cell cycle phase transition(GO:1901994) regulation of metaphase/anaphase transition of meiotic cell cycle(GO:1902102) negative regulation of metaphase/anaphase transition of meiotic cell cycle(GO:1902103) regulation of meiotic chromosome separation(GO:1905132) negative regulation of meiotic chromosome separation(GO:1905133) |
| 1.0 | 3.1 | GO:0001112 | DNA-templated transcriptional open complex formation(GO:0001112) transcriptional open complex formation at RNA polymerase II promoter(GO:0001113) protein-DNA complex remodeling(GO:0001120) |
| 0.9 | 3.7 | GO:0044210 | 'de novo' CTP biosynthetic process(GO:0044210) |
| 0.9 | 2.7 | GO:0045002 | double-strand break repair via single-strand annealing(GO:0045002) |
| 0.8 | 5.8 | GO:1901673 | regulation of mitotic spindle assembly(GO:1901673) |
| 0.7 | 2.1 | GO:0046099 | guanine salvage(GO:0006178) GMP salvage(GO:0032263) guanine biosynthetic process(GO:0046099) |
| 0.7 | 2.7 | GO:2000660 | regulation of interleukin-1-mediated signaling pathway(GO:2000659) negative regulation of interleukin-1-mediated signaling pathway(GO:2000660) |
| 0.7 | 3.3 | GO:1990481 | mRNA pseudouridine synthesis(GO:1990481) |
| 0.7 | 2.6 | GO:0072149 | glomerular visceral epithelial cell fate commitment(GO:0072149) glomerular epithelial cell fate commitment(GO:0072314) |
| 0.6 | 1.9 | GO:0006480 | N-terminal protein amino acid methylation(GO:0006480) |
| 0.6 | 3.2 | GO:2000001 | regulation of DNA damage checkpoint(GO:2000001) |
| 0.6 | 3.1 | GO:0061072 | iris morphogenesis(GO:0061072) |
| 0.6 | 1.7 | GO:0031591 | wybutosine metabolic process(GO:0031590) wybutosine biosynthetic process(GO:0031591) |
| 0.5 | 1.6 | GO:0050861 | positive regulation of B cell receptor signaling pathway(GO:0050861) |
| 0.5 | 1.6 | GO:0035973 | aggrephagy(GO:0035973) |
| 0.5 | 1.6 | GO:0000390 | spliceosomal complex disassembly(GO:0000390) |
| 0.5 | 2.6 | GO:0044205 | 'de novo' UMP biosynthetic process(GO:0044205) |
| 0.5 | 3.0 | GO:2000580 | positive regulation of microtubule motor activity(GO:2000576) regulation of ATP-dependent microtubule motor activity, plus-end-directed(GO:2000580) positive regulation of ATP-dependent microtubule motor activity, plus-end-directed(GO:2000582) |
| 0.5 | 1.9 | GO:1903966 | monounsaturated fatty acid metabolic process(GO:1903964) monounsaturated fatty acid biosynthetic process(GO:1903966) |
| 0.5 | 1.8 | GO:0035633 | maintenance of blood-brain barrier(GO:0035633) |
| 0.4 | 1.3 | GO:1904983 | transmembrane glycine transport from cytosol to mitochondrion(GO:1904983) |
| 0.4 | 3.8 | GO:0000056 | ribosomal small subunit export from nucleus(GO:0000056) |
| 0.4 | 5.4 | GO:0009303 | rRNA transcription(GO:0009303) |
| 0.4 | 1.2 | GO:0060912 | cardiac cell fate specification(GO:0060912) |
| 0.4 | 1.9 | GO:0032776 | DNA methylation on cytosine(GO:0032776) |
| 0.4 | 1.1 | GO:0042256 | mature ribosome assembly(GO:0042256) assembly of large subunit precursor of preribosome(GO:1902626) |
| 0.4 | 1.5 | GO:0051012 | microtubule sliding(GO:0051012) |
| 0.4 | 1.1 | GO:0090069 | regulation of ribosome biogenesis(GO:0090069) |
| 0.4 | 2.2 | GO:0060282 | positive regulation of oocyte development(GO:0060282) |
| 0.4 | 1.8 | GO:0036498 | IRE1-mediated unfolded protein response(GO:0036498) |
| 0.4 | 1.4 | GO:0071962 | mitotic sister chromatid cohesion, centromeric(GO:0071962) |
| 0.3 | 3.1 | GO:0070475 | rRNA base methylation(GO:0070475) |
| 0.3 | 11.8 | GO:0030488 | tRNA methylation(GO:0030488) |
| 0.3 | 1.4 | GO:0045041 | protein import into mitochondrial intermembrane space(GO:0045041) |
| 0.3 | 1.7 | GO:0071596 | ubiquitin-dependent protein catabolic process via the N-end rule pathway(GO:0071596) |
| 0.3 | 1.3 | GO:0090244 | Wnt signaling pathway involved in somitogenesis(GO:0090244) |
| 0.3 | 5.3 | GO:0043001 | Golgi to plasma membrane protein transport(GO:0043001) |
| 0.3 | 0.9 | GO:0051095 | regulation of helicase activity(GO:0051095) positive regulation of helicase activity(GO:0051096) |
| 0.3 | 1.5 | GO:0060784 | regulation of cell proliferation involved in tissue homeostasis(GO:0060784) |
| 0.3 | 1.9 | GO:0098957 | anterograde axonal transport of mitochondrion(GO:0098957) |
| 0.3 | 2.4 | GO:0044528 | regulation of mitochondrial mRNA stability(GO:0044528) |
| 0.3 | 1.2 | GO:0051661 | maintenance of centrosome location(GO:0051661) |
| 0.3 | 2.3 | GO:0006390 | transcription from mitochondrial promoter(GO:0006390) |
| 0.3 | 1.7 | GO:0045721 | negative regulation of gluconeogenesis(GO:0045721) |
| 0.3 | 5.9 | GO:0043153 | entrainment of circadian clock by photoperiod(GO:0043153) |
| 0.3 | 1.1 | GO:2001295 | malonyl-CoA biosynthetic process(GO:2001295) |
| 0.3 | 1.9 | GO:0006369 | termination of RNA polymerase II transcription(GO:0006369) |
| 0.3 | 2.5 | GO:0046716 | muscle cell cellular homeostasis(GO:0046716) |
| 0.3 | 1.6 | GO:0045943 | regulation of transcription from RNA polymerase I promoter(GO:0006356) positive regulation of transcription from RNA polymerase I promoter(GO:0045943) |
| 0.3 | 0.8 | GO:0035971 | peptidyl-histidine dephosphorylation(GO:0035971) |
| 0.3 | 0.8 | GO:0098543 | detection of biotic stimulus(GO:0009595) detection of bacterium(GO:0016045) detection of other organism(GO:0098543) detection of external biotic stimulus(GO:0098581) |
| 0.3 | 2.1 | GO:0046477 | glycosylceramide catabolic process(GO:0046477) |
| 0.3 | 1.6 | GO:1900044 | negative regulation of histone ubiquitination(GO:0033183) regulation of protein K63-linked ubiquitination(GO:1900044) negative regulation of protein K63-linked ubiquitination(GO:1900045) regulation of histone H2A K63-linked ubiquitination(GO:1901314) negative regulation of histone H2A K63-linked ubiquitination(GO:1901315) regulation of protein polyubiquitination(GO:1902914) negative regulation of protein polyubiquitination(GO:1902915) |
| 0.3 | 3.6 | GO:0051452 | vacuolar acidification(GO:0007035) pH reduction(GO:0045851) intracellular pH reduction(GO:0051452) |
| 0.3 | 1.8 | GO:0000290 | deadenylation-dependent decapping of nuclear-transcribed mRNA(GO:0000290) |
| 0.3 | 1.5 | GO:0045053 | protein retention in Golgi apparatus(GO:0045053) |
| 0.3 | 0.8 | GO:0042822 | pyridoxal phosphate metabolic process(GO:0042822) pyridoxal phosphate biosynthetic process(GO:0042823) |
| 0.2 | 1.0 | GO:1903292 | protein localization to Golgi membrane(GO:1903292) |
| 0.2 | 1.3 | GO:0006556 | S-adenosylmethionine biosynthetic process(GO:0006556) |
| 0.2 | 1.5 | GO:0008063 | Toll signaling pathway(GO:0008063) |
| 0.2 | 0.8 | GO:0010032 | meiotic chromosome condensation(GO:0010032) |
| 0.2 | 2.1 | GO:0032024 | positive regulation of insulin secretion(GO:0032024) |
| 0.2 | 1.4 | GO:0006627 | protein processing involved in protein targeting to mitochondrion(GO:0006627) |
| 0.2 | 1.2 | GO:0071051 | polyadenylation-dependent snoRNA 3'-end processing(GO:0071051) |
| 0.2 | 9.3 | GO:0030490 | maturation of SSU-rRNA(GO:0030490) |
| 0.2 | 0.7 | GO:0042754 | negative regulation of circadian rhythm(GO:0042754) |
| 0.2 | 0.8 | GO:1903361 | protein localization to basolateral plasma membrane(GO:1903361) |
| 0.2 | 0.3 | GO:0033314 | mitotic DNA replication checkpoint(GO:0033314) |
| 0.2 | 0.8 | GO:0009113 | purine nucleobase biosynthetic process(GO:0009113) |
| 0.2 | 0.6 | GO:0010259 | multicellular organism aging(GO:0010259) |
| 0.2 | 0.6 | GO:0019287 | isopentenyl diphosphate biosynthetic process, mevalonate pathway(GO:0019287) |
| 0.2 | 0.6 | GO:0070129 | regulation of mitochondrial translation(GO:0070129) positive regulation of mitochondrial translation(GO:0070131) |
| 0.2 | 5.3 | GO:0006270 | DNA replication initiation(GO:0006270) |
| 0.2 | 0.9 | GO:0006788 | heme oxidation(GO:0006788) |
| 0.1 | 2.5 | GO:0051897 | positive regulation of protein kinase B signaling(GO:0051897) |
| 0.1 | 2.3 | GO:0071712 | ER-associated misfolded protein catabolic process(GO:0071712) |
| 0.1 | 0.7 | GO:0043551 | regulation of lipid kinase activity(GO:0043550) regulation of phosphatidylinositol 3-kinase activity(GO:0043551) |
| 0.1 | 0.7 | GO:0030575 | nuclear body organization(GO:0030575) Cajal body organization(GO:0030576) |
| 0.1 | 2.0 | GO:0045974 | miRNA mediated inhibition of translation(GO:0035278) negative regulation of translation, ncRNA-mediated(GO:0040033) regulation of translation, ncRNA-mediated(GO:0045974) |
| 0.1 | 1.0 | GO:0090520 | sphingolipid mediated signaling pathway(GO:0090520) |
| 0.1 | 1.2 | GO:0033211 | adiponectin-activated signaling pathway(GO:0033211) |
| 0.1 | 1.8 | GO:0045747 | positive regulation of Notch signaling pathway(GO:0045747) |
| 0.1 | 1.3 | GO:0008105 | asymmetric protein localization(GO:0008105) apical protein localization(GO:0045176) |
| 0.1 | 0.4 | GO:0019408 | dolichol biosynthetic process(GO:0019408) |
| 0.1 | 1.2 | GO:0015937 | coenzyme A biosynthetic process(GO:0015937) |
| 0.1 | 1.0 | GO:0042987 | beta-amyloid formation(GO:0034205) amyloid precursor protein catabolic process(GO:0042987) |
| 0.1 | 0.6 | GO:0043420 | anthranilate metabolic process(GO:0043420) |
| 0.1 | 1.7 | GO:0045116 | protein neddylation(GO:0045116) |
| 0.1 | 1.9 | GO:0021680 | cerebellar Purkinje cell layer development(GO:0021680) |
| 0.1 | 0.6 | GO:0070086 | ubiquitin-dependent endocytosis(GO:0070086) |
| 0.1 | 1.5 | GO:0044154 | histone H3-K14 acetylation(GO:0044154) |
| 0.1 | 0.5 | GO:0046952 | ketone body catabolic process(GO:0046952) |
| 0.1 | 1.5 | GO:0009086 | methionine biosynthetic process(GO:0009086) |
| 0.1 | 3.6 | GO:0045332 | phospholipid translocation(GO:0045332) |
| 0.1 | 1.5 | GO:0031573 | intra-S DNA damage checkpoint(GO:0031573) |
| 0.1 | 1.6 | GO:0035999 | tetrahydrofolate interconversion(GO:0035999) |
| 0.1 | 1.0 | GO:0044805 | late nucleophagy(GO:0044805) |
| 0.1 | 1.5 | GO:0033173 | calcineurin-NFAT signaling cascade(GO:0033173) |
| 0.1 | 0.1 | GO:0061469 | regulation of type B pancreatic cell proliferation(GO:0061469) |
| 0.1 | 1.2 | GO:0010996 | response to auditory stimulus(GO:0010996) |
| 0.1 | 1.8 | GO:0060079 | excitatory postsynaptic potential(GO:0060079) |
| 0.1 | 1.1 | GO:0006336 | DNA replication-independent nucleosome assembly(GO:0006336) |
| 0.1 | 1.9 | GO:0051156 | glucose 6-phosphate metabolic process(GO:0051156) |
| 0.1 | 1.3 | GO:0006003 | fructose 2,6-bisphosphate metabolic process(GO:0006003) |
| 0.1 | 2.0 | GO:0090557 | establishment of endothelial intestinal barrier(GO:0090557) |
| 0.1 | 1.8 | GO:0034626 | fatty acid elongation, saturated fatty acid(GO:0019367) fatty acid elongation, unsaturated fatty acid(GO:0019368) fatty acid elongation, monounsaturated fatty acid(GO:0034625) fatty acid elongation, polyunsaturated fatty acid(GO:0034626) |
| 0.1 | 2.1 | GO:0001757 | somite specification(GO:0001757) |
| 0.1 | 1.8 | GO:0060287 | epithelial cilium movement involved in determination of left/right asymmetry(GO:0060287) |
| 0.1 | 0.4 | GO:0006107 | oxaloacetate metabolic process(GO:0006107) |
| 0.1 | 1.4 | GO:0001522 | pseudouridine synthesis(GO:0001522) |
| 0.1 | 2.5 | GO:0032922 | circadian regulation of gene expression(GO:0032922) |
| 0.1 | 2.1 | GO:0007632 | visual behavior(GO:0007632) |
| 0.1 | 0.8 | GO:0045580 | regulation of T cell differentiation(GO:0045580) |
| 0.1 | 2.0 | GO:0007286 | spermatid development(GO:0007286) |
| 0.1 | 1.9 | GO:0045454 | cell redox homeostasis(GO:0045454) |
| 0.1 | 1.0 | GO:0061026 | cardiac muscle tissue regeneration(GO:0061026) |
| 0.1 | 0.2 | GO:0071939 | vitamin A transport(GO:0071938) vitamin A import(GO:0071939) |
| 0.1 | 2.8 | GO:1902036 | regulation of hematopoietic stem cell differentiation(GO:1902036) |
| 0.1 | 2.1 | GO:0072015 | glomerular visceral epithelial cell development(GO:0072015) glomerular epithelial cell development(GO:0072310) |
| 0.1 | 1.0 | GO:0016486 | peptide hormone processing(GO:0016486) |
| 0.1 | 3.0 | GO:0007019 | microtubule depolymerization(GO:0007019) |
| 0.1 | 2.6 | GO:0008286 | insulin receptor signaling pathway(GO:0008286) |
| 0.1 | 1.1 | GO:0032508 | DNA geometric change(GO:0032392) DNA duplex unwinding(GO:0032508) |
| 0.1 | 0.4 | GO:0042138 | meiotic DNA double-strand break formation(GO:0042138) |
| 0.1 | 1.4 | GO:0051180 | vitamin transport(GO:0051180) |
| 0.1 | 1.2 | GO:0045047 | protein targeting to ER(GO:0045047) establishment of protein localization to endoplasmic reticulum(GO:0072599) |
| 0.1 | 1.0 | GO:0008354 | germ cell migration(GO:0008354) |
| 0.1 | 0.2 | GO:1903385 | dendrite guidance(GO:0070983) regulation of homophilic cell adhesion(GO:1903385) |
| 0.1 | 2.5 | GO:0031122 | cytoplasmic microtubule organization(GO:0031122) |
| 0.1 | 1.6 | GO:0035329 | hippo signaling(GO:0035329) |
| 0.1 | 2.7 | GO:0007029 | endoplasmic reticulum organization(GO:0007029) |
| 0.1 | 0.8 | GO:0090110 | cargo loading into COPII-coated vesicle(GO:0090110) |
| 0.1 | 0.8 | GO:0045920 | negative regulation of exocytosis(GO:0045920) |
| 0.1 | 0.4 | GO:0043486 | histone exchange(GO:0043486) |
| 0.1 | 0.2 | GO:0015824 | proline transport(GO:0015824) |
| 0.1 | 1.5 | GO:0060972 | left/right pattern formation(GO:0060972) |
| 0.0 | 1.0 | GO:0060729 | maintenance of gastrointestinal epithelium(GO:0030277) intestinal epithelial structure maintenance(GO:0060729) |
| 0.0 | 2.2 | GO:0006367 | transcription initiation from RNA polymerase II promoter(GO:0006367) |
| 0.0 | 0.2 | GO:1902024 | L-histidine transmembrane transport(GO:0089709) L-histidine transport(GO:1902024) |
| 0.0 | 1.2 | GO:0060059 | embryonic retina morphogenesis in camera-type eye(GO:0060059) |
| 0.0 | 4.0 | GO:0006334 | nucleosome assembly(GO:0006334) |
| 0.0 | 4.7 | GO:0006364 | rRNA processing(GO:0006364) |
| 0.0 | 1.4 | GO:0000413 | protein peptidyl-prolyl isomerization(GO:0000413) |
| 0.0 | 1.5 | GO:0070534 | protein K63-linked ubiquitination(GO:0070534) |
| 0.0 | 1.2 | GO:0033338 | medial fin development(GO:0033338) |
| 0.0 | 1.8 | GO:0035987 | endodermal cell differentiation(GO:0035987) |
| 0.0 | 1.1 | GO:0051568 | histone H3-K4 methylation(GO:0051568) |
| 0.0 | 0.9 | GO:0071456 | cellular response to hypoxia(GO:0071456) |
| 0.0 | 3.4 | GO:0051028 | mRNA transport(GO:0051028) |
| 0.0 | 0.6 | GO:0032968 | positive regulation of transcription elongation from RNA polymerase II promoter(GO:0032968) |
| 0.0 | 0.2 | GO:1901073 | chitin biosynthetic process(GO:0006031) glucosamine-containing compound biosynthetic process(GO:1901073) |
| 0.0 | 2.6 | GO:0030433 | ER-associated ubiquitin-dependent protein catabolic process(GO:0030433) |
| 0.0 | 0.8 | GO:0000184 | nuclear-transcribed mRNA catabolic process, nonsense-mediated decay(GO:0000184) |
| 0.0 | 0.1 | GO:0006295 | nucleotide-excision repair, DNA incision, 3'-to lesion(GO:0006295) |
| 0.0 | 0.6 | GO:0006265 | DNA topological change(GO:0006265) |
| 0.0 | 0.4 | GO:0015800 | acidic amino acid transport(GO:0015800) aspartate transport(GO:0015810) L-glutamate transport(GO:0015813) malate-aspartate shuttle(GO:0043490) |
| 0.0 | 2.7 | GO:0006476 | protein deacetylation(GO:0006476) |
| 0.0 | 2.0 | GO:0018107 | peptidyl-threonine phosphorylation(GO:0018107) |
| 0.0 | 0.1 | GO:0010874 | regulation of cholesterol efflux(GO:0010874) |
| 0.0 | 0.6 | GO:0042274 | ribosomal small subunit biogenesis(GO:0042274) |
| 0.0 | 0.6 | GO:0043966 | histone H3 acetylation(GO:0043966) |
| 0.0 | 0.7 | GO:0038061 | NIK/NF-kappaB signaling(GO:0038061) |
| 0.0 | 0.8 | GO:0010212 | response to ionizing radiation(GO:0010212) |
| 0.0 | 0.2 | GO:1902946 | positive regulation of receptor-mediated endocytosis(GO:0048260) protein localization to early endosome(GO:1902946) |
| 0.0 | 0.2 | GO:0006543 | glutamate biosynthetic process(GO:0006537) glutamine catabolic process(GO:0006543) |
| 0.0 | 3.5 | GO:0090630 | activation of GTPase activity(GO:0090630) |
| 0.0 | 0.7 | GO:0045494 | photoreceptor cell maintenance(GO:0045494) |
| 0.0 | 0.2 | GO:0006542 | glutamine biosynthetic process(GO:0006542) |
| 0.0 | 1.1 | GO:0051091 | positive regulation of sequence-specific DNA binding transcription factor activity(GO:0051091) |
| 0.0 | 0.8 | GO:0000077 | DNA damage checkpoint(GO:0000077) |
| 0.0 | 1.0 | GO:0034341 | response to interferon-gamma(GO:0034341) cellular response to interferon-gamma(GO:0071346) cellular response to interleukin-1(GO:0071347) |
| 0.0 | 0.8 | GO:0032924 | activin receptor signaling pathway(GO:0032924) |
| 0.0 | 1.1 | GO:0043123 | positive regulation of I-kappaB kinase/NF-kappaB signaling(GO:0043123) |
| 0.0 | 1.3 | GO:0060218 | hematopoietic stem cell differentiation(GO:0060218) |
| 0.0 | 0.7 | GO:0000387 | spliceosomal snRNP assembly(GO:0000387) |
| 0.0 | 3.2 | GO:0006417 | regulation of translation(GO:0006417) |
| 0.0 | 4.2 | GO:0032259 | methylation(GO:0032259) |
| 0.0 | 1.4 | GO:0007098 | centrosome cycle(GO:0007098) |
| 0.0 | 1.3 | GO:0071277 | cellular response to calcium ion(GO:0071277) |
| 0.0 | 0.5 | GO:0006910 | phagocytosis, recognition(GO:0006910) |
| 0.0 | 1.1 | GO:0048477 | oogenesis(GO:0048477) |
| 0.0 | 2.2 | GO:0048511 | rhythmic process(GO:0048511) |
| 0.0 | 0.2 | GO:0061300 | cerebellum vasculature development(GO:0061300) |
| 0.0 | 0.4 | GO:0034472 | snRNA 3'-end processing(GO:0034472) |
| 0.0 | 0.3 | GO:0042759 | long-chain fatty acid biosynthetic process(GO:0042759) |
| 0.0 | 1.0 | GO:0002028 | regulation of sodium ion transport(GO:0002028) |
| 0.0 | 0.3 | GO:0048096 | chromatin-mediated maintenance of transcription(GO:0048096) |
| 0.0 | 0.9 | GO:0007283 | spermatogenesis(GO:0007283) male gamete generation(GO:0048232) |
| 0.0 | 0.1 | GO:1902262 | apoptotic process involved in patterning of blood vessels(GO:1902262) |
| 0.0 | 0.4 | GO:0006509 | membrane protein ectodomain proteolysis(GO:0006509) |
| 0.0 | 0.1 | GO:0032228 | regulation of synaptic transmission, GABAergic(GO:0032228) |
| 0.0 | 1.3 | GO:0061640 | cytoskeleton-dependent cytokinesis(GO:0061640) |
| 0.0 | 0.3 | GO:0044332 | Wnt signaling pathway involved in dorsal/ventral axis specification(GO:0044332) |
| 0.0 | 0.5 | GO:0030199 | collagen fibril organization(GO:0030199) |
| 0.0 | 0.5 | GO:0005978 | glycogen biosynthetic process(GO:0005978) glucan biosynthetic process(GO:0009250) |
| 0.0 | 0.6 | GO:0003333 | amino acid transmembrane transport(GO:0003333) |
| 0.0 | 0.8 | GO:0006261 | DNA-dependent DNA replication(GO:0006261) |
| 0.0 | 0.7 | GO:0042147 | retrograde transport, endosome to Golgi(GO:0042147) |
| 0.0 | 0.8 | GO:0007030 | Golgi organization(GO:0007030) |
| 0.0 | 0.0 | GO:0034249 | negative regulation of cellular amide metabolic process(GO:0034249) |
| 0.0 | 0.4 | GO:0019882 | antigen processing and presentation(GO:0019882) |
Gene overrepresentation in cellular component category:
| Log-likelihood per target | Total log-likelihood | Term | Description |
|---|---|---|---|
| 1.2 | 3.5 | GO:0033391 | chromatoid body(GO:0033391) |
| 0.9 | 3.7 | GO:0097268 | cytoophidium(GO:0097268) |
| 0.9 | 4.5 | GO:1990923 | PET complex(GO:1990923) |
| 0.8 | 4.1 | GO:0031515 | tRNA (m1A) methyltransferase complex(GO:0031515) |
| 0.8 | 3.0 | GO:0061673 | mitotic spindle astral microtubule(GO:0061673) |
| 0.6 | 3.1 | GO:0005673 | transcription factor TFIIE complex(GO:0005673) |
| 0.6 | 1.8 | GO:1990604 | IRE1-TRAF2-ASK1 complex(GO:1990604) |
| 0.6 | 6.7 | GO:0005664 | origin recognition complex(GO:0000808) nuclear origin of replication recognition complex(GO:0005664) |
| 0.5 | 2.2 | GO:0005672 | transcription factor TFIIA complex(GO:0005672) |
| 0.5 | 2.5 | GO:0005899 | insulin receptor complex(GO:0005899) |
| 0.4 | 2.8 | GO:0034388 | Pwp2p-containing subcomplex of 90S preribosome(GO:0034388) |
| 0.4 | 4.6 | GO:0005736 | DNA-directed RNA polymerase I complex(GO:0005736) |
| 0.4 | 2.3 | GO:0031313 | extrinsic component of endosome membrane(GO:0031313) |
| 0.4 | 1.1 | GO:0034457 | Mpp10 complex(GO:0034457) |
| 0.4 | 1.5 | GO:0008247 | 1-alkyl-2-acetylglycerophosphocholine esterase complex(GO:0008247) |
| 0.4 | 3.6 | GO:0000220 | vacuolar proton-transporting V-type ATPase, V0 domain(GO:0000220) |
| 0.3 | 1.7 | GO:0000839 | Hrd1p ubiquitin ligase ERAD-L complex(GO:0000839) |
| 0.3 | 1.3 | GO:0048269 | methionine adenosyltransferase complex(GO:0048269) |
| 0.3 | 1.3 | GO:0043540 | 6-phosphofructo-2-kinase/fructose-2,6-biphosphatase complex(GO:0043540) |
| 0.3 | 0.9 | GO:0034663 | endoplasmic reticulum chaperone complex(GO:0034663) |
| 0.3 | 2.0 | GO:0016442 | RISC complex(GO:0016442) RNAi effector complex(GO:0031332) |
| 0.2 | 1.5 | GO:0048476 | Holliday junction resolvase complex(GO:0048476) |
| 0.2 | 1.2 | GO:0070724 | BMP receptor complex(GO:0070724) |
| 0.2 | 1.4 | GO:0005955 | calcineurin complex(GO:0005955) |
| 0.2 | 1.3 | GO:0031428 | box C/D snoRNP complex(GO:0031428) |
| 0.2 | 0.8 | GO:0097025 | MPP7-DLG1-LIN7 complex(GO:0097025) |
| 0.2 | 4.0 | GO:0030686 | 90S preribosome(GO:0030686) |
| 0.2 | 1.3 | GO:0030877 | beta-catenin destruction complex(GO:0030877) |
| 0.2 | 0.6 | GO:0035327 | transcriptionally active chromatin(GO:0035327) |
| 0.2 | 2.3 | GO:0071014 | post-mRNA release spliceosomal complex(GO:0071014) |
| 0.2 | 0.8 | GO:0071203 | WASH complex(GO:0071203) |
| 0.1 | 1.2 | GO:0031616 | spindle pole centrosome(GO:0031616) |
| 0.1 | 2.1 | GO:0032391 | photoreceptor connecting cilium(GO:0032391) |
| 0.1 | 1.2 | GO:0030688 | preribosome, small subunit precursor(GO:0030688) |
| 0.1 | 0.8 | GO:0070876 | SOSS complex(GO:0070876) |
| 0.1 | 1.8 | GO:0017146 | NMDA selective glutamate receptor complex(GO:0017146) |
| 0.1 | 1.2 | GO:0000177 | cytoplasmic exosome (RNase complex)(GO:0000177) |
| 0.1 | 0.9 | GO:0009295 | nucleoid(GO:0009295) mitochondrial nucleoid(GO:0042645) |
| 0.1 | 0.6 | GO:0042720 | mitochondrial inner membrane peptidase complex(GO:0042720) |
| 0.1 | 2.2 | GO:0071144 | SMAD2-SMAD3 protein complex(GO:0071144) |
| 0.1 | 2.7 | GO:0043186 | P granule(GO:0043186) |
| 0.1 | 0.8 | GO:0000796 | condensin complex(GO:0000796) |
| 0.1 | 0.9 | GO:0005671 | Ada2/Gcn5/Ada3 transcription activator complex(GO:0005671) |
| 0.1 | 2.1 | GO:0030014 | CCR4-NOT complex(GO:0030014) |
| 0.1 | 0.3 | GO:0008622 | epsilon DNA polymerase complex(GO:0008622) |
| 0.1 | 1.5 | GO:0070776 | H3 histone acetyltransferase complex(GO:0070775) MOZ/MORF histone acetyltransferase complex(GO:0070776) |
| 0.1 | 0.7 | GO:0032797 | SMN complex(GO:0032797) |
| 0.1 | 1.2 | GO:0031462 | Cul2-RING ubiquitin ligase complex(GO:0031462) |
| 0.1 | 1.2 | GO:0015030 | Cajal body(GO:0015030) |
| 0.1 | 20.3 | GO:0005730 | nucleolus(GO:0005730) |
| 0.1 | 1.1 | GO:0044545 | NSL complex(GO:0044545) |
| 0.1 | 1.5 | GO:1990907 | beta-catenin-TCF complex(GO:1990907) |
| 0.1 | 0.3 | GO:0001405 | presequence translocase-associated import motor(GO:0001405) |
| 0.1 | 4.3 | GO:0030286 | dynein complex(GO:0030286) |
| 0.1 | 3.8 | GO:0005788 | endoplasmic reticulum lumen(GO:0005788) |
| 0.1 | 0.9 | GO:0005666 | DNA-directed RNA polymerase III complex(GO:0005666) |
| 0.1 | 1.2 | GO:0042555 | MCM complex(GO:0042555) |
| 0.1 | 6.5 | GO:0000786 | nucleosome(GO:0000786) DNA packaging complex(GO:0044815) |
| 0.1 | 1.1 | GO:0048188 | Set1C/COMPASS complex(GO:0048188) |
| 0.1 | 0.8 | GO:0048179 | activin receptor complex(GO:0048179) |
| 0.1 | 1.5 | GO:0071011 | precatalytic spliceosome(GO:0071011) |
| 0.1 | 0.3 | GO:0035032 | phosphatidylinositol 3-kinase complex, class III(GO:0035032) |
| 0.1 | 0.6 | GO:0000124 | SAGA complex(GO:0000124) |
| 0.1 | 1.2 | GO:0030867 | rough endoplasmic reticulum membrane(GO:0030867) |
| 0.1 | 1.0 | GO:0090545 | NuRD complex(GO:0016581) CHD-type complex(GO:0090545) |
| 0.1 | 1.6 | GO:0071013 | catalytic step 2 spliceosome(GO:0071013) |
| 0.1 | 1.1 | GO:0043596 | nuclear replication fork(GO:0043596) |
| 0.0 | 0.4 | GO:0042613 | MHC class II protein complex(GO:0042613) |
| 0.0 | 0.9 | GO:0016281 | eukaryotic translation initiation factor 4F complex(GO:0016281) |
| 0.0 | 2.0 | GO:0031941 | filamentous actin(GO:0031941) |
| 0.0 | 0.4 | GO:0000812 | Swr1 complex(GO:0000812) |
| 0.0 | 0.8 | GO:0030127 | COPII vesicle coat(GO:0030127) |
| 0.0 | 5.0 | GO:0030176 | integral component of endoplasmic reticulum membrane(GO:0030176) |
| 0.0 | 1.0 | GO:0000407 | pre-autophagosomal structure(GO:0000407) |
| 0.0 | 1.3 | GO:0032156 | septin ring(GO:0005940) septin complex(GO:0031105) septin cytoskeleton(GO:0032156) |
| 0.0 | 1.8 | GO:0000932 | cytoplasmic mRNA processing body(GO:0000932) |
| 0.0 | 0.2 | GO:0005782 | peroxisomal matrix(GO:0005782) microbody lumen(GO:0031907) |
| 0.0 | 0.4 | GO:0097346 | Ino80 complex(GO:0031011) DNA helicase complex(GO:0033202) INO80-type complex(GO:0097346) |
| 0.0 | 1.0 | GO:0016605 | PML body(GO:0016605) |
| 0.0 | 0.2 | GO:0030428 | cell septum(GO:0030428) |
| 0.0 | 2.1 | GO:0000428 | DNA-directed RNA polymerase complex(GO:0000428) |
| 0.0 | 0.5 | GO:0042571 | immunoglobulin complex, circulating(GO:0042571) |
| 0.0 | 0.4 | GO:0017053 | transcriptional repressor complex(GO:0017053) |
| 0.0 | 2.9 | GO:0043296 | apical junction complex(GO:0043296) |
| 0.0 | 1.9 | GO:0016604 | nuclear body(GO:0016604) |
| 0.0 | 1.0 | GO:0097014 | axoneme(GO:0005930) ciliary plasm(GO:0097014) |
| 0.0 | 0.1 | GO:0071141 | SMAD protein complex(GO:0071141) |
| 0.0 | 1.6 | GO:0005681 | spliceosomal complex(GO:0005681) |
| 0.0 | 0.3 | GO:0031680 | G-protein beta/gamma-subunit complex(GO:0031680) |
| 0.0 | 1.5 | GO:0000776 | kinetochore(GO:0000776) |
| 0.0 | 0.9 | GO:0000118 | histone deacetylase complex(GO:0000118) |
| 0.0 | 2.0 | GO:0005802 | trans-Golgi network(GO:0005802) |
| 0.0 | 1.3 | GO:0030139 | endocytic vesicle(GO:0030139) |
| 0.0 | 1.1 | GO:0031902 | late endosome membrane(GO:0031902) |
| 0.0 | 0.2 | GO:0014704 | intercalated disc(GO:0014704) |
| 0.0 | 0.5 | GO:0090544 | BAF-type complex(GO:0090544) |
| 0.0 | 0.1 | GO:0031464 | Cul4A-RING E3 ubiquitin ligase complex(GO:0031464) |
| 0.0 | 1.4 | GO:0005769 | early endosome(GO:0005769) |
| 0.0 | 6.6 | GO:0005654 | nucleoplasm(GO:0005654) |
| 0.0 | 3.2 | GO:0005813 | centrosome(GO:0005813) |
| 0.0 | 2.8 | GO:0005667 | transcription factor complex(GO:0005667) |
| 0.0 | 2.5 | GO:0005774 | vacuolar membrane(GO:0005774) |
| 0.0 | 3.1 | GO:0000151 | ubiquitin ligase complex(GO:0000151) |
| 0.0 | 0.0 | GO:0035339 | SPOTS complex(GO:0035339) |
Gene overrepresentation in molecular function category:
| Log-likelihood per target | Total log-likelihood | Term | Description |
|---|---|---|---|
| 1.3 | 9.2 | GO:0016426 | tRNA (adenine) methyltransferase activity(GO:0016426) |
| 1.0 | 3.1 | GO:0016434 | rRNA (cytosine) methyltransferase activity(GO:0016434) |
| 0.9 | 3.7 | GO:0003883 | CTP synthase activity(GO:0003883) |
| 0.8 | 2.5 | GO:0072591 | N-acetyl-L-aspartate-L-glutamate ligase activity(GO:0072590) citrate-L-glutamate ligase activity(GO:0072591) |
| 0.7 | 2.2 | GO:0003913 | DNA photolyase activity(GO:0003913) |
| 0.7 | 2.1 | GO:0004422 | hypoxanthine phosphoribosyltransferase activity(GO:0004422) |
| 0.6 | 1.9 | GO:0001147 | transcription termination site sequence-specific DNA binding(GO:0001147) transcription termination site DNA binding(GO:0001160) |
| 0.6 | 1.9 | GO:0071885 | N-terminal protein N-methyltransferase activity(GO:0071885) |
| 0.6 | 4.5 | GO:0034584 | piRNA binding(GO:0034584) |
| 0.5 | 1.6 | GO:0035243 | protein-arginine omega-N symmetric methyltransferase activity(GO:0035243) |
| 0.5 | 6.0 | GO:0015129 | lactate transmembrane transporter activity(GO:0015129) |
| 0.5 | 2.5 | GO:0005009 | insulin-activated receptor activity(GO:0005009) insulin receptor substrate binding(GO:0043560) |
| 0.5 | 1.9 | GO:0004768 | stearoyl-CoA 9-desaturase activity(GO:0004768) acyl-CoA desaturase activity(GO:0016215) palmitoyl-CoA 9-desaturase activity(GO:0032896) |
| 0.5 | 1.9 | GO:0033745 | L-methionine-(R)-S-oxide reductase activity(GO:0033745) |
| 0.4 | 1.7 | GO:0034511 | U3 snoRNA binding(GO:0034511) |
| 0.4 | 1.3 | GO:0016743 | carboxyl- or carbamoyltransferase activity(GO:0016743) |
| 0.4 | 3.1 | GO:0015232 | heme transporter activity(GO:0015232) |
| 0.4 | 1.9 | GO:0003980 | UDP-glucose:glycoprotein glucosyltransferase activity(GO:0003980) |
| 0.3 | 1.0 | GO:0017050 | D-erythro-sphingosine kinase activity(GO:0017050) |
| 0.3 | 1.3 | GO:0004478 | methionine adenosyltransferase activity(GO:0004478) |
| 0.3 | 3.2 | GO:0035198 | miRNA binding(GO:0035198) |
| 0.3 | 1.8 | GO:0005536 | glucokinase activity(GO:0004340) hexokinase activity(GO:0004396) glucose binding(GO:0005536) fructokinase activity(GO:0008865) mannokinase activity(GO:0019158) |
| 0.3 | 5.5 | GO:0009982 | pseudouridine synthase activity(GO:0009982) |
| 0.3 | 0.8 | GO:0050135 | NAD(P)+ nucleosidase activity(GO:0050135) |
| 0.3 | 1.1 | GO:0003989 | acetyl-CoA carboxylase activity(GO:0003989) |
| 0.3 | 7.4 | GO:0034062 | DNA-directed RNA polymerase activity(GO:0003899) RNA polymerase activity(GO:0034062) |
| 0.3 | 3.3 | GO:0016868 | intramolecular transferase activity, phosphotransferases(GO:0016868) |
| 0.3 | 0.8 | GO:0016019 | peptidoglycan receptor activity(GO:0016019) |
| 0.3 | 0.8 | GO:0000035 | acyl binding(GO:0000035) |
| 0.2 | 3.6 | GO:0051117 | ATPase binding(GO:0051117) |
| 0.2 | 2.1 | GO:0004791 | thioredoxin-disulfide reductase activity(GO:0004791) |
| 0.2 | 0.9 | GO:0034416 | bisphosphoglycerate phosphatase activity(GO:0034416) |
| 0.2 | 1.4 | GO:0004723 | calcium-dependent protein serine/threonine phosphatase activity(GO:0004723) calmodulin-dependent protein phosphatase activity(GO:0033192) |
| 0.2 | 1.8 | GO:0050072 | m7G(5')pppN diphosphatase activity(GO:0050072) |
| 0.2 | 1.8 | GO:0072518 | Rho-dependent protein serine/threonine kinase activity(GO:0072518) |
| 0.2 | 1.6 | GO:0004329 | formate-tetrahydrofolate ligase activity(GO:0004329) |
| 0.2 | 6.6 | GO:0008175 | tRNA methyltransferase activity(GO:0008175) |
| 0.2 | 3.3 | GO:0030515 | snoRNA binding(GO:0030515) |
| 0.2 | 0.8 | GO:0097016 | L27 domain binding(GO:0097016) |
| 0.2 | 0.8 | GO:0101006 | protein histidine phosphatase activity(GO:0101006) |
| 0.2 | 1.2 | GO:0004594 | pantothenate kinase activity(GO:0004594) |
| 0.2 | 1.5 | GO:0031419 | cobalamin binding(GO:0031419) |
| 0.2 | 1.1 | GO:0043023 | ribosomal large subunit binding(GO:0043023) |
| 0.2 | 0.9 | GO:0004565 | beta-galactosidase activity(GO:0004565) |
| 0.2 | 2.7 | GO:0061578 | Lys63-specific deubiquitinase activity(GO:0061578) |
| 0.2 | 13.7 | GO:0003724 | RNA helicase activity(GO:0003724) |
| 0.2 | 1.1 | GO:0035035 | histone acetyltransferase binding(GO:0035035) |
| 0.2 | 0.9 | GO:0004392 | heme oxygenase (decyclizing) activity(GO:0004392) |
| 0.1 | 1.0 | GO:0035173 | histone kinase activity(GO:0035173) |
| 0.1 | 1.9 | GO:0003886 | DNA (cytosine-5-)-methyltransferase activity(GO:0003886) |
| 0.1 | 1.3 | GO:0072320 | volume-sensitive chloride channel activity(GO:0072320) |
| 0.1 | 5.5 | GO:0051959 | dynein light intermediate chain binding(GO:0051959) |
| 0.1 | 0.4 | GO:1902945 | metalloendopeptidase activity involved in amyloid precursor protein catabolic process(GO:1902945) |
| 0.1 | 0.5 | GO:0004373 | glycogen (starch) synthase activity(GO:0004373) |
| 0.1 | 2.4 | GO:0008301 | DNA binding, bending(GO:0008301) |
| 0.1 | 0.9 | GO:0008118 | N-acetyllactosaminide alpha-2,3-sialyltransferase activity(GO:0008118) |
| 0.1 | 1.4 | GO:0090482 | vitamin transmembrane transporter activity(GO:0090482) |
| 0.1 | 1.2 | GO:0016909 | JUN kinase activity(GO:0004705) SAP kinase activity(GO:0016909) |
| 0.1 | 1.5 | GO:0043994 | H3 histone acetyltransferase activity(GO:0010484) histone acetyltransferase activity (H3-K23 specific)(GO:0043994) |
| 0.1 | 0.5 | GO:0008260 | 3-oxoacid CoA-transferase activity(GO:0008260) |
| 0.1 | 2.2 | GO:0070411 | I-SMAD binding(GO:0070411) |
| 0.1 | 1.5 | GO:0070840 | dynein complex binding(GO:0070840) |
| 0.1 | 10.5 | GO:0019905 | syntaxin binding(GO:0019905) |
| 0.1 | 2.0 | GO:0050811 | GABA receptor binding(GO:0050811) |
| 0.1 | 1.2 | GO:0005025 | transforming growth factor beta receptor activity, type I(GO:0005025) |
| 0.1 | 1.2 | GO:0047555 | 3',5'-cyclic-GMP phosphodiesterase activity(GO:0047555) |
| 0.1 | 1.3 | GO:0032041 | histone deacetylase activity (H3-K14 specific)(GO:0031078) NAD-dependent histone deacetylase activity (H3-K14 specific)(GO:0032041) |
| 0.1 | 0.6 | GO:0008502 | melatonin receptor activity(GO:0008502) |
| 0.1 | 1.3 | GO:0004331 | 6-phosphofructo-2-kinase activity(GO:0003873) fructose-2,6-bisphosphate 2-phosphatase activity(GO:0004331) |
| 0.1 | 3.0 | GO:0008574 | ATP-dependent microtubule motor activity, plus-end-directed(GO:0008574) |
| 0.1 | 1.8 | GO:0004972 | NMDA glutamate receptor activity(GO:0004972) |
| 0.1 | 0.4 | GO:0047751 | 3-oxo-5-alpha-steroid 4-dehydrogenase activity(GO:0003865) steroid dehydrogenase activity, acting on the CH-CH group of donors(GO:0033765) enone reductase activity(GO:0035671) cholestenone 5-alpha-reductase activity(GO:0047751) |
| 0.1 | 1.7 | GO:0097602 | cullin family protein binding(GO:0097602) |
| 0.1 | 4.4 | GO:0071949 | FAD binding(GO:0071949) |
| 0.1 | 1.8 | GO:0102337 | fatty acid elongase activity(GO:0009922) 3-oxo-arachidoyl-CoA synthase activity(GO:0102336) 3-oxo-cerotoyl-CoA synthase activity(GO:0102337) 3-oxo-lignoceronyl-CoA synthase activity(GO:0102338) |
| 0.1 | 0.7 | GO:0003835 | beta-galactoside alpha-2,6-sialyltransferase activity(GO:0003835) |
| 0.1 | 1.1 | GO:0070530 | K63-linked polyubiquitin binding(GO:0070530) |
| 0.1 | 0.4 | GO:0097027 | ubiquitin-protein transferase activator activity(GO:0097027) |
| 0.1 | 7.3 | GO:0003730 | mRNA 3'-UTR binding(GO:0003730) |
| 0.1 | 0.6 | GO:0004067 | asparaginase activity(GO:0004067) |
| 0.1 | 1.0 | GO:0004724 | magnesium-dependent protein serine/threonine phosphatase activity(GO:0004724) |
| 0.1 | 0.8 | GO:0043014 | alpha-tubulin binding(GO:0043014) |
| 0.1 | 1.0 | GO:0016018 | cyclosporin A binding(GO:0016018) |
| 0.1 | 3.2 | GO:0005347 | ATP transmembrane transporter activity(GO:0005347) |
| 0.1 | 2.0 | GO:0030374 | ligand-dependent nuclear receptor transcription coactivator activity(GO:0030374) |
| 0.1 | 0.8 | GO:0017002 | activin-activated receptor activity(GO:0017002) |
| 0.1 | 2.2 | GO:0035014 | phosphatidylinositol 3-kinase regulator activity(GO:0035014) |
| 0.1 | 1.5 | GO:0005385 | zinc ion transmembrane transporter activity(GO:0005385) |
| 0.1 | 2.1 | GO:0043022 | ribosome binding(GO:0043022) |
| 0.1 | 2.3 | GO:0003727 | single-stranded RNA binding(GO:0003727) |
| 0.1 | 1.0 | GO:0016846 | carbon-sulfur lyase activity(GO:0016846) |
| 0.1 | 0.7 | GO:0047631 | ADP-ribose diphosphatase activity(GO:0047631) |
| 0.1 | 1.1 | GO:0080025 | phosphatidylinositol-3,5-bisphosphate binding(GO:0080025) |
| 0.0 | 2.7 | GO:0004521 | endoribonuclease activity(GO:0004521) |
| 0.0 | 0.3 | GO:0036042 | long-chain fatty acyl-CoA binding(GO:0036042) |
| 0.0 | 1.4 | GO:0015035 | protein disulfide oxidoreductase activity(GO:0015035) |
| 0.0 | 0.2 | GO:0015187 | glycine transmembrane transporter activity(GO:0015187) |
| 0.0 | 0.6 | GO:0003917 | DNA topoisomerase type I activity(GO:0003917) |
| 0.0 | 1.5 | GO:0005164 | tumor necrosis factor receptor binding(GO:0005164) |
| 0.0 | 5.6 | GO:0042803 | protein homodimerization activity(GO:0042803) |
| 0.0 | 0.6 | GO:0004017 | adenylate kinase activity(GO:0004017) |
| 0.0 | 6.9 | GO:0046982 | protein heterodimerization activity(GO:0046982) |
| 0.0 | 0.4 | GO:0005049 | nuclear export signal receptor activity(GO:0005049) |
| 0.0 | 1.3 | GO:0051010 | microtubule plus-end binding(GO:0051010) |
| 0.0 | 2.1 | GO:0031491 | nucleosome binding(GO:0031491) |
| 0.0 | 0.3 | GO:0070181 | small ribosomal subunit rRNA binding(GO:0070181) |
| 0.0 | 0.6 | GO:0031729 | CCR1 chemokine receptor binding(GO:0031726) CCR4 chemokine receptor binding(GO:0031729) |
| 0.0 | 0.5 | GO:0004687 | myosin light chain kinase activity(GO:0004687) |
| 0.0 | 2.7 | GO:0015171 | amino acid transmembrane transporter activity(GO:0015171) |
| 0.0 | 0.6 | GO:0030544 | Hsp70 protein binding(GO:0030544) |
| 0.0 | 1.0 | GO:0001103 | RNA polymerase II repressing transcription factor binding(GO:0001103) |
| 0.0 | 3.7 | GO:0004386 | helicase activity(GO:0004386) |
| 0.0 | 0.3 | GO:0001222 | transcription corepressor binding(GO:0001222) |
| 0.0 | 2.1 | GO:0016811 | hydrolase activity, acting on carbon-nitrogen (but not peptide) bonds, in linear amides(GO:0016811) |
| 0.0 | 0.3 | GO:0003689 | DNA clamp loader activity(GO:0003689) protein-DNA loading ATPase activity(GO:0033170) |
| 0.0 | 0.5 | GO:0043021 | ribonucleoprotein complex binding(GO:0043021) |
| 0.0 | 1.0 | GO:0017147 | Wnt-protein binding(GO:0017147) |
| 0.0 | 10.7 | GO:0005085 | guanyl-nucleotide exchange factor activity(GO:0005085) |
| 0.0 | 5.4 | GO:0042393 | histone binding(GO:0042393) |
| 0.0 | 0.2 | GO:0034632 | retinol transporter activity(GO:0034632) |
| 0.0 | 0.6 | GO:0051371 | muscle alpha-actinin binding(GO:0051371) alpha-actinin binding(GO:0051393) |
| 0.0 | 0.2 | GO:0004356 | glutamate-ammonia ligase activity(GO:0004356) ammonia ligase activity(GO:0016211) acid-ammonia (or amide) ligase activity(GO:0016880) |
| 0.0 | 1.7 | GO:0004722 | protein serine/threonine phosphatase activity(GO:0004722) |
| 0.0 | 0.2 | GO:0004100 | chitin synthase activity(GO:0004100) |
| 0.0 | 1.0 | GO:0005540 | hyaluronic acid binding(GO:0005540) |
| 0.0 | 0.5 | GO:0034987 | immunoglobulin receptor binding(GO:0034987) |
| 0.0 | 0.4 | GO:0035497 | cAMP response element binding(GO:0035497) |
| 0.0 | 0.3 | GO:0035591 | signaling adaptor activity(GO:0035591) |
| 0.0 | 0.1 | GO:0000254 | C-4 methylsterol oxidase activity(GO:0000254) |
| 0.0 | 1.8 | GO:0001227 | transcriptional repressor activity, RNA polymerase II transcription regulatory region sequence-specific binding(GO:0001227) |
| 0.0 | 3.8 | GO:0015293 | symporter activity(GO:0015293) |
| 0.0 | 1.2 | GO:0030170 | pyridoxal phosphate binding(GO:0030170) |
| 0.0 | 0.2 | GO:0005452 | inorganic anion exchanger activity(GO:0005452) |
| 0.0 | 0.9 | GO:0003697 | single-stranded DNA binding(GO:0003697) |
| 0.0 | 0.9 | GO:0017124 | SH3 domain binding(GO:0017124) |
| 0.0 | 0.7 | GO:0004864 | protein phosphatase inhibitor activity(GO:0004864) |
| 0.0 | 1.3 | GO:0043130 | ubiquitin binding(GO:0043130) |
| 0.0 | 0.1 | GO:0004300 | enoyl-CoA hydratase activity(GO:0004300) |
| 0.0 | 1.4 | GO:0003713 | transcription coactivator activity(GO:0003713) |
| 0.0 | 2.6 | GO:0004222 | metalloendopeptidase activity(GO:0004222) |
| 0.0 | 1.3 | GO:0016278 | lysine N-methyltransferase activity(GO:0016278) protein-lysine N-methyltransferase activity(GO:0016279) |
| 0.0 | 1.3 | GO:0005544 | calcium-dependent phospholipid binding(GO:0005544) |
| 0.0 | 0.4 | GO:0048020 | CCR chemokine receptor binding(GO:0048020) |
| 0.0 | 0.1 | GO:0032052 | bile acid binding(GO:0032052) |
| 0.0 | 2.1 | GO:0004518 | nuclease activity(GO:0004518) |
| 0.0 | 0.3 | GO:0031681 | G-protein beta-subunit binding(GO:0031681) |
| 0.0 | 2.5 | GO:0003682 | chromatin binding(GO:0003682) |
| 0.0 | 0.8 | GO:0051540 | iron-sulfur cluster binding(GO:0051536) metal cluster binding(GO:0051540) |
| 0.0 | 0.1 | GO:0030504 | inorganic diphosphate transmembrane transporter activity(GO:0030504) |
| 0.0 | 4.9 | GO:0061630 | ubiquitin protein ligase activity(GO:0061630) |
| 0.0 | 0.1 | GO:0015665 | alcohol transmembrane transporter activity(GO:0015665) |
| 0.0 | 0.2 | GO:0044183 | protein binding involved in protein folding(GO:0044183) |
| 0.0 | 0.1 | GO:0004062 | aryl sulfotransferase activity(GO:0004062) |
| 0.0 | 0.7 | GO:0031625 | ubiquitin protein ligase binding(GO:0031625) |
| 0.0 | 0.1 | GO:0016861 | intramolecular oxidoreductase activity, interconverting aldoses and ketoses(GO:0016861) |
| 0.0 | 1.5 | GO:0008134 | transcription factor binding(GO:0008134) |
| 0.0 | 1.4 | GO:0060090 | binding, bridging(GO:0060090) |
Gene overrepresentation in curated gene sets: canonical pathways category:
| Log-likelihood per target | Total log-likelihood | Term | Description |
|---|---|---|---|
| 0.2 | 7.3 | PID FRA PATHWAY | Validated transcriptional targets of AP1 family members Fra1 and Fra2 |
| 0.2 | 3.5 | PID CIRCADIAN PATHWAY | Circadian rhythm pathway |
| 0.2 | 2.2 | PID SMAD2 3PATHWAY | Regulation of cytoplasmic and nuclear SMAD2/3 signaling |
| 0.2 | 4.5 | ST ERK1 ERK2 MAPK PATHWAY | ERK1/ERK2 MAPK Pathway |
| 0.1 | 8.5 | PID MYC ACTIV PATHWAY | Validated targets of C-MYC transcriptional activation |
| 0.1 | 1.6 | PID WNT CANONICAL PATHWAY | Canonical Wnt signaling pathway |
| 0.1 | 3.3 | PID FOXO PATHWAY | FoxO family signaling |
| 0.1 | 1.4 | PID SYNDECAN 4 PATHWAY | Syndecan-4-mediated signaling events |
| 0.1 | 3.0 | PID AJDISS 2PATHWAY | Posttranslational regulation of adherens junction stability and dissassembly |
| 0.1 | 1.1 | PID ERB GENOMIC PATHWAY | Validated nuclear estrogen receptor beta network |
| 0.1 | 1.8 | PID HIF1 TFPATHWAY | HIF-1-alpha transcription factor network |
| 0.0 | 0.7 | PID S1P META PATHWAY | Sphingosine 1-phosphate (S1P) pathway |
| 0.0 | 1.1 | PID P38 MKK3 6PATHWAY | p38 MAPK signaling pathway |
| 0.0 | 1.3 | PID HDAC CLASSII PATHWAY | Signaling events mediated by HDAC Class II |
| 0.0 | 1.2 | PID ATM PATHWAY | ATM pathway |
| 0.0 | 1.1 | SIG PIP3 SIGNALING IN CARDIAC MYOCTES | Genes related to PIP3 signaling in cardiac myocytes |
| 0.0 | 1.7 | PID CMYB PATHWAY | C-MYB transcription factor network |
| 0.0 | 0.7 | PID HEDGEHOG GLI PATHWAY | Hedgehog signaling events mediated by Gli proteins |
| 0.0 | 1.6 | PID P53 DOWNSTREAM PATHWAY | Direct p53 effectors |
| 0.0 | 0.6 | PID TELOMERASE PATHWAY | Regulation of Telomerase |
| 0.0 | 0.4 | PID PRL SIGNALING EVENTS PATHWAY | Signaling events mediated by PRL |
| 0.0 | 0.4 | PID P38 ALPHA BETA DOWNSTREAM PATHWAY | Signaling mediated by p38-alpha and p38-beta |
Gene overrepresentation in curated gene sets: REACTOME pathways category:
| Log-likelihood per target | Total log-likelihood | Term | Description |
|---|---|---|---|
| 0.4 | 6.7 | REACTOME E2F ENABLED INHIBITION OF PRE REPLICATION COMPLEX FORMATION | Genes involved in E2F-enabled inhibition of pre-replication complex formation |
| 0.3 | 4.7 | REACTOME BILE SALT AND ORGANIC ANION SLC TRANSPORTERS | Genes involved in Bile salt and organic anion SLC transporters |
| 0.3 | 3.0 | REACTOME MRNA DECAY BY 3 TO 5 EXORIBONUCLEASE | Genes involved in mRNA Decay by 3' to 5' Exoribonuclease |
| 0.2 | 1.8 | REACTOME GLUCOSE TRANSPORT | Genes involved in Glucose transport |
| 0.2 | 2.2 | REACTOME SIGNALING BY NODAL | Genes involved in Signaling by NODAL |
| 0.2 | 2.1 | REACTOME PURINE SALVAGE | Genes involved in Purine salvage |
| 0.2 | 3.8 | REACTOME RNA POL I TRANSCRIPTION TERMINATION | Genes involved in RNA Polymerase I Transcription Termination |
| 0.2 | 5.9 | REACTOME RNA POL II TRANSCRIPTION PRE INITIATION AND PROMOTER OPENING | Genes involved in RNA Polymerase II Transcription Pre-Initiation And Promoter Opening |
| 0.2 | 3.2 | REACTOME RNA POL III TRANSCRIPTION TERMINATION | Genes involved in RNA Polymerase III Transcription Termination |
| 0.2 | 3.5 | REACTOME HOMOLOGOUS RECOMBINATION REPAIR OF REPLICATION INDEPENDENT DOUBLE STRAND BREAKS | Genes involved in Homologous recombination repair of replication-independent double-strand breaks |
| 0.1 | 3.0 | REACTOME KINESINS | Genes involved in Kinesins |
| 0.1 | 2.6 | REACTOME PYRIMIDINE METABOLISM | Genes involved in Pyrimidine metabolism |
| 0.1 | 1.5 | REACTOME REVERSIBLE HYDRATION OF CARBON DIOXIDE | Genes involved in Reversible Hydration of Carbon Dioxide |
| 0.1 | 1.5 | REACTOME ACTIVATION OF IRF3 IRF7 MEDIATED BY TBK1 IKK EPSILON | Genes involved in Activation of IRF3/IRF7 mediated by TBK1/IKK epsilon |
| 0.1 | 1.2 | REACTOME ACTIVATION OF THE AP1 FAMILY OF TRANSCRIPTION FACTORS | Genes involved in Activation of the AP-1 family of transcription factors |
| 0.1 | 1.6 | REACTOME ZINC TRANSPORTERS | Genes involved in Zinc transporters |
| 0.1 | 1.9 | REACTOME CALNEXIN CALRETICULIN CYCLE | Genes involved in Calnexin/calreticulin cycle |
| 0.1 | 1.0 | REACTOME HYALURONAN UPTAKE AND DEGRADATION | Genes involved in Hyaluronan uptake and degradation |
| 0.1 | 1.5 | REACTOME FATTY ACYL COA BIOSYNTHESIS | Genes involved in Fatty Acyl-CoA Biosynthesis |
| 0.1 | 1.3 | REACTOME PRE NOTCH PROCESSING IN GOLGI | Genes involved in Pre-NOTCH Processing in Golgi |
| 0.1 | 1.1 | REACTOME TRAF6 MEDIATED INDUCTION OF TAK1 COMPLEX | Genes involved in TRAF6 mediated induction of TAK1 complex |
| 0.1 | 5.7 | REACTOME LATE PHASE OF HIV LIFE CYCLE | Genes involved in Late Phase of HIV Life Cycle |
| 0.1 | 1.6 | REACTOME HS GAG DEGRADATION | Genes involved in HS-GAG degradation |
| 0.1 | 2.9 | REACTOME BMAL1 CLOCK NPAS2 ACTIVATES CIRCADIAN EXPRESSION | Genes involved in BMAL1:CLOCK/NPAS2 Activates Circadian Expression |
| 0.1 | 1.0 | REACTOME THE ACTIVATION OF ARYLSULFATASES | Genes involved in The activation of arylsulfatases |
| 0.1 | 1.2 | REACTOME CGMP EFFECTS | Genes involved in cGMP effects |
| 0.1 | 3.6 | REACTOME ION TRANSPORT BY P TYPE ATPASES | Genes involved in Ion transport by P-type ATPases |
| 0.1 | 1.5 | REACTOME SULFUR AMINO ACID METABOLISM | Genes involved in Sulfur amino acid metabolism |
| 0.1 | 1.5 | REACTOME SIGNALING BY FGFR1 FUSION MUTANTS | Genes involved in Signaling by FGFR1 fusion mutants |
| 0.1 | 1.8 | REACTOME RNA POL I RNA POL III AND MITOCHONDRIAL TRANSCRIPTION | Genes involved in RNA Polymerase I, RNA Polymerase III, and Mitochondrial Transcription |
| 0.1 | 0.7 | REACTOME SYNTHESIS OF PIPS AT THE LATE ENDOSOME MEMBRANE | Genes involved in Synthesis of PIPs at the late endosome membrane |
| 0.1 | 0.4 | REACTOME ACTIVATION OF CHAPERONE GENES BY ATF6 ALPHA | Genes involved in Activation of Chaperone Genes by ATF6-alpha |
| 0.0 | 0.6 | REACTOME TRYPTOPHAN CATABOLISM | Genes involved in Tryptophan catabolism |
| 0.0 | 4.1 | REACTOME DIABETES PATHWAYS | Genes involved in Diabetes pathways |
| 0.0 | 0.9 | REACTOME GLYCOSPHINGOLIPID METABOLISM | Genes involved in Glycosphingolipid metabolism |
| 0.0 | 0.4 | REACTOME ANDROGEN BIOSYNTHESIS | Genes involved in Androgen biosynthesis |
| 0.0 | 1.0 | REACTOME SPHINGOLIPID DE NOVO BIOSYNTHESIS | Genes involved in Sphingolipid de novo biosynthesis |
| 0.0 | 1.4 | REACTOME LOSS OF NLP FROM MITOTIC CENTROSOMES | Genes involved in Loss of Nlp from mitotic centrosomes |
| 0.0 | 0.3 | REACTOME SYNTHESIS OF BILE ACIDS AND BILE SALTS | Genes involved in Synthesis of bile acids and bile salts |
| 0.0 | 0.3 | REACTOME COMMON PATHWAY | Genes involved in Common Pathway |
| 0.0 | 0.8 | REACTOME CYTOSOLIC TRNA AMINOACYLATION | Genes involved in Cytosolic tRNA aminoacylation |
| 0.0 | 0.7 | REACTOME N GLYCAN ANTENNAE ELONGATION | Genes involved in N-Glycan antennae elongation |
| 0.0 | 0.6 | REACTOME CHOLESTEROL BIOSYNTHESIS | Genes involved in Cholesterol biosynthesis |
| 0.0 | 1.3 | REACTOME METABOLISM OF VITAMINS AND COFACTORS | Genes involved in Metabolism of vitamins and cofactors |
| 0.0 | 0.9 | REACTOME NOTCH1 INTRACELLULAR DOMAIN REGULATES TRANSCRIPTION | Genes involved in NOTCH1 Intracellular Domain Regulates Transcription |
| 0.0 | 0.9 | REACTOME INTEGRATION OF ENERGY METABOLISM | Genes involved in Integration of energy metabolism |
| 0.0 | 0.3 | REACTOME THROMBOXANE SIGNALLING THROUGH TP RECEPTOR | Genes involved in Thromboxane signalling through TP receptor |
| 0.0 | 0.2 | REACTOME GABA SYNTHESIS RELEASE REUPTAKE AND DEGRADATION | Genes involved in GABA synthesis, release, reuptake and degradation |
| 0.0 | 1.7 | REACTOME MRNA SPLICING | Genes involved in mRNA Splicing |
| 0.0 | 0.2 | REACTOME PTM GAMMA CARBOXYLATION HYPUSINE FORMATION AND ARYLSULFATASE ACTIVATION | Genes involved in PTM: gamma carboxylation, hypusine formation and arylsulfatase activation |
| 0.0 | 0.4 | REACTOME ACTIVATION OF ATR IN RESPONSE TO REPLICATION STRESS | Genes involved in Activation of ATR in response to replication stress |
| 0.0 | 0.2 | REACTOME G ALPHA Z SIGNALLING EVENTS | Genes involved in G alpha (z) signalling events |
| 0.0 | 0.1 | REACTOME HDL MEDIATED LIPID TRANSPORT | Genes involved in HDL-mediated lipid transport |
| 0.0 | 1.0 | REACTOME SIGNALING BY EGFR IN CANCER | Genes involved in Signaling by EGFR in Cancer |