Project
PRJEB1986: zebrafish developmental stages transcriptome
Navigation
Downloads
Results for tfap2d
Z-value: 0.43
Motif logo
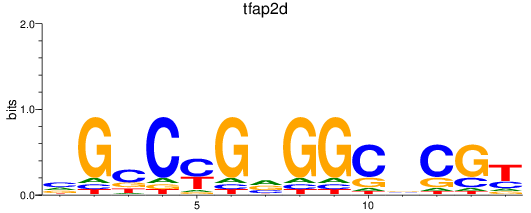
Transcription factors associated with tfap2d
| Gene Symbol | Gene ID | Gene Info |
|---|---|---|
|
tfap2d
|
ENSDARG00000023272 | transcription factor AP-2 delta (activating enhancer binding protein 2 delta) |
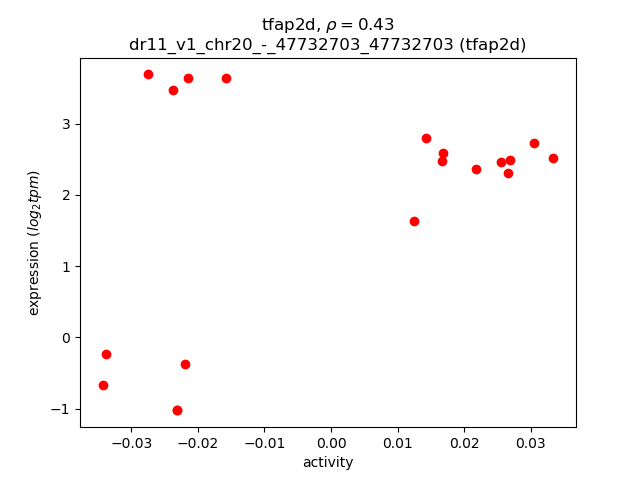
Activity-expression correlation:
| Gene | Promoter | Pearson corr. coef. | P-value | Plot |
|---|---|---|---|---|
| tfap2d | dr11_v1_chr20_-_47732703_47732703 | 0.43 | 6.7e-02 | Click! |
Activity profile of tfap2d motif
Sorted Z-values of tfap2d motif
| Promoter | Log-likelihood | Transcript | Gene | Gene Info |
|---|---|---|---|---|
| chr5_+_6796291 | 1.03 |
ENSDART00000166868
ENSDART00000165308 |
me2
|
malic enzyme 2, NAD(+)-dependent, mitochondrial |
| chr23_-_41762797 | 1.01 |
ENSDART00000186564
|
stk35
|
serine/threonine kinase 35 |
| chr23_-_41762956 | 0.91 |
ENSDART00000128302
|
stk35
|
serine/threonine kinase 35 |
| chr4_-_77557279 | 0.87 |
ENSDART00000180113
|
AL935186.10
|
|
| chr17_-_19022990 | 0.66 |
ENSDART00000154186
|
flrt2
|
fibronectin leucine rich transmembrane protein 2 |
| chr5_-_26936861 | 0.63 |
ENSDART00000191032
|
htra4
|
HtrA serine peptidase 4 |
| chr22_-_57177 | 0.60 |
ENSDART00000163959
|
CABZ01085139.1
|
|
| chr8_+_50946379 | 0.57 |
ENSDART00000139649
|
b2ml
|
beta-2-microglobulin, like |
| chr22_-_188102 | 0.53 |
ENSDART00000125391
ENSDART00000170463 |
CABZ01052268.1
|
|
| chr20_-_14925281 | 0.40 |
ENSDART00000152641
|
dnm3a
|
dynamin 3a |
| chr21_-_5856050 | 0.38 |
ENSDART00000115367
|
CABZ01071020.1
|
|
| chr12_-_19007834 | 0.35 |
ENSDART00000153248
|
chadlb
|
chondroadherin-like b |
| chr14_+_29609245 | 0.32 |
ENSDART00000043058
|
TENM2
|
si:dkey-34l15.2 |
| chr10_-_322769 | 0.26 |
ENSDART00000165244
|
akt2l
|
v-akt murine thymoma viral oncogene homolog 2, like |
| chr9_-_4511613 | 0.24 |
ENSDART00000168921
|
kcnj3a
|
potassium inwardly-rectifying channel, subfamily J, member 3a |
| chr25_+_2415131 | 0.21 |
ENSDART00000162210
|
zmp:0000000932
|
zmp:0000000932 |
| chr17_+_52823015 | 0.19 |
ENSDART00000160507
ENSDART00000186979 |
meis2a
|
Meis homeobox 2a |
| chr16_+_54588930 | 0.18 |
ENSDART00000159174
|
dennd4b
|
DENN/MADD domain containing 4B |
| chr5_+_42388464 | 0.16 |
ENSDART00000191596
|
BX548073.13
|
|
| chr14_+_52369262 | 0.06 |
ENSDART00000169352
ENSDART00000157833 |
igfbp7
|
insulin-like growth factor binding protein 7 |
| chr17_-_868004 | 0.06 |
ENSDART00000112803
|
wdr20a
|
WD repeat domain 20a |
| chr10_-_373575 | 0.03 |
ENSDART00000114487
|
DMPK
|
DM1 protein kinase |
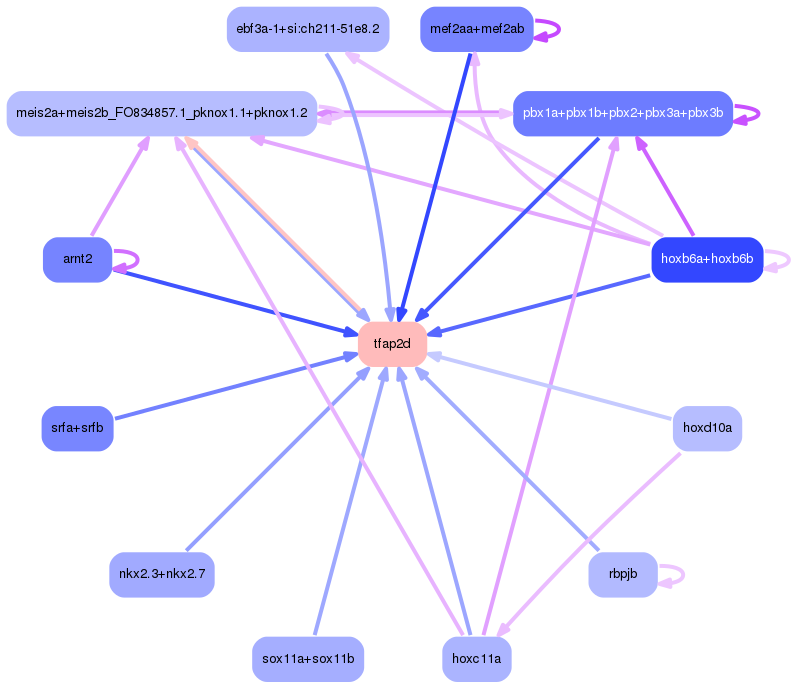
Network of associatons between targets according to the STRING database.

First level regulatory network of tfap2d
Gene Ontology Analysis
Gene overrepresentation in biological process category:
| Log-likelihood per target | Total log-likelihood | Term | Description |
|---|---|---|---|
| 0.1 | 1.0 | GO:0006108 | malate metabolic process(GO:0006108) |
| 0.0 | 0.6 | GO:0002474 | antigen processing and presentation of peptide antigen via MHC class I(GO:0002474) |
| 0.0 | 0.4 | GO:0098884 | postsynaptic neurotransmitter receptor internalization(GO:0098884) |
| 0.0 | 0.2 | GO:0032483 | regulation of Rab protein signal transduction(GO:0032483) |
| 0.0 | 1.9 | GO:0051321 | meiotic cell cycle(GO:0051321) |
Gene overrepresentation in cellular component category:
| Log-likelihood per target | Total log-likelihood | Term | Description |
|---|---|---|---|
| 0.1 | 0.6 | GO:0042612 | MHC class I protein complex(GO:0042612) |
| 0.0 | 0.4 | GO:0098844 | postsynaptic endocytic zone membrane(GO:0098844) |
Gene overrepresentation in molecular function category:
| Log-likelihood per target | Total log-likelihood | Term | Description |
|---|---|---|---|
| 0.3 | 1.0 | GO:0004473 | malic enzyme activity(GO:0004470) malate dehydrogenase (decarboxylating) (NAD+) activity(GO:0004471) malate dehydrogenase (decarboxylating) (NADP+) activity(GO:0004473) |
| 0.0 | 0.2 | GO:0015467 | G-protein activated inward rectifier potassium channel activity(GO:0015467) |
| 0.0 | 0.7 | GO:0005520 | insulin-like growth factor binding(GO:0005520) |