Project
PRJEB1986: zebrafish developmental stages transcriptome
Navigation
Downloads
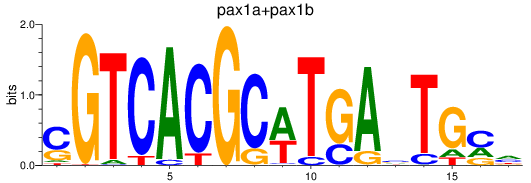
Results for pax1a+pax1b_pax9
Z-value: 0.56
Motif logo
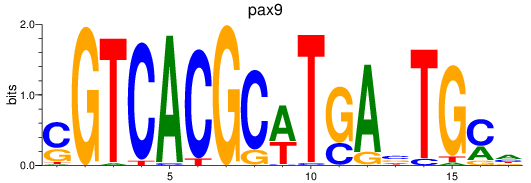
Transcription factors associated with pax1a+pax1b_pax9
| Gene Symbol | Gene ID | Gene Info |
|---|---|---|
|
pax1a
|
ENSDARG00000008203 | paired box 1a |
|
pax1b
|
ENSDARG00000073814 | paired box 1b |
|
pax9
|
ENSDARG00000053829 | paired box 9 |
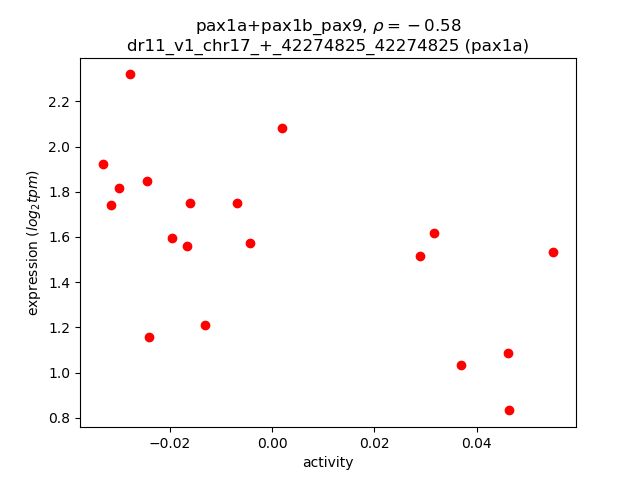
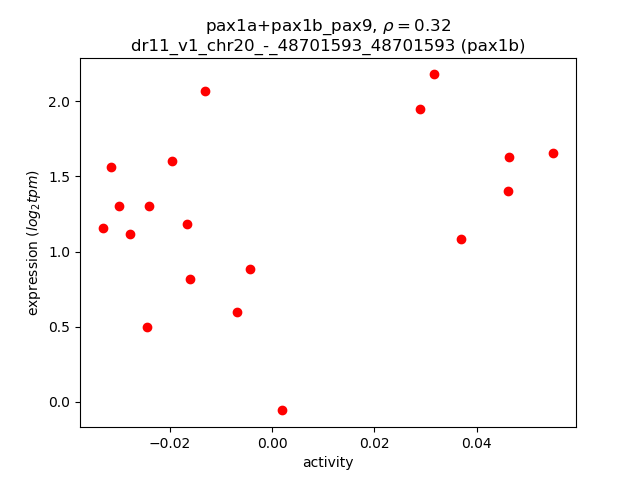
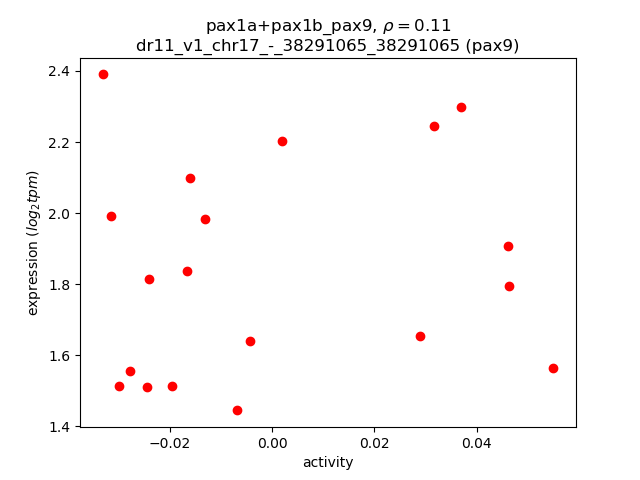
Activity-expression correlation:
| Gene | Promoter | Pearson corr. coef. | P-value | Plot |
|---|---|---|---|---|
| pax1a | dr11_v1_chr17_+_42274825_42274825 | -0.58 | 9.2e-03 | Click! |
| pax1b | dr11_v1_chr20_-_48701593_48701593 | 0.32 | 1.9e-01 | Click! |
| pax9 | dr11_v1_chr17_-_38291065_38291065 | 0.11 | 6.5e-01 | Click! |
Activity profile of pax1a+pax1b_pax9 motif
Sorted Z-values of pax1a+pax1b_pax9 motif
| Promoter | Log-likelihood | Transcript | Gene | Gene Info |
|---|---|---|---|---|
| chr12_-_7854216 | 2.40 |
ENSDART00000149594
|
ank3b
|
ankyrin 3b |
| chr3_+_49021079 | 2.04 |
ENSDART00000162012
|
zgc:163083
|
zgc:163083 |
| chr20_+_29587995 | 1.92 |
ENSDART00000153339
|
adam17b
|
ADAM metallopeptidase domain 17b |
| chr2_-_44283554 | 1.34 |
ENSDART00000184684
|
mpz
|
myelin protein zero |
| chr8_+_48965767 | 1.32 |
ENSDART00000008058
|
aak1a
|
AP2 associated kinase 1a |
| chr8_+_48966165 | 1.23 |
ENSDART00000165425
|
aak1a
|
AP2 associated kinase 1a |
| chr12_-_18483348 | 1.04 |
ENSDART00000152757
|
tex2l
|
testis expressed 2, like |
| chr2_-_44282796 | 0.91 |
ENSDART00000163040
ENSDART00000166923 ENSDART00000056372 ENSDART00000109251 ENSDART00000132682 |
mpz
|
myelin protein zero |
| chr1_-_46343999 | 0.91 |
ENSDART00000145117
ENSDART00000193233 |
atp11a
|
ATPase phospholipid transporting 11A |
| chr2_+_394166 | 0.90 |
ENSDART00000155733
|
mylk4a
|
myosin light chain kinase family, member 4a |
| chr5_-_29643381 | 0.69 |
ENSDART00000034849
|
grin1b
|
glutamate receptor, ionotropic, N-methyl D-aspartate 1b |
| chr21_+_13861589 | 0.60 |
ENSDART00000015629
ENSDART00000171306 |
stxbp1a
|
syntaxin binding protein 1a |
| chr22_+_28337204 | 0.51 |
ENSDART00000163352
|
impg2b
|
interphotoreceptor matrix proteoglycan 2b |
| chr25_-_29087925 | 0.51 |
ENSDART00000171758
|
rpp25a
|
ribonuclease P and MRP subunit p25, a |
| chr8_-_16650595 | 0.46 |
ENSDART00000135319
|
osbpl9
|
oxysterol binding protein-like 9 |
| chr6_-_41079209 | 0.40 |
ENSDART00000151592
|
rab44
|
RAB44, member RAS oncogene family |
| chr9_+_38074082 | 0.34 |
ENSDART00000017833
|
cacnb4a
|
calcium channel, voltage-dependent, beta 4a subunit |
| chr14_+_2487672 | 0.34 |
ENSDART00000170629
ENSDART00000123063 |
fgf18a
|
fibroblast growth factor 18a |
| chr5_-_201600 | 0.33 |
ENSDART00000158495
|
CABZ01088906.1
|
|
| chr25_+_6306885 | 0.31 |
ENSDART00000142705
ENSDART00000067510 |
crabp1a
|
cellular retinoic acid binding protein 1a |
| chr7_-_6553460 | 0.29 |
ENSDART00000172903
|
si:ch1073-220m6.1
|
si:ch1073-220m6.1 |
| chr4_-_52783184 | 0.29 |
ENSDART00000172283
|
si:dkey-4j21.2
|
si:dkey-4j21.2 |
| chr4_-_8902406 | 0.21 |
ENSDART00000192962
|
mpped1
|
metallophosphoesterase domain containing 1 |
| chr20_+_12702923 | 0.21 |
ENSDART00000163499
|
zgc:153383
|
zgc:153383 |
| chr13_-_24379271 | 0.16 |
ENSDART00000046360
|
rhoua
|
ras homolog family member Ua |
| chr14_+_23518110 | 0.15 |
ENSDART00000112930
|
si:ch211-221f10.2
|
si:ch211-221f10.2 |
| chr6_-_31224563 | 0.13 |
ENSDART00000104616
|
lepr
|
leptin receptor |
| chr9_-_13871935 | 0.13 |
ENSDART00000146597
|
raph1a
|
Ras association (RalGDS/AF-6) and pleckstrin homology domains 1a |
| chr23_+_9522781 | 0.12 |
ENSDART00000136486
|
osbpl2b
|
oxysterol binding protein-like 2b |
| chr10_-_39154594 | 0.11 |
ENSDART00000148825
|
slc37a4b
|
solute carrier family 37 (glucose-6-phosphate transporter), member 4b |
| chr12_-_47774807 | 0.09 |
ENSDART00000193831
|
LO017725.1
|
|
| chr7_+_26545502 | 0.08 |
ENSDART00000140528
|
tnk1
|
tyrosine kinase, non-receptor, 1 |
| chr11_+_37278457 | 0.03 |
ENSDART00000188946
|
creld1a
|
cysteine-rich with EGF-like domains 1a |
| chr9_+_34334156 | 0.03 |
ENSDART00000144272
|
pou2f1b
|
POU class 2 homeobox 1b |
| chr13_-_35984530 | 0.02 |
ENSDART00000143488
|
si:ch211-67f13.8
|
si:ch211-67f13.8 |
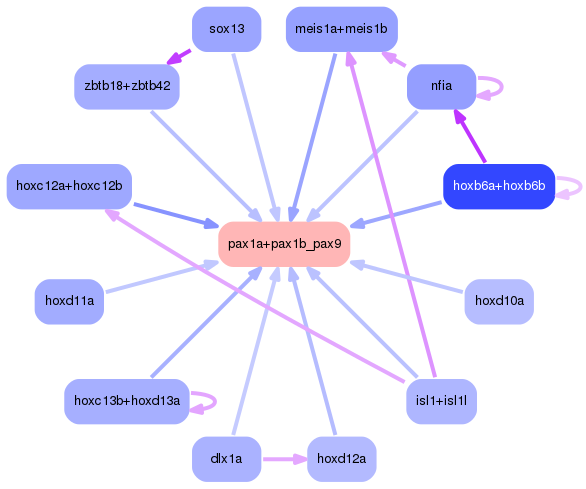
Network of associatons between targets according to the STRING database.

First level regulatory network of pax1a+pax1b_pax9
Gene Ontology Analysis
Gene overrepresentation in biological process category:
| Log-likelihood per target | Total log-likelihood | Term | Description |
|---|---|---|---|
| 0.2 | 2.6 | GO:2000369 | regulation of clathrin-mediated endocytosis(GO:2000369) |
| 0.1 | 0.3 | GO:0016115 | diterpenoid catabolic process(GO:0016103) terpenoid catabolic process(GO:0016115) retinoic acid catabolic process(GO:0034653) |
| 0.1 | 1.7 | GO:0006509 | membrane protein ectodomain proteolysis(GO:0006509) |
| 0.1 | 0.5 | GO:0001682 | tRNA 5'-leader removal(GO:0001682) |
| 0.0 | 0.7 | GO:0035235 | ionotropic glutamate receptor signaling pathway(GO:0035235) |
| 0.0 | 0.9 | GO:0045332 | phospholipid translocation(GO:0045332) |
| 0.0 | 1.0 | GO:0006904 | vesicle docking involved in exocytosis(GO:0006904) |
| 0.0 | 0.2 | GO:0032488 | Cdc42 protein signal transduction(GO:0032488) |
Gene overrepresentation in cellular component category:
| Log-likelihood per target | Total log-likelihood | Term | Description |
|---|---|---|---|
| 0.1 | 2.3 | GO:0043209 | myelin sheath(GO:0043209) |
| 0.1 | 0.5 | GO:0000172 | ribonuclease MRP complex(GO:0000172) |
| 0.1 | 0.5 | GO:0033165 | interphotoreceptor matrix(GO:0033165) |
| 0.0 | 0.7 | GO:0017146 | NMDA selective glutamate receptor complex(GO:0017146) |
| 0.0 | 0.4 | GO:0032593 | insulin-responsive compartment(GO:0032593) |
Gene overrepresentation in molecular function category:
| Log-likelihood per target | Total log-likelihood | Term | Description |
|---|---|---|---|
| 0.2 | 2.6 | GO:0035612 | AP-2 adaptor complex binding(GO:0035612) |
| 0.1 | 0.9 | GO:0004687 | myosin light chain kinase activity(GO:0004687) |
| 0.0 | 0.3 | GO:0005105 | type 1 fibroblast growth factor receptor binding(GO:0005105) |
| 0.0 | 0.3 | GO:0001972 | retinoic acid binding(GO:0001972) |
| 0.0 | 0.7 | GO:0004972 | NMDA glutamate receptor activity(GO:0004972) |
| 0.0 | 1.9 | GO:0017124 | SH3 domain binding(GO:0017124) |
| 0.0 | 0.6 | GO:0015248 | sterol transporter activity(GO:0015248) |
| 0.0 | 0.6 | GO:0017075 | syntaxin-1 binding(GO:0017075) |
| 0.0 | 0.5 | GO:0005540 | hyaluronic acid binding(GO:0005540) |
| 0.0 | 0.3 | GO:0008331 | high voltage-gated calcium channel activity(GO:0008331) |
Gene overrepresentation in curated gene sets: REACTOME pathways category:
| Log-likelihood per target | Total log-likelihood | Term | Description |
|---|---|---|---|
| 0.0 | 0.9 | REACTOME ION TRANSPORT BY P TYPE ATPASES | Genes involved in Ion transport by P-type ATPases |