Project
PRJEB1986: zebrafish developmental stages transcriptome
Navigation
Downloads
Results for gata1a+gata2b
Z-value: 0.16
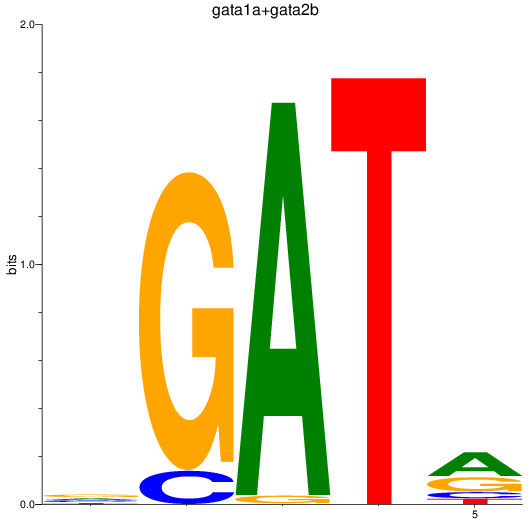
Motif logo
Transcription factors associated with gata1a+gata2b
| Gene Symbol | Gene ID | Gene Info |
|---|---|---|
|
gata2b
|
ENSDARG00000009094 | GATA binding protein 2b |
|
gata1a
|
ENSDARG00000013477 | GATA binding protein 1a |
|
gata1a
|
ENSDARG00000117116 | GATA binding protein 1a |
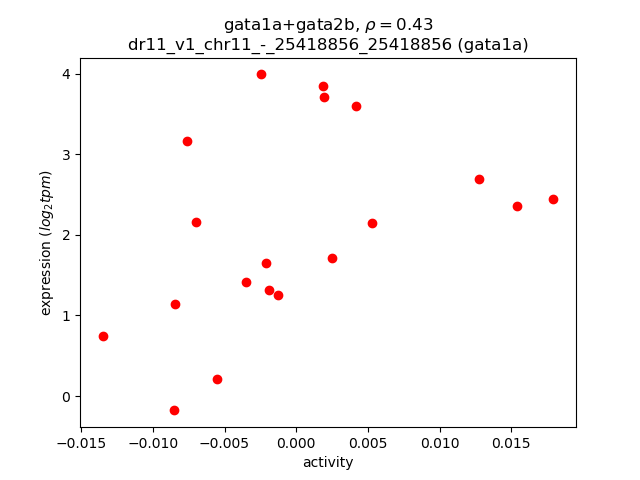
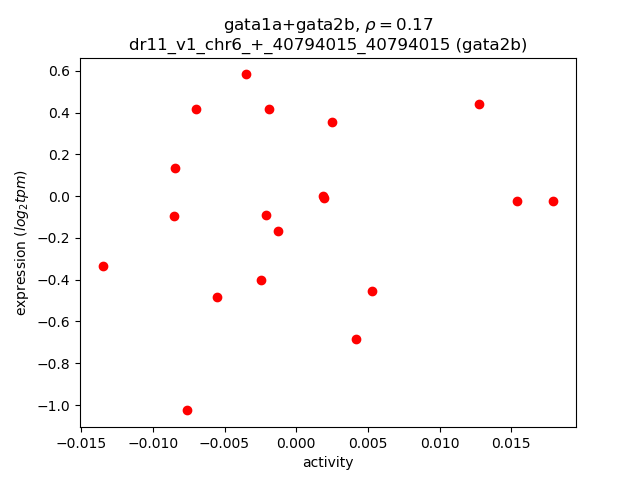
Activity-expression correlation:
| Gene | Promoter | Pearson corr. coef. | P-value | Plot |
|---|---|---|---|---|
| gata1a | dr11_v1_chr11_-_25418856_25418856 | 0.43 | 6.9e-02 | Click! |
| gata2b | dr11_v1_chr6_+_40794015_40794015 | 0.17 | 4.9e-01 | Click! |
Activity profile of gata1a+gata2b motif
Sorted Z-values of gata1a+gata2b motif
| Promoter | Log-likelihood | Transcript | Gene | Gene Info |
|---|---|---|---|---|
| chr19_+_12444943 | 0.40 |
ENSDART00000135706
|
ldlrad4a
|
low density lipoprotein receptor class A domain containing 4a |
| chr10_-_31175744 | 0.32 |
ENSDART00000191728
|
pknox2
|
pbx/knotted 1 homeobox 2 |
| chr22_+_635813 | 0.28 |
ENSDART00000179067
|
CU856139.1
|
|
| chr22_+_21398508 | 0.25 |
ENSDART00000089408
ENSDART00000186091 |
shdb
|
Src homology 2 domain containing transforming protein D, b |
| chr5_+_18047111 | 0.12 |
ENSDART00000132164
|
hira
|
histone cell cycle regulator a |
| chr10_+_42589391 | 0.09 |
ENSDART00000067689
ENSDART00000075259 |
fgfr1b
|
fibroblast growth factor receptor 1b |
| chr6_-_49159207 | 0.08 |
ENSDART00000041942
|
tspan2a
|
tetraspanin 2a |
| chr12_-_5505205 | 0.07 |
ENSDART00000092319
|
abi3b
|
ABI family, member 3b |
| chr7_+_15329819 | 0.07 |
ENSDART00000006018
|
mespaa
|
mesoderm posterior aa |
| chr22_+_15507218 | 0.07 |
ENSDART00000125450
|
gpc1a
|
glypican 1a |
| chr19_-_32710922 | 0.06 |
ENSDART00000004034
|
hpca
|
hippocalcin |
| chr18_+_3169579 | 0.05 |
ENSDART00000164724
ENSDART00000186340 ENSDART00000181247 ENSDART00000168056 |
pak1
|
p21 protein (Cdc42/Rac)-activated kinase 1 |
| chr11_-_40457325 | 0.04 |
ENSDART00000128442
|
tnfrsf1b
|
tumor necrosis factor receptor superfamily, member 1B |
| chr22_-_16270462 | 0.01 |
ENSDART00000105681
|
cdc14ab
|
cell division cycle 14Ab |
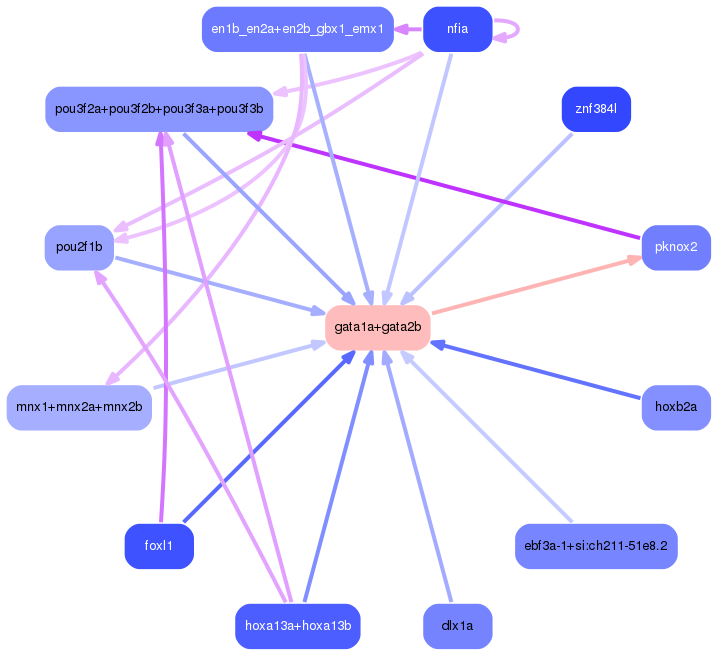
Network of associatons between targets according to the STRING database.

First level regulatory network of gata1a+gata2b
Gene Ontology Analysis
Gene overrepresentation in biological process category:
| Log-likelihood per target | Total log-likelihood | Term | Description |
|---|---|---|---|
| 0.1 | 0.4 | GO:0060394 | negative regulation of pathway-restricted SMAD protein phosphorylation(GO:0060394) |
| 0.0 | 0.1 | GO:0097101 | blood vessel endothelial cell fate specification(GO:0097101) |
| 0.0 | 0.1 | GO:0006336 | DNA replication-independent nucleosome assembly(GO:0006336) |
Gene overrepresentation in molecular function category:
| Log-likelihood per target | Total log-likelihood | Term | Description |
|---|---|---|---|
| 0.1 | 0.4 | GO:0070412 | R-SMAD binding(GO:0070412) |
| 0.0 | 0.3 | GO:0001784 | phosphotyrosine binding(GO:0001784) |