Project
PRJDB7713: Age associated transcriptome analysis in 5 tissues of zebrafish
Navigation
Downloads
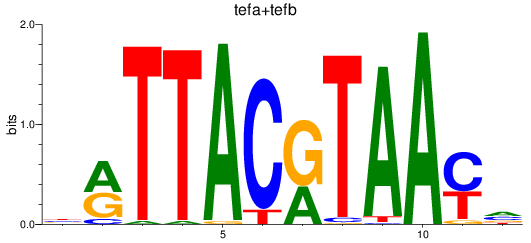
Results for tefa+tefb
Z-value: 1.25
Motif logo
Transcription factors associated with tefa+tefb
| Gene Symbol | Gene ID | Gene Info |
|---|---|---|
|
tefa
|
ENSDARG00000039117 | TEF transcription factor, PAR bZIP family member a |
|
tefb
|
ENSDARG00000098103 | TEF transcription factor, PAR bZIP family member b |
|
tefa
|
ENSDARG00000109532 | TEF transcription factor, PAR bZIP family member a |
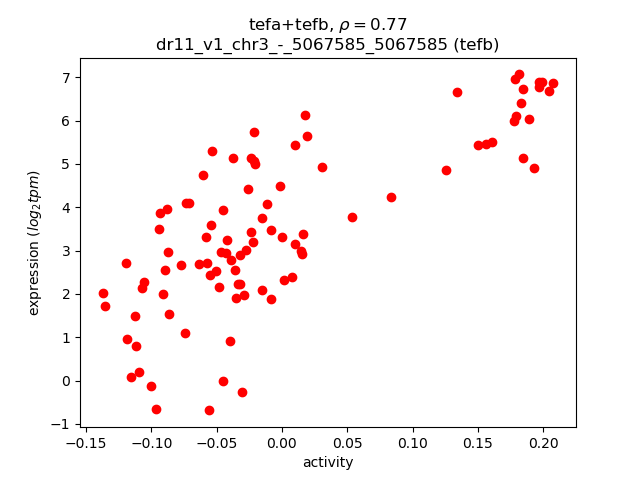
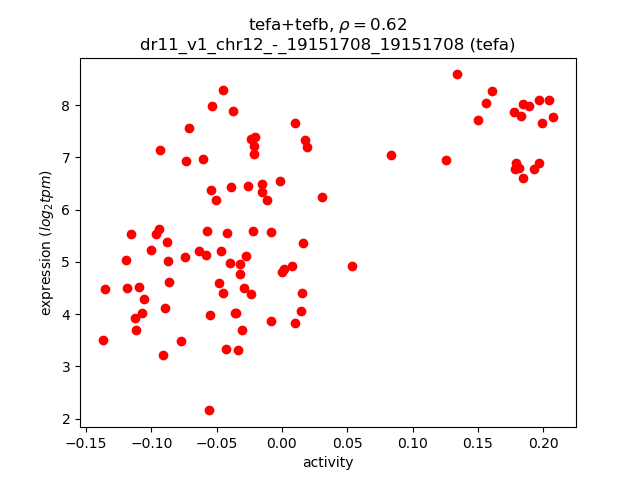
Activity-expression correlation:
| Gene | Promoter | Pearson corr. coef. | P-value | Plot |
|---|---|---|---|---|
| tefb | dr11_v1_chr3_-_5067585_5067585 | 0.77 | 1.3e-19 | Click! |
| tefa | dr11_v1_chr12_-_19151708_19151708 | 0.62 | 2.7e-11 | Click! |
Activity profile of tefa+tefb motif
Sorted Z-values of tefa+tefb motif
| Promoter | Log-likelihood | Transcript | Gene | Gene Info |
|---|---|---|---|---|
| chr1_+_31112436 | 27.86 |
ENSDART00000075340
|
eef1a1b
|
eukaryotic translation elongation factor 1 alpha 1b |
| chr16_+_34523515 | 27.15 |
ENSDART00000041007
|
stmn1b
|
stathmin 1b |
| chr17_-_43466317 | 26.37 |
ENSDART00000155313
|
hspa4l
|
heat shock protein 4 like |
| chr4_-_5302866 | 25.59 |
ENSDART00000138590
|
SNAP91 (1 of many)
|
si:ch211-214j24.9 |
| chr25_+_15354095 | 23.79 |
ENSDART00000090397
|
kiaa1549la
|
KIAA1549-like a |
| chr3_-_46818001 | 22.91 |
ENSDART00000166505
|
elavl3
|
ELAV like neuron-specific RNA binding protein 3 |
| chr16_+_46111849 | 21.81 |
ENSDART00000172232
|
sv2a
|
synaptic vesicle glycoprotein 2A |
| chr17_-_20979077 | 18.66 |
ENSDART00000006676
|
phyhipla
|
phytanoyl-CoA 2-hydroxylase interacting protein-like a |
| chr10_-_24371312 | 17.91 |
ENSDART00000149362
|
pitpnab
|
phosphatidylinositol transfer protein, alpha b |
| chr4_-_5302162 | 17.66 |
ENSDART00000177099
|
SNAP91 (1 of many)
|
si:ch211-214j24.9 |
| chr16_+_39146696 | 17.53 |
ENSDART00000121756
ENSDART00000084381 |
sybu
|
syntabulin (syntaxin-interacting) |
| chr7_+_38717624 | 16.11 |
ENSDART00000132522
|
syt13
|
synaptotagmin XIII |
| chr20_-_45661049 | 15.96 |
ENSDART00000124582
ENSDART00000131251 |
napbb
|
N-ethylmaleimide-sensitive factor attachment protein, beta b |
| chr11_-_10770053 | 15.02 |
ENSDART00000179213
|
slc4a10a
|
solute carrier family 4, sodium bicarbonate transporter, member 10a |
| chr5_-_21970881 | 14.81 |
ENSDART00000182907
|
arhgef9a
|
Cdc42 guanine nucleotide exchange factor (GEF) 9a |
| chr25_-_11088839 | 14.68 |
ENSDART00000154748
|
sv2bb
|
synaptic vesicle glycoprotein 2Bb |
| chr2_+_24177190 | 14.51 |
ENSDART00000099546
|
map4l
|
microtubule associated protein 4 like |
| chr12_-_26383242 | 14.15 |
ENSDART00000152941
|
usp54b
|
ubiquitin specific peptidase 54b |
| chr3_-_28665291 | 13.69 |
ENSDART00000151670
|
fbxl16
|
F-box and leucine-rich repeat protein 16 |
| chr21_-_42202792 | 13.68 |
ENSDART00000124708
|
gabra6b
|
gamma-aminobutyric acid (GABA) A receptor, alpha 6b |
| chr9_+_17862858 | 11.88 |
ENSDART00000166566
|
dgkh
|
diacylglycerol kinase, eta |
| chr5_-_22001003 | 11.00 |
ENSDART00000134393
ENSDART00000143878 |
arhgef9a
|
Cdc42 guanine nucleotide exchange factor (GEF) 9a |
| chr16_-_45069882 | 10.73 |
ENSDART00000058384
|
gapdhs
|
glyceraldehyde-3-phosphate dehydrogenase, spermatogenic |
| chr5_+_1278092 | 10.49 |
ENSDART00000147972
ENSDART00000159783 |
dnm1a
|
dynamin 1a |
| chr18_-_1228688 | 10.31 |
ENSDART00000064403
|
nptnb
|
neuroplastin b |
| chr22_-_18491813 | 9.94 |
ENSDART00000105419
|
si:ch211-212d10.2
|
si:ch211-212d10.2 |
| chr9_+_46644633 | 9.23 |
ENSDART00000160285
|
slc4a3
|
solute carrier family 4 (anion exchanger), member 3 |
| chr20_-_40717900 | 9.21 |
ENSDART00000181663
|
cx43
|
connexin 43 |
| chr14_+_36628131 | 8.72 |
ENSDART00000188625
ENSDART00000125345 |
TENM3
|
si:dkey-237h12.3 |
| chr20_+_1121458 | 8.36 |
ENSDART00000064472
|
pnrc1
|
proline-rich nuclear receptor coactivator 1 |
| chr19_+_7549854 | 8.34 |
ENSDART00000138866
ENSDART00000151758 |
pbxip1a
|
pre-B-cell leukemia homeobox interacting protein 1a |
| chr7_+_38278860 | 8.27 |
ENSDART00000016265
|
lrp3
|
low density lipoprotein receptor-related protein 3 |
| chr3_-_21348478 | 7.85 |
ENSDART00000114906
|
fam171a2a
|
family with sequence similarity 171, member A2a |
| chr11_+_6819050 | 7.74 |
ENSDART00000104289
|
rab3ab
|
RAB3A, member RAS oncogene family, b |
| chr7_+_17716601 | 7.37 |
ENSDART00000173792
ENSDART00000080825 |
rtn3
|
reticulon 3 |
| chr10_-_26729930 | 7.36 |
ENSDART00000145532
|
fgf13b
|
fibroblast growth factor 13b |
| chr6_-_29612269 | 7.23 |
ENSDART00000104293
|
pex5la
|
peroxisomal biogenesis factor 5-like a |
| chr23_+_19590006 | 7.19 |
ENSDART00000021231
|
slmapb
|
sarcolemma associated protein b |
| chr7_-_32833153 | 6.97 |
ENSDART00000099871
ENSDART00000099872 |
slc17a6b
|
solute carrier family 17 (vesicular glutamate transporter), member 6b |
| chr8_+_8712446 | 6.78 |
ENSDART00000158674
|
elk1
|
ELK1, member of ETS oncogene family |
| chr10_+_33895315 | 6.64 |
ENSDART00000142881
|
fryb
|
furry homolog b (Drosophila) |
| chr12_+_36416173 | 6.54 |
ENSDART00000190278
|
unk
|
unkempt family zinc finger |
| chr11_-_7078392 | 6.47 |
ENSDART00000112156
ENSDART00000188556 |
si:ch211-253b8.5
|
si:ch211-253b8.5 |
| chr15_-_16121496 | 6.42 |
ENSDART00000128624
|
sgk494a
|
uncharacterized serine/threonine-protein kinase SgK494a |
| chr7_+_4162994 | 6.25 |
ENSDART00000172800
|
si:ch211-63p21.1
|
si:ch211-63p21.1 |
| chr20_-_44576949 | 6.08 |
ENSDART00000148639
|
ubxn2a
|
UBX domain protein 2A |
| chr9_+_33788626 | 5.76 |
ENSDART00000088469
|
kdm6a
|
lysine (K)-specific demethylase 6A |
| chr5_-_21030934 | 5.74 |
ENSDART00000133461
ENSDART00000098667 |
camk2b1
|
calcium/calmodulin-dependent protein kinase (CaM kinase) II beta 1 |
| chr20_+_38201644 | 5.63 |
ENSDART00000022694
|
ehd3
|
EH-domain containing 3 |
| chr9_+_33788389 | 5.59 |
ENSDART00000144623
|
kdm6a
|
lysine (K)-specific demethylase 6A |
| chr18_-_39288894 | 5.25 |
ENSDART00000186216
|
mapk6
|
mitogen-activated protein kinase 6 |
| chr20_-_36617313 | 5.20 |
ENSDART00000172395
ENSDART00000152856 |
enah
|
enabled homolog (Drosophila) |
| chr14_+_34971554 | 5.16 |
ENSDART00000184271
|
rnf145a
|
ring finger protein 145a |
| chr7_-_6604623 | 4.91 |
ENSDART00000172874
|
kcnj10a
|
potassium inwardly-rectifying channel, subfamily J, member 10a |
| chr17_-_8268406 | 4.66 |
ENSDART00000149873
ENSDART00000064668 ENSDART00000148403 |
ahi1
|
Abelson helper integration site 1 |
| chr18_-_2549198 | 4.49 |
ENSDART00000186516
|
CABZ01070631.1
|
|
| chr1_+_54673846 | 4.44 |
ENSDART00000145018
|
gprc5bb
|
G protein-coupled receptor, class C, group 5, member Bb |
| chr21_-_32467799 | 4.38 |
ENSDART00000007675
ENSDART00000133099 |
zgc:123105
|
zgc:123105 |
| chr21_-_39566854 | 4.28 |
ENSDART00000020174
|
dynll2b
|
dynein, light chain, LC8-type 2b |
| chr24_-_39772045 | 4.04 |
ENSDART00000087441
|
GFOD1
|
si:ch211-276f18.2 |
| chr5_-_69437422 | 3.79 |
ENSDART00000073676
|
isca1
|
iron-sulfur cluster assembly 1 |
| chr12_+_15002757 | 3.76 |
ENSDART00000135036
|
mylpfb
|
myosin light chain, phosphorylatable, fast skeletal muscle b |
| chr1_+_16600690 | 3.67 |
ENSDART00000162164
|
mtus1b
|
microtubule associated tumor suppressor 1b |
| chr16_-_35427060 | 3.55 |
ENSDART00000172294
|
ctps1b
|
CTP synthase 1b |
| chr25_-_16826219 | 3.50 |
ENSDART00000191299
ENSDART00000188504 |
dyrk4
|
dual-specificity tyrosine-(Y)-phosphorylation regulated kinase 4 |
| chr21_-_32467099 | 3.45 |
ENSDART00000186354
|
zgc:123105
|
zgc:123105 |
| chr9_-_13871935 | 3.34 |
ENSDART00000146597
|
raph1a
|
Ras association (RalGDS/AF-6) and pleckstrin homology domains 1a |
| chr7_-_40959667 | 3.30 |
ENSDART00000084070
|
rbm33a
|
RNA binding motif protein 33a |
| chr25_-_13490744 | 3.29 |
ENSDART00000056721
|
ldhd
|
lactate dehydrogenase D |
| chr9_-_9225980 | 3.04 |
ENSDART00000180301
|
cbsb
|
cystathionine-beta-synthase b |
| chr15_+_24737599 | 2.94 |
ENSDART00000078024
|
crk
|
v-crk avian sarcoma virus CT10 oncogene homolog |
| chr8_-_11324143 | 2.82 |
ENSDART00000008215
|
pip5k1bb
|
phosphatidylinositol-4-phosphate 5-kinase, type I, beta b |
| chr8_+_2487883 | 2.73 |
ENSDART00000101841
|
dynll1
|
dynein, light chain, LC8-type 1 |
| chr5_-_36949476 | 2.70 |
ENSDART00000047269
|
h3f3c
|
H3 histone, family 3C |
| chr5_+_15350954 | 2.68 |
ENSDART00000140990
ENSDART00000137287 ENSDART00000061653 |
pebp1
|
phosphatidylethanolamine binding protein 1 |
| chr19_+_4990320 | 2.61 |
ENSDART00000147056
|
zgc:91968
|
zgc:91968 |
| chr20_+_23083800 | 2.53 |
ENSDART00000132093
|
usp46
|
ubiquitin specific peptidase 46 |
| chr7_+_52761841 | 2.49 |
ENSDART00000111444
|
ppip5k1a
|
diphosphoinositol pentakisphosphate kinase 1a |
| chr12_-_31484677 | 2.49 |
ENSDART00000066578
|
tectb
|
tectorin beta |
| chr4_+_21867522 | 2.47 |
ENSDART00000140400
|
acss3
|
acyl-CoA synthetase short chain family member 3 |
| chr20_-_44496245 | 2.47 |
ENSDART00000012229
|
fkbp1b
|
FK506 binding protein 1b |
| chr23_-_21763598 | 2.43 |
ENSDART00000145408
|
vps13d
|
vacuolar protein sorting 13 homolog D (S. cerevisiae) |
| chr17_+_15845765 | 2.31 |
ENSDART00000130881
ENSDART00000074936 |
gabrr2a
|
gamma-aminobutyric acid (GABA) A receptor, rho 2a |
| chr5_+_69808763 | 2.25 |
ENSDART00000143482
|
fsd1l
|
fibronectin type III and SPRY domain containing 1-like |
| chr6_-_14038804 | 2.20 |
ENSDART00000184606
ENSDART00000184609 |
etv5b
|
ets variant 5b |
| chr10_-_25591194 | 2.20 |
ENSDART00000131640
|
tiam1a
|
T cell lymphoma invasion and metastasis 1a |
| chr17_+_49281597 | 2.16 |
ENSDART00000155599
|
zgc:113176
|
zgc:113176 |
| chr14_+_23717165 | 2.14 |
ENSDART00000006373
|
ndfip1
|
Nedd4 family interacting protein 1 |
| chr6_+_16468776 | 1.82 |
ENSDART00000109151
ENSDART00000114667 |
zgc:161969
|
zgc:161969 |
| chr8_+_21225064 | 1.80 |
ENSDART00000129210
|
cry1ba
|
cryptochrome circadian clock 1ba |
| chr5_+_22974019 | 1.79 |
ENSDART00000147157
ENSDART00000020434 |
brwd3
|
bromodomain and WD repeat domain containing 3 |
| chr24_+_18948665 | 1.45 |
ENSDART00000106186
|
prex2
|
phosphatidylinositol-3,4,5-trisphosphate-dependent Rac exchange factor 2 |
| chr22_-_11438627 | 1.41 |
ENSDART00000007649
|
mid1ip1b
|
MID1 interacting protein 1b |
| chr20_-_1151265 | 1.27 |
ENSDART00000012376
|
gabrr1
|
gamma-aminobutyric acid (GABA) A receptor, rho 1 |
| chr8_-_37249813 | 1.26 |
ENSDART00000098634
ENSDART00000140233 ENSDART00000061328 |
rbm39b
|
RNA binding motif protein 39b |
| chr23_+_9522781 | 1.17 |
ENSDART00000136486
|
osbpl2b
|
oxysterol binding protein-like 2b |
| chr22_-_10605045 | 1.17 |
ENSDART00000184812
|
bap1
|
BRCA1 associated protein-1 (ubiquitin carboxy-terminal hydrolase) |
| chr5_-_65153731 | 1.12 |
ENSDART00000171024
|
sh2d3cb
|
SH2 domain containing 3Cb |
| chr15_+_21882419 | 1.06 |
ENSDART00000157216
|
si:dkey-103g5.4
|
si:dkey-103g5.4 |
| chr8_-_29851706 | 0.97 |
ENSDART00000149297
|
slc20a2
|
solute carrier family 20 (phosphate transporter), member 2 |
| chr23_+_33963619 | 0.95 |
ENSDART00000140666
ENSDART00000084792 |
plpbp
|
pyridoxal phosphate binding protein |
| chr21_-_32781612 | 0.83 |
ENSDART00000031028
|
cnot6a
|
CCR4-NOT transcription complex, subunit 6a |
| chr23_-_18981595 | 0.77 |
ENSDART00000147617
|
bcl2l1
|
bcl2-like 1 |
| chr1_+_19764995 | 0.76 |
ENSDART00000138276
|
si:ch211-42i9.8
|
si:ch211-42i9.8 |
| chr24_-_23784701 | 0.75 |
ENSDART00000090368
|
sgk3
|
serum/glucocorticoid regulated kinase family, member 3 |
| chr19_-_45650994 | 0.60 |
ENSDART00000163504
|
trps1
|
trichorhinophalangeal syndrome I |
| chr19_-_30811161 | 0.56 |
ENSDART00000103524
|
myclb
|
MYCL proto-oncogene, bHLH transcription factor b |
| chr20_-_20270191 | 0.31 |
ENSDART00000009356
|
ppp2r5ea
|
protein phosphatase 2, regulatory subunit B', epsilon isoform a |
| chr13_+_30035253 | 0.15 |
ENSDART00000181303
ENSDART00000057525 ENSDART00000136622 |
dnajb12a
|
DnaJ (Hsp40) homolog, subfamily B, member 12a |
| chr17_-_31308658 | 0.14 |
ENSDART00000124505
|
bahd1
|
bromo adjacent homology domain containing 1 |
| chr5_-_54395488 | 0.10 |
ENSDART00000160781
|
zmynd19
|
zinc finger, MYND-type containing 19 |
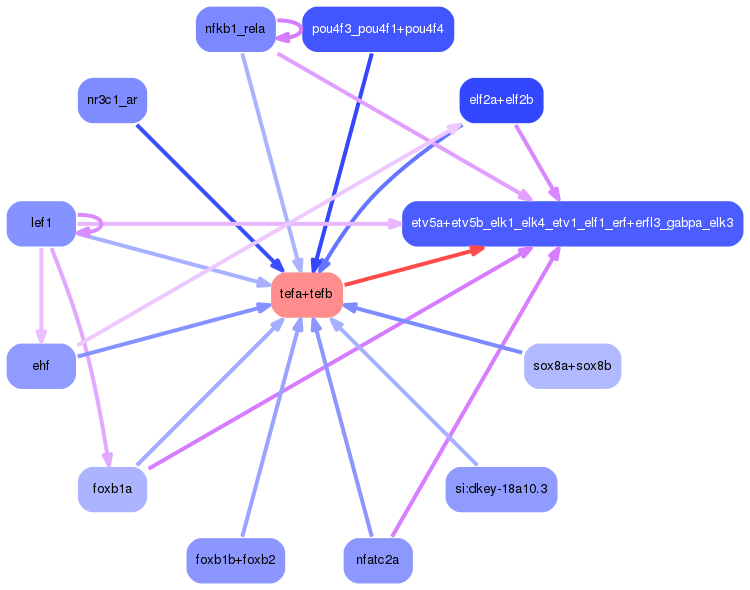
Network of associatons between targets according to the STRING database.

First level regulatory network of tefa+tefb
Gene Ontology Analysis
Gene overrepresentation in biological process category:
| Log-likelihood per target | Total log-likelihood | Term | Description |
|---|---|---|---|
| 4.4 | 17.5 | GO:0060074 | synapse maturation(GO:0060074) |
| 4.0 | 16.0 | GO:0010807 | regulation of synaptic vesicle priming(GO:0010807) |
| 2.6 | 7.7 | GO:0031630 | regulation of synaptic vesicle fusion to presynaptic membrane(GO:0031630) |
| 1.7 | 5.2 | GO:0070358 | actin polymerization-dependent cell motility(GO:0070358) |
| 1.2 | 8.3 | GO:2001106 | regulation of guanyl-nucleotide exchange factor activity(GO:1905097) regulation of Rho guanyl-nucleotide exchange factor activity(GO:2001106) |
| 1.2 | 7.0 | GO:2000580 | positive regulation of microtubule motor activity(GO:2000576) regulation of ATP-dependent microtubule motor activity, plus-end-directed(GO:2000580) positive regulation of ATP-dependent microtubule motor activity, plus-end-directed(GO:2000582) |
| 1.1 | 11.4 | GO:0071557 | histone H3-K27 demethylation(GO:0071557) |
| 1.1 | 3.3 | GO:0006089 | lactate metabolic process(GO:0006089) |
| 1.1 | 24.3 | GO:0015701 | bicarbonate transport(GO:0015701) |
| 1.0 | 3.0 | GO:0050666 | regulation of sulfur amino acid metabolic process(GO:0031335) regulation of homocysteine metabolic process(GO:0050666) |
| 1.0 | 9.9 | GO:0071941 | nitrogen cycle metabolic process(GO:0071941) |
| 0.9 | 3.6 | GO:0044210 | 'de novo' CTP biosynthetic process(GO:0044210) |
| 0.9 | 7.0 | GO:0098700 | neurotransmitter loading into synaptic vesicle(GO:0098700) |
| 0.7 | 7.2 | GO:0016560 | protein import into peroxisome matrix, docking(GO:0016560) protein to membrane docking(GO:0022615) |
| 0.7 | 16.2 | GO:0051932 | synaptic transmission, GABAergic(GO:0051932) |
| 0.7 | 4.9 | GO:0036268 | swimming(GO:0036268) |
| 0.6 | 27.2 | GO:0007019 | microtubule depolymerization(GO:0007019) |
| 0.6 | 10.5 | GO:0098884 | postsynaptic neurotransmitter receptor internalization(GO:0098884) |
| 0.5 | 3.8 | GO:0097428 | protein maturation by iron-sulfur cluster transfer(GO:0097428) |
| 0.5 | 7.4 | GO:1905150 | regulation of voltage-gated sodium channel activity(GO:1905150) |
| 0.5 | 11.9 | GO:0007205 | protein kinase C-activating G-protein coupled receptor signaling pathway(GO:0007205) |
| 0.4 | 27.9 | GO:0006414 | translational elongation(GO:0006414) |
| 0.4 | 4.7 | GO:0044458 | motile cilium assembly(GO:0044458) |
| 0.4 | 6.1 | GO:0031468 | nuclear envelope reassembly(GO:0031468) |
| 0.4 | 10.3 | GO:0070593 | dendrite self-avoidance(GO:0070593) |
| 0.4 | 16.1 | GO:0014046 | dopamine secretion(GO:0014046) regulation of dopamine secretion(GO:0014059) |
| 0.3 | 2.4 | GO:0045053 | protein retention in Golgi apparatus(GO:0045053) |
| 0.3 | 1.3 | GO:0070316 | G0 to G1 transition(GO:0045023) regulation of G0 to G1 transition(GO:0070316) negative regulation of G0 to G1 transition(GO:0070317) |
| 0.3 | 1.2 | GO:0035521 | monoubiquitinated protein deubiquitination(GO:0035520) monoubiquitinated histone deubiquitination(GO:0035521) monoubiquitinated histone H2A deubiquitination(GO:0035522) |
| 0.3 | 17.9 | GO:0015914 | phospholipid transport(GO:0015914) |
| 0.3 | 6.5 | GO:0048667 | cell morphogenesis involved in neuron differentiation(GO:0048667) |
| 0.2 | 30.5 | GO:0006836 | neurotransmitter transport(GO:0006836) |
| 0.2 | 2.5 | GO:0006020 | inositol metabolic process(GO:0006020) |
| 0.2 | 13.7 | GO:0031146 | SCF-dependent proteasomal ubiquitin-dependent protein catabolic process(GO:0031146) |
| 0.2 | 10.7 | GO:0006096 | glycolytic process(GO:0006096) |
| 0.1 | 2.2 | GO:0021979 | hypothalamus cell differentiation(GO:0021979) limb morphogenesis(GO:0035108) |
| 0.1 | 2.9 | GO:0007520 | myoblast fusion(GO:0007520) |
| 0.1 | 5.6 | GO:0032456 | endocytic recycling(GO:0032456) |
| 0.1 | 1.1 | GO:0033135 | regulation of peptidyl-serine phosphorylation(GO:0033135) positive regulation of peptidyl-serine phosphorylation(GO:0033138) |
| 0.1 | 1.6 | GO:0090382 | phagosome maturation(GO:0090382) |
| 0.1 | 2.5 | GO:0000413 | protein peptidyl-prolyl isomerization(GO:0000413) |
| 0.1 | 8.5 | GO:0001933 | negative regulation of protein phosphorylation(GO:0001933) |
| 0.1 | 9.6 | GO:0016579 | protein deubiquitination(GO:0016579) |
| 0.1 | 3.5 | GO:0018107 | peptidyl-threonine phosphorylation(GO:0018107) |
| 0.1 | 2.1 | GO:0031398 | positive regulation of protein ubiquitination(GO:0031398) positive regulation of protein modification by small protein conjugation or removal(GO:1903322) |
| 0.1 | 25.1 | GO:0050767 | regulation of neurogenesis(GO:0050767) |
| 0.1 | 0.8 | GO:0043154 | negative regulation of cysteine-type endopeptidase activity involved in apoptotic process(GO:0043154) |
| 0.0 | 1.0 | GO:0035435 | phosphate ion transmembrane transport(GO:0035435) |
| 0.0 | 21.2 | GO:0031175 | neuron projection development(GO:0031175) |
| 0.0 | 2.3 | GO:1902476 | chloride transmembrane transport(GO:1902476) |
| 0.0 | 1.4 | GO:0072175 | epithelial tube formation(GO:0072175) |
| 0.0 | 0.8 | GO:0000289 | nuclear-transcribed mRNA poly(A) tail shortening(GO:0000289) |
| 0.0 | 1.8 | GO:0008360 | regulation of cell shape(GO:0008360) |
| 0.0 | 0.3 | GO:0031952 | regulation of protein autophosphorylation(GO:0031952) |
| 0.0 | 2.8 | GO:0046488 | phosphatidylinositol metabolic process(GO:0046488) |
Gene overrepresentation in cellular component category:
| Log-likelihood per target | Total log-likelihood | Term | Description |
|---|---|---|---|
| 4.0 | 16.0 | GO:0070044 | synaptobrevin 2-SNAP-25-syntaxin-1a complex(GO:0070044) |
| 0.9 | 3.6 | GO:0097268 | cytoophidium(GO:0097268) |
| 0.7 | 4.4 | GO:0070062 | extracellular exosome(GO:0070062) |
| 0.6 | 11.4 | GO:0044666 | MLL3/4 complex(GO:0044666) |
| 0.6 | 10.5 | GO:0098844 | postsynaptic endocytic zone membrane(GO:0098844) |
| 0.5 | 43.5 | GO:0030672 | synaptic vesicle membrane(GO:0030672) exocytic vesicle membrane(GO:0099501) |
| 0.5 | 17.3 | GO:1902711 | GABA receptor complex(GO:1902710) GABA-A receptor complex(GO:1902711) |
| 0.5 | 7.0 | GO:0005868 | cytoplasmic dynein complex(GO:0005868) |
| 0.4 | 17.5 | GO:0005881 | cytoplasmic microtubule(GO:0005881) |
| 0.2 | 5.6 | GO:0060170 | ciliary membrane(GO:0060170) |
| 0.2 | 14.0 | GO:0030427 | site of polarized growth(GO:0030427) |
| 0.2 | 25.8 | GO:0014069 | postsynaptic density(GO:0014069) |
| 0.2 | 1.6 | GO:0045009 | melanosome membrane(GO:0033162) chitosome(GO:0045009) |
| 0.2 | 1.2 | GO:0035517 | PR-DUB complex(GO:0035517) |
| 0.1 | 15.0 | GO:0016323 | basolateral plasma membrane(GO:0016323) |
| 0.1 | 34.2 | GO:0030424 | axon(GO:0030424) |
| 0.1 | 4.6 | GO:0031903 | peroxisomal membrane(GO:0005778) microbody membrane(GO:0031903) |
| 0.1 | 39.3 | GO:0043005 | neuron projection(GO:0043005) |
| 0.1 | 7.1 | GO:0019005 | SCF ubiquitin ligase complex(GO:0019005) |
| 0.0 | 0.8 | GO:0030014 | CCR4-NOT complex(GO:0030014) |
| 0.0 | 16.8 | GO:1990904 | ribonucleoprotein complex(GO:1990904) |
| 0.0 | 24.8 | GO:0005829 | cytosol(GO:0005829) |
| 0.0 | 2.1 | GO:0048471 | perinuclear region of cytoplasm(GO:0048471) |
Gene overrepresentation in molecular function category:
| Log-likelihood per target | Total log-likelihood | Term | Description |
|---|---|---|---|
| 2.7 | 10.7 | GO:0043891 | glyceraldehyde-3-phosphate dehydrogenase (NAD+) (phosphorylating) activity(GO:0004365) glyceraldehyde-3-phosphate dehydrogenase (NAD(P)+) (phosphorylating) activity(GO:0043891) |
| 2.7 | 16.0 | GO:0005483 | soluble NSF attachment protein activity(GO:0005483) |
| 2.6 | 17.9 | GO:0008526 | phosphatidylinositol transporter activity(GO:0008526) |
| 2.2 | 6.5 | GO:1990715 | mRNA CDS binding(GO:1990715) |
| 1.4 | 9.9 | GO:0098809 | nitrite reductase activity(GO:0098809) |
| 1.1 | 11.4 | GO:0071558 | histone demethylase activity (H3-K27 specific)(GO:0071558) |
| 1.1 | 24.3 | GO:0005452 | inorganic anion exchanger activity(GO:0005452) |
| 1.0 | 13.7 | GO:0022851 | benzodiazepine receptor activity(GO:0008503) GABA-gated chloride ion channel activity(GO:0022851) |
| 0.9 | 7.2 | GO:0005052 | peroxisome matrix targeting signal-1 binding(GO:0005052) |
| 0.9 | 3.6 | GO:0003883 | CTP synthase activity(GO:0003883) |
| 0.8 | 17.5 | GO:0019894 | kinesin binding(GO:0019894) |
| 0.6 | 2.5 | GO:0000829 | inositol heptakisphosphate kinase activity(GO:0000829) diphosphoinositol-pentakisphosphate kinase activity(GO:0033857) |
| 0.6 | 27.9 | GO:0003746 | translation elongation factor activity(GO:0003746) |
| 0.6 | 3.0 | GO:0004122 | cystathionine beta-synthase activity(GO:0004122) |
| 0.5 | 7.0 | GO:0005326 | neurotransmitter transporter activity(GO:0005326) |
| 0.5 | 5.2 | GO:0005522 | profilin binding(GO:0005522) |
| 0.5 | 11.9 | GO:0004143 | diacylglycerol kinase activity(GO:0004143) |
| 0.4 | 2.1 | GO:0050699 | WW domain binding(GO:0050699) |
| 0.4 | 3.3 | GO:0004457 | lactate dehydrogenase activity(GO:0004457) |
| 0.3 | 16.1 | GO:0001786 | phosphatidylserine binding(GO:0001786) |
| 0.3 | 10.3 | GO:0098632 | protein binding involved in cell-cell adhesion(GO:0098632) |
| 0.3 | 7.4 | GO:0017080 | sodium channel regulator activity(GO:0017080) |
| 0.2 | 7.0 | GO:0045505 | dynein intermediate chain binding(GO:0045505) |
| 0.2 | 3.6 | GO:0004890 | GABA-A receptor activity(GO:0004890) |
| 0.1 | 5.2 | GO:0004707 | MAP kinase activity(GO:0004707) |
| 0.1 | 4.9 | GO:0005242 | inward rectifier potassium channel activity(GO:0005242) |
| 0.1 | 3.8 | GO:0051537 | 2 iron, 2 sulfur cluster binding(GO:0051537) |
| 0.1 | 5.7 | GO:0004683 | calmodulin-dependent protein kinase activity(GO:0004683) |
| 0.1 | 50.3 | GO:0015631 | tubulin binding(GO:0015631) |
| 0.1 | 13.3 | GO:0004843 | thiol-dependent ubiquitin-specific protease activity(GO:0004843) thiol-dependent ubiquitinyl hydrolase activity(GO:0036459) ubiquitinyl hydrolase activity(GO:0101005) |
| 0.1 | 30.6 | GO:0005085 | guanyl-nucleotide exchange factor activity(GO:0005085) |
| 0.1 | 4.4 | GO:0030295 | kinase activator activity(GO:0019209) protein kinase activator activity(GO:0030295) |
| 0.1 | 3.5 | GO:0004712 | protein serine/threonine/tyrosine kinase activity(GO:0004712) |
| 0.1 | 6.1 | GO:0043130 | ubiquitin binding(GO:0043130) |
| 0.1 | 2.8 | GO:0016307 | phosphatidylinositol phosphate kinase activity(GO:0016307) |
| 0.1 | 1.0 | GO:0005315 | inorganic phosphate transmembrane transporter activity(GO:0005315) |
| 0.1 | 0.8 | GO:0043027 | cysteine-type endopeptidase inhibitor activity involved in apoptotic process(GO:0043027) cysteine-type endopeptidase regulator activity involved in apoptotic process(GO:0043028) |
| 0.1 | 0.8 | GO:0004535 | poly(A)-specific ribonuclease activity(GO:0004535) |
| 0.0 | 2.5 | GO:0003755 | peptidyl-prolyl cis-trans isomerase activity(GO:0003755) |
| 0.0 | 1.2 | GO:0015248 | sterol transporter activity(GO:0015248) |
| 0.0 | 7.7 | GO:0003924 | GTPase activity(GO:0003924) |
| 0.0 | 0.8 | GO:0015459 | potassium channel regulator activity(GO:0015459) |
| 0.0 | 0.3 | GO:0019211 | phosphatase activator activity(GO:0019211) protein phosphatase activator activity(GO:0072542) |
| 0.0 | 24.8 | GO:0022857 | transmembrane transporter activity(GO:0022857) |
| 0.0 | 0.9 | GO:0030170 | pyridoxal phosphate binding(GO:0030170) |
| 0.0 | 5.2 | GO:0061630 | ubiquitin protein ligase activity(GO:0061630) |
| 0.0 | 0.1 | GO:0030544 | Hsp70 protein binding(GO:0030544) |
| 0.0 | 13.5 | GO:0003723 | RNA binding(GO:0003723) |
| 0.0 | 2.1 | GO:0005525 | GTP binding(GO:0005525) |
Gene overrepresentation in curated gene sets: canonical pathways category:
| Log-likelihood per target | Total log-likelihood | Term | Description |
|---|---|---|---|
| 0.5 | 6.8 | PID TCR RAS PATHWAY | Ras signaling in the CD4+ TCR pathway |
| 0.4 | 2.9 | PID TCR JNK PATHWAY | JNK signaling in the CD4+ TCR pathway |
| 0.1 | 5.2 | PID ECADHERIN STABILIZATION PATHWAY | Stabilization and expansion of the E-cadherin adherens junction |
| 0.1 | 0.8 | SA PROGRAMMED CELL DEATH | Programmed cell death, or apoptosis, eliminates damaged or unneeded cells. |
| 0.1 | 2.7 | PID AURORA B PATHWAY | Aurora B signaling |
| 0.0 | 1.5 | PID RAC1 REG PATHWAY | Regulation of RAC1 activity |
Gene overrepresentation in curated gene sets: REACTOME pathways category:
| Log-likelihood per target | Total log-likelihood | Term | Description |
|---|---|---|---|
| 0.5 | 10.7 | REACTOME GLYCOLYSIS | Genes involved in Glycolysis |
| 0.4 | 11.9 | REACTOME EFFECTS OF PIP2 HYDROLYSIS | Genes involved in Effects of PIP2 hydrolysis |
| 0.4 | 5.2 | REACTOME GENERATION OF SECOND MESSENGER MOLECULES | Genes involved in Generation of second messenger molecules |
| 0.3 | 6.1 | REACTOME ERK MAPK TARGETS | Genes involved in ERK/MAPK targets |
| 0.3 | 2.9 | REACTOME PROLONGED ERK ACTIVATION EVENTS | Genes involved in Prolonged ERK activation events |
| 0.3 | 2.7 | REACTOME ACTIVATION OF BH3 ONLY PROTEINS | Genes involved in Activation of BH3-only proteins |
| 0.1 | 10.2 | REACTOME TRANSPORT OF INORGANIC CATIONS ANIONS AND AMINO ACIDS OLIGOPEPTIDES | Genes involved in Transport of inorganic cations/anions and amino acids/oligopeptides |
| 0.1 | 0.8 | REACTOME INFLAMMASOMES | Genes involved in Inflammasomes |
| 0.1 | 3.3 | REACTOME MITOCHONDRIAL PROTEIN IMPORT | Genes involved in Mitochondrial Protein Import |
| 0.1 | 1.3 | REACTOME LIGAND GATED ION CHANNEL TRANSPORT | Genes involved in Ligand-gated ion channel transport |