Project
avrg: NHBE cells infected with SARS-CoV-2 Analysis Results (GEO series: GSE147507)
Navigation
Downloads
Results for PITX3
Z-value: 1.35
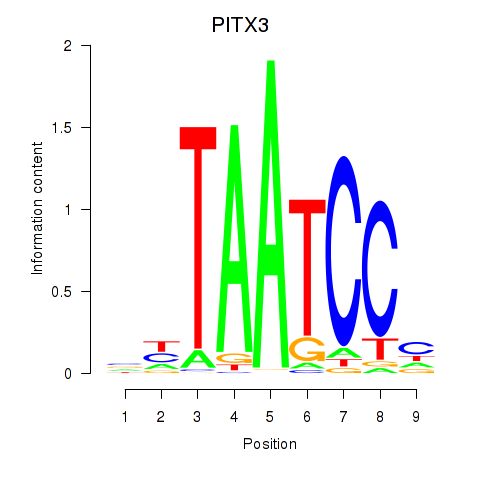
Motif logo
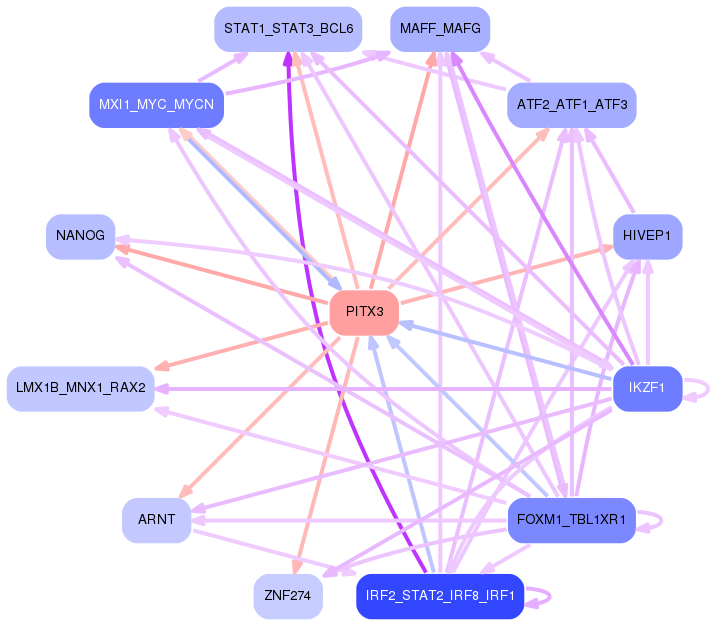
Transcription factors associated with PITX3
| Gene Symbol | Gene ID | Gene Info |
|---|---|---|
|
PITX3
|
ENSG00000107859.5 | paired like homeodomain 3 |
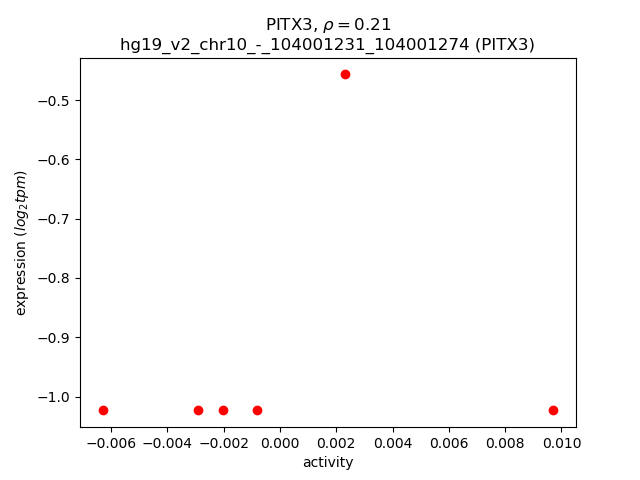
Activity-expression correlation:
| Gene | Promoter | Pearson corr. coef. | P-value | Plot |
|---|---|---|---|---|
| PITX3 | hg19_v2_chr10_-_104001231_104001274 | 0.21 | 7.0e-01 | Click! |