Project
NHBE cells infected with SARS-CoV-2 Analysis Results (GEO series: GSE147507)
Navigation
Downloads
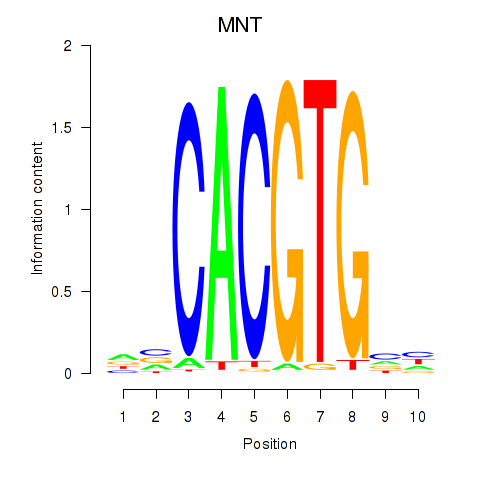
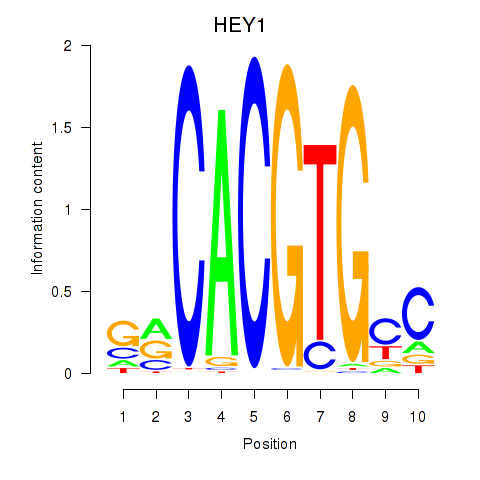
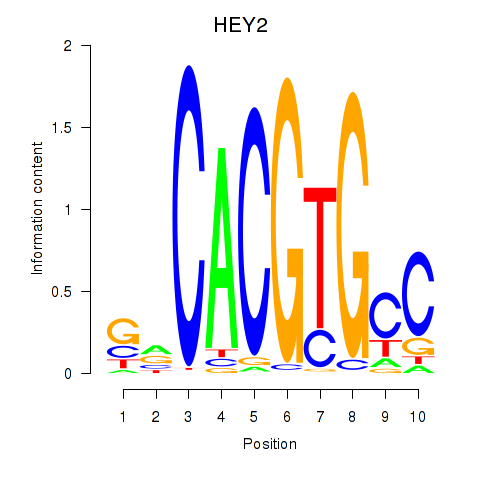
Results for MNT_HEY1_HEY2
Z-value: 0.77
Motif logo
Transcription factors associated with MNT_HEY1_HEY2
| Gene Symbol | Gene ID | Gene Info |
|---|---|---|
|
MNT
|
ENSG00000070444.10 | MAX network transcriptional repressor |
|
HEY1
|
ENSG00000164683.12 | hes related family bHLH transcription factor with YRPW motif 1 |
|
HEY2
|
ENSG00000135547.4 | hes related family bHLH transcription factor with YRPW motif 2 |
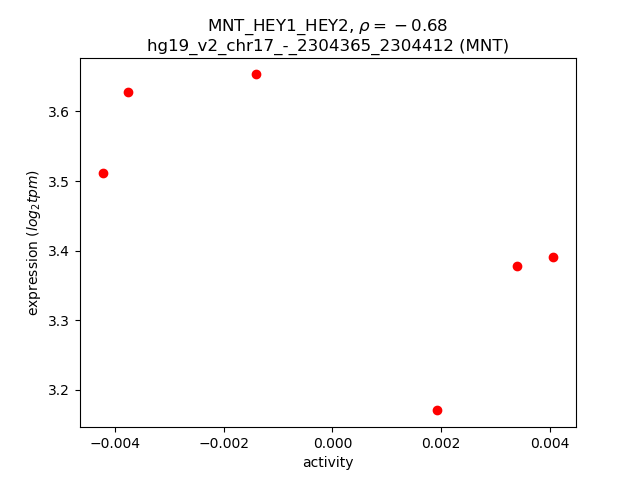
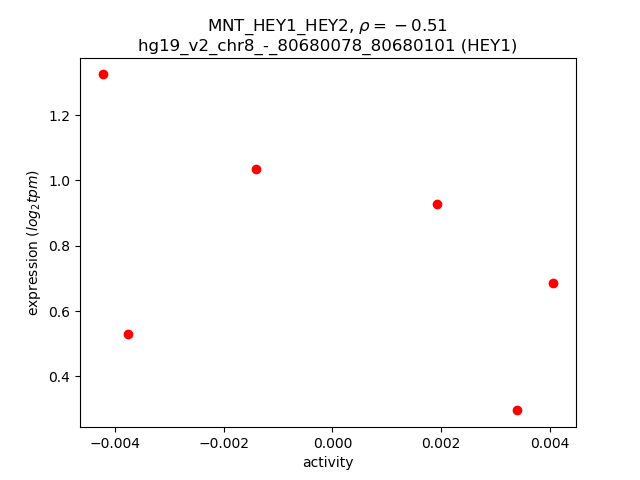
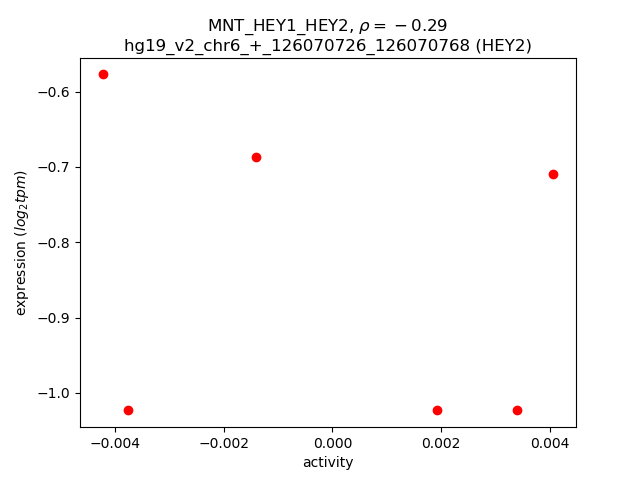
Activity-expression correlation:
| Gene | Promoter | Pearson corr. coef. | P-value | Plot |
|---|---|---|---|---|
| MNT | hg19_v2_chr17_-_2304365_2304412 | -0.68 | 1.4e-01 | Click! |
| HEY1 | hg19_v2_chr8_-_80680078_80680101 | -0.51 | 3.0e-01 | Click! |
| HEY2 | hg19_v2_chr6_+_126070726_126070768 | -0.29 | 5.8e-01 | Click! |
Activity profile of MNT_HEY1_HEY2 motif
Sorted Z-values of MNT_HEY1_HEY2 motif
| Promoter | Log-likelihood | Transcript | Gene | Gene Info |
|---|---|---|---|---|
| chr12_-_58145889 | 2.50 |
ENST00000547853.1
|
CDK4
|
cyclin-dependent kinase 4 |
| chr12_+_112451222 | 0.84 |
ENST00000552052.1
|
ERP29
|
endoplasmic reticulum protein 29 |
| chr8_+_104383759 | 0.61 |
ENST00000415886.2
|
CTHRC1
|
collagen triple helix repeat containing 1 |
| chr6_+_138188351 | 0.57 |
ENST00000421450.1
|
TNFAIP3
|
tumor necrosis factor, alpha-induced protein 3 |
| chr3_-_53080644 | 0.57 |
ENST00000497586.1
|
SFMBT1
|
Scm-like with four mbt domains 1 |
| chr9_+_96928516 | 0.57 |
ENST00000602703.1
|
RP11-2B6.3
|
RP11-2B6.3 |
| chr1_-_26232951 | 0.51 |
ENST00000426559.2
ENST00000455785.2 |
STMN1
|
stathmin 1 |
| chr17_-_6915616 | 0.50 |
ENST00000575889.1
|
AC027763.2
|
Uncharacterized protein |
| chr1_+_154193325 | 0.49 |
ENST00000428931.1
ENST00000441890.1 ENST00000271877.7 ENST00000412596.1 ENST00000368504.1 ENST00000437652.1 |
UBAP2L
|
ubiquitin associated protein 2-like |
| chr13_+_27998681 | 0.48 |
ENST00000381140.4
|
GTF3A
|
general transcription factor IIIA |
| chr2_-_232328867 | 0.44 |
ENST00000453992.1
ENST00000417652.1 ENST00000454824.1 |
NCL
|
nucleolin |
| chr20_+_2633269 | 0.43 |
ENST00000445139.1
|
NOP56
|
NOP56 ribonucleoprotein |
| chr1_-_26233423 | 0.40 |
ENST00000357865.2
|
STMN1
|
stathmin 1 |
| chr11_-_61560053 | 0.38 |
ENST00000537328.1
|
TMEM258
|
transmembrane protein 258 |
| chr1_-_26232522 | 0.38 |
ENST00000399728.1
|
STMN1
|
stathmin 1 |
| chr4_+_76439649 | 0.37 |
ENST00000507557.1
|
THAP6
|
THAP domain containing 6 |
| chr12_-_58146048 | 0.37 |
ENST00000547281.1
ENST00000546489.1 ENST00000552388.1 ENST00000540325.1 ENST00000312990.6 |
CDK4
|
cyclin-dependent kinase 4 |
| chr9_-_135545380 | 0.36 |
ENST00000544003.1
|
DDX31
|
DEAD (Asp-Glu-Ala-Asp) box polypeptide 31 |
| chr12_-_49318715 | 0.36 |
ENST00000444214.2
|
FKBP11
|
FK506 binding protein 11, 19 kDa |
| chr10_+_104474353 | 0.35 |
ENST00000602647.1
ENST00000602439.1 ENST00000602764.1 |
SFXN2
|
sideroflexin 2 |
| chr1_-_11865982 | 0.34 |
ENST00000418034.1
|
MTHFR
|
methylenetetrahydrofolate reductase (NAD(P)H) |
| chr3_+_52719936 | 0.34 |
ENST00000418458.1
ENST00000394799.2 |
GNL3
|
guanine nucleotide binding protein-like 3 (nucleolar) |
| chr1_+_150254936 | 0.34 |
ENST00000447007.1
ENST00000369095.1 ENST00000369094.1 |
C1orf51
|
chromosome 1 open reading frame 51 |
| chr2_+_198365095 | 0.33 |
ENST00000409468.1
|
HSPE1
|
heat shock 10kDa protein 1 |
| chr5_-_110074603 | 0.33 |
ENST00000515278.2
|
TMEM232
|
transmembrane protein 232 |
| chr1_+_154193643 | 0.33 |
ENST00000456325.1
|
UBAP2L
|
ubiquitin associated protein 2-like |
| chr8_+_104383728 | 0.32 |
ENST00000330295.5
|
CTHRC1
|
collagen triple helix repeat containing 1 |
| chr9_+_129987488 | 0.32 |
ENST00000446764.1
|
GARNL3
|
GTPase activating Rap/RanGAP domain-like 3 |
| chr3_-_52719546 | 0.32 |
ENST00000439181.1
ENST00000449505.1 |
PBRM1
|
polybromo 1 |
| chr12_-_58146128 | 0.30 |
ENST00000551800.1
ENST00000549606.1 ENST00000257904.6 |
CDK4
|
cyclin-dependent kinase 4 |
| chr6_-_39197226 | 0.30 |
ENST00000359534.3
|
KCNK5
|
potassium channel, subfamily K, member 5 |
| chr7_-_150020216 | 0.30 |
ENST00000477367.1
|
ACTR3C
|
ARP3 actin-related protein 3 homolog C (yeast) |
| chr11_-_2292182 | 0.30 |
ENST00000331289.4
|
ASCL2
|
achaete-scute family bHLH transcription factor 2 |
| chr5_-_133706695 | 0.29 |
ENST00000521755.1
ENST00000523054.1 ENST00000435240.2 ENST00000609654.1 ENST00000536186.1 ENST00000609383.1 |
CDKL3
|
cyclin-dependent kinase-like 3 |
| chr15_-_83316254 | 0.29 |
ENST00000567678.1
ENST00000450751.2 |
CPEB1
|
cytoplasmic polyadenylation element binding protein 1 |
| chr15_+_44084503 | 0.29 |
ENST00000409960.2
ENST00000409646.1 ENST00000594896.1 ENST00000339624.5 ENST00000409291.1 ENST00000402131.1 ENST00000403425.1 ENST00000430901.1 |
SERF2
|
small EDRK-rich factor 2 |
| chr2_+_192543153 | 0.29 |
ENST00000425611.2
|
NABP1
|
nucleic acid binding protein 1 |
| chr11_+_777562 | 0.28 |
ENST00000530083.1
|
AP006621.5
|
Protein LOC100506518 |
| chr2_+_88991162 | 0.27 |
ENST00000283646.4
|
RPIA
|
ribose 5-phosphate isomerase A |
| chr6_+_73331918 | 0.27 |
ENST00000402622.2
ENST00000355635.3 ENST00000403813.2 ENST00000414165.2 |
KCNQ5
|
potassium voltage-gated channel, KQT-like subfamily, member 5 |
| chr1_-_94344686 | 0.27 |
ENST00000528680.1
|
DNTTIP2
|
deoxynucleotidyltransferase, terminal, interacting protein 2 |
| chr3_+_133292851 | 0.27 |
ENST00000503932.1
|
CDV3
|
CDV3 homolog (mouse) |
| chr3_+_119187785 | 0.27 |
ENST00000295588.4
ENST00000476573.1 |
POGLUT1
|
protein O-glucosyltransferase 1 |
| chr16_-_18937072 | 0.27 |
ENST00000569122.1
|
SMG1
|
SMG1 phosphatidylinositol 3-kinase-related kinase |
| chr3_+_32148106 | 0.26 |
ENST00000425459.1
ENST00000431009.1 |
GPD1L
|
glycerol-3-phosphate dehydrogenase 1-like |
| chr3_-_52719888 | 0.26 |
ENST00000458294.1
|
PBRM1
|
polybromo 1 |
| chr6_-_10694766 | 0.26 |
ENST00000460742.2
ENST00000259983.3 ENST00000379586.1 |
C6orf52
|
chromosome 6 open reading frame 52 |
| chr2_-_10588630 | 0.26 |
ENST00000234111.4
|
ODC1
|
ornithine decarboxylase 1 |
| chr17_-_17109579 | 0.26 |
ENST00000321560.3
|
PLD6
|
phospholipase D family, member 6 |
| chr5_-_1799965 | 0.26 |
ENST00000508987.1
|
MRPL36
|
mitochondrial ribosomal protein L36 |
| chrX_+_55744228 | 0.26 |
ENST00000262850.7
|
RRAGB
|
Ras-related GTP binding B |
| chr5_-_1799932 | 0.26 |
ENST00000382647.7
ENST00000505059.2 |
MRPL36
|
mitochondrial ribosomal protein L36 |
| chr17_-_48450534 | 0.25 |
ENST00000503633.1
ENST00000442592.3 ENST00000225969.4 |
MRPL27
|
mitochondrial ribosomal protein L27 |
| chr3_-_52719810 | 0.25 |
ENST00000424867.1
ENST00000394830.3 ENST00000431678.1 ENST00000450271.1 |
PBRM1
|
polybromo 1 |
| chr13_-_103451307 | 0.25 |
ENST00000376004.4
|
KDELC1
|
KDEL (Lys-Asp-Glu-Leu) containing 1 |
| chr17_+_46970127 | 0.23 |
ENST00000355938.5
|
ATP5G1
|
ATP synthase, H+ transporting, mitochondrial Fo complex, subunit C1 (subunit 9) |
| chr15_-_72668185 | 0.23 |
ENST00000457859.2
ENST00000566304.1 ENST00000567159.1 ENST00000429918.2 |
HEXA
|
hexosaminidase A (alpha polypeptide) |
| chr7_+_116593292 | 0.22 |
ENST00000393446.2
ENST00000265437.5 ENST00000393451.3 |
ST7
|
suppression of tumorigenicity 7 |
| chr6_+_32936942 | 0.22 |
ENST00000496118.2
|
BRD2
|
bromodomain containing 2 |
| chr9_+_91926103 | 0.21 |
ENST00000314355.6
|
CKS2
|
CDC28 protein kinase regulatory subunit 2 |
| chr10_-_16859361 | 0.21 |
ENST00000377921.3
|
RSU1
|
Ras suppressor protein 1 |
| chr2_-_220042825 | 0.21 |
ENST00000409789.1
|
CNPPD1
|
cyclin Pas1/PHO80 domain containing 1 |
| chr1_-_11866034 | 0.21 |
ENST00000376590.3
|
MTHFR
|
methylenetetrahydrofolate reductase (NAD(P)H) |
| chr18_+_44497455 | 0.21 |
ENST00000592005.1
|
KATNAL2
|
katanin p60 subunit A-like 2 |
| chr17_+_48450575 | 0.21 |
ENST00000338165.4
ENST00000393271.2 ENST00000511519.2 |
EME1
|
essential meiotic structure-specific endonuclease 1 |
| chr22_-_29663690 | 0.21 |
ENST00000406335.1
|
RHBDD3
|
rhomboid domain containing 3 |
| chr10_+_51827648 | 0.20 |
ENST00000351071.6
ENST00000314664.7 ENST00000282633.5 |
FAM21A
|
family with sequence similarity 21, member A |
| chrX_+_23685653 | 0.20 |
ENST00000379331.3
|
PRDX4
|
peroxiredoxin 4 |
| chr9_+_130890612 | 0.20 |
ENST00000443493.1
|
AL590708.2
|
AL590708.2 |
| chr7_+_116593433 | 0.20 |
ENST00000323984.3
ENST00000393449.1 |
ST7
|
suppression of tumorigenicity 7 |
| chr5_+_65440032 | 0.20 |
ENST00000334121.6
|
SREK1
|
splicing regulatory glutamine/lysine-rich protein 1 |
| chr17_-_27053216 | 0.20 |
ENST00000292090.3
|
TLCD1
|
TLC domain containing 1 |
| chr5_+_176730769 | 0.20 |
ENST00000303204.4
ENST00000503216.1 |
PRELID1
|
PRELI domain containing 1 |
| chr14_-_65569244 | 0.20 |
ENST00000557277.1
ENST00000556892.1 |
MAX
|
MYC associated factor X |
| chr8_-_95908902 | 0.20 |
ENST00000520509.1
|
CCNE2
|
cyclin E2 |
| chr18_-_33077556 | 0.20 |
ENST00000589273.1
ENST00000586489.1 |
INO80C
|
INO80 complex subunit C |
| chr17_+_46970134 | 0.20 |
ENST00000503641.1
ENST00000514808.1 |
ATP5G1
|
ATP synthase, H+ transporting, mitochondrial Fo complex, subunit C1 (subunit 9) |
| chr17_+_7476136 | 0.20 |
ENST00000582169.1
ENST00000578754.1 ENST00000578495.1 ENST00000293831.8 ENST00000380512.5 ENST00000585024.1 ENST00000583802.1 ENST00000577269.1 ENST00000584784.1 ENST00000582746.1 |
EIF4A1
|
eukaryotic translation initiation factor 4A1 |
| chr17_-_42277203 | 0.19 |
ENST00000587097.1
|
ATXN7L3
|
ataxin 7-like 3 |
| chr16_+_72042487 | 0.19 |
ENST00000572887.1
ENST00000219240.4 ENST00000574309.1 ENST00000576145.1 |
DHODH
|
dihydroorotate dehydrogenase (quinone) |
| chrX_+_54556633 | 0.19 |
ENST00000336470.4
ENST00000360845.2 |
GNL3L
|
guanine nucleotide binding protein-like 3 (nucleolar)-like |
| chr12_-_123717711 | 0.19 |
ENST00000537854.1
|
MPHOSPH9
|
M-phase phosphoprotein 9 |
| chr1_+_45140400 | 0.19 |
ENST00000453711.1
|
C1orf228
|
chromosome 1 open reading frame 228 |
| chr22_-_31741757 | 0.19 |
ENST00000215919.3
|
PATZ1
|
POZ (BTB) and AT hook containing zinc finger 1 |
| chr14_-_91884150 | 0.19 |
ENST00000553403.1
|
CCDC88C
|
coiled-coil domain containing 88C |
| chr10_-_44070016 | 0.19 |
ENST00000374446.2
ENST00000426961.1 ENST00000535642.1 |
ZNF239
|
zinc finger protein 239 |
| chr1_+_1167594 | 0.19 |
ENST00000379198.2
|
B3GALT6
|
UDP-Gal:betaGal beta 1,3-galactosyltransferase polypeptide 6 |
| chr12_+_95611569 | 0.18 |
ENST00000261219.6
ENST00000551472.1 ENST00000552821.1 |
VEZT
|
vezatin, adherens junctions transmembrane protein |
| chr6_+_7727030 | 0.18 |
ENST00000283147.6
|
BMP6
|
bone morphogenetic protein 6 |
| chr19_-_47734448 | 0.18 |
ENST00000439096.2
|
BBC3
|
BCL2 binding component 3 |
| chr7_-_155089251 | 0.18 |
ENST00000609974.1
|
AC144652.1
|
AC144652.1 |
| chrX_-_100662881 | 0.18 |
ENST00000218516.3
|
GLA
|
galactosidase, alpha |
| chr20_+_18118486 | 0.18 |
ENST00000432901.3
|
PET117
|
PET117 homolog (S. cerevisiae) |
| chr4_+_128651530 | 0.18 |
ENST00000281154.4
|
SLC25A31
|
solute carrier family 25 (mitochondrial carrier; adenine nucleotide translocator), member 31 |
| chr2_+_27309605 | 0.18 |
ENST00000260599.6
ENST00000260598.5 ENST00000429697.1 |
KHK
|
ketohexokinase (fructokinase) |
| chr9_-_37904084 | 0.18 |
ENST00000377716.2
ENST00000242275.6 |
SLC25A51
|
solute carrier family 25, member 51 |
| chr17_-_32906388 | 0.18 |
ENST00000357754.1
|
C17orf102
|
chromosome 17 open reading frame 102 |
| chr2_+_207024306 | 0.18 |
ENST00000236957.5
ENST00000392221.1 ENST00000392222.2 ENST00000445505.1 |
EEF1B2
|
eukaryotic translation elongation factor 1 beta 2 |
| chr7_+_44836276 | 0.18 |
ENST00000451562.1
ENST00000468812.1 ENST00000489459.1 ENST00000355968.6 |
PPIA
|
peptidylprolyl isomerase A (cyclophilin A) |
| chr17_+_27052892 | 0.18 |
ENST00000579671.1
ENST00000579060.1 |
NEK8
|
NIMA-related kinase 8 |
| chr17_+_35306175 | 0.18 |
ENST00000225402.5
|
AATF
|
apoptosis antagonizing transcription factor |
| chr10_+_26986582 | 0.17 |
ENST00000376215.5
ENST00000376203.5 |
PDSS1
|
prenyl (decaprenyl) diphosphate synthase, subunit 1 |
| chr12_+_131356582 | 0.17 |
ENST00000448750.3
ENST00000541630.1 ENST00000392369.2 ENST00000254675.3 ENST00000535090.1 ENST00000392367.3 |
RAN
|
RAN, member RAS oncogene family |
| chr4_+_83351715 | 0.17 |
ENST00000273920.3
|
ENOPH1
|
enolase-phosphatase 1 |
| chr8_+_71581565 | 0.17 |
ENST00000408926.3
ENST00000520030.1 |
XKR9
|
XK, Kell blood group complex subunit-related family, member 9 |
| chr17_-_47492164 | 0.17 |
ENST00000512041.2
ENST00000446735.1 ENST00000504124.1 |
PHB
|
prohibitin |
| chr14_-_81687575 | 0.17 |
ENST00000434192.2
|
GTF2A1
|
general transcription factor IIA, 1, 19/37kDa |
| chr6_-_167369612 | 0.17 |
ENST00000507747.1
|
RP11-514O12.4
|
RP11-514O12.4 |
| chr1_-_45672221 | 0.17 |
ENST00000359600.5
|
ZSWIM5
|
zinc finger, SWIM-type containing 5 |
| chr12_+_54674482 | 0.17 |
ENST00000547708.1
ENST00000340913.6 ENST00000551702.1 ENST00000330752.8 ENST00000547276.1 |
HNRNPA1
|
heterogeneous nuclear ribonucleoprotein A1 |
| chr7_+_72742162 | 0.17 |
ENST00000431982.2
|
FKBP6
|
FK506 binding protein 6, 36kDa |
| chr11_+_75479850 | 0.17 |
ENST00000376262.3
ENST00000604733.1 |
DGAT2
|
diacylglycerol O-acyltransferase 2 |
| chr18_+_33877654 | 0.17 |
ENST00000257209.4
ENST00000445677.1 ENST00000590592.1 ENST00000359247.4 |
FHOD3
|
formin homology 2 domain containing 3 |
| chr3_-_112280709 | 0.16 |
ENST00000402314.2
ENST00000283290.5 ENST00000492886.1 |
ATG3
|
autophagy related 3 |
| chr22_-_36903069 | 0.16 |
ENST00000216187.6
ENST00000423980.1 |
FOXRED2
|
FAD-dependent oxidoreductase domain containing 2 |
| chr16_-_54963026 | 0.16 |
ENST00000560208.1
ENST00000557792.1 |
CRNDE
|
colorectal neoplasia differentially expressed (non-protein coding) |
| chr7_-_47621229 | 0.16 |
ENST00000434451.1
|
TNS3
|
tensin 3 |
| chr1_-_154193009 | 0.16 |
ENST00000368518.1
ENST00000368519.1 ENST00000368521.5 |
C1orf43
|
chromosome 1 open reading frame 43 |
| chr14_+_92789498 | 0.16 |
ENST00000531433.1
|
SLC24A4
|
solute carrier family 24 (sodium/potassium/calcium exchanger), member 4 |
| chr12_-_9102224 | 0.16 |
ENST00000543845.1
ENST00000544245.1 |
M6PR
|
mannose-6-phosphate receptor (cation dependent) |
| chr3_-_149688971 | 0.16 |
ENST00000498307.1
ENST00000489155.1 |
PFN2
|
profilin 2 |
| chr2_+_177053307 | 0.16 |
ENST00000331462.4
|
HOXD1
|
homeobox D1 |
| chr9_+_133454943 | 0.16 |
ENST00000319725.9
|
FUBP3
|
far upstream element (FUSE) binding protein 3 |
| chr6_+_151561506 | 0.16 |
ENST00000253332.1
|
AKAP12
|
A kinase (PRKA) anchor protein 12 |
| chr9_+_6758024 | 0.16 |
ENST00000442236.2
|
KDM4C
|
lysine (K)-specific demethylase 4C |
| chr17_-_37886752 | 0.16 |
ENST00000577810.1
|
MIEN1
|
migration and invasion enhancer 1 |
| chr1_+_11866207 | 0.16 |
ENST00000312413.6
ENST00000346436.6 |
CLCN6
|
chloride channel, voltage-sensitive 6 |
| chr3_-_150481218 | 0.16 |
ENST00000482706.1
|
SIAH2
|
siah E3 ubiquitin protein ligase 2 |
| chr17_+_5185552 | 0.16 |
ENST00000262477.6
ENST00000408982.2 ENST00000575991.1 ENST00000537505.1 ENST00000546142.2 |
RABEP1
|
rabaptin, RAB GTPase binding effector protein 1 |
| chr2_+_10183651 | 0.16 |
ENST00000305883.1
|
KLF11
|
Kruppel-like factor 11 |
| chr9_-_127533582 | 0.16 |
ENST00000416460.2
|
NR6A1
|
nuclear receptor subfamily 6, group A, member 1 |
| chrX_+_55744166 | 0.16 |
ENST00000374941.4
ENST00000414239.1 |
RRAGB
|
Ras-related GTP binding B |
| chr17_-_48450265 | 0.16 |
ENST00000507088.1
|
MRPL27
|
mitochondrial ribosomal protein L27 |
| chr1_-_38218577 | 0.15 |
ENST00000540011.1
|
EPHA10
|
EPH receptor A10 |
| chr1_-_43833628 | 0.15 |
ENST00000413844.2
ENST00000372458.3 |
ELOVL1
|
ELOVL fatty acid elongase 1 |
| chr5_+_43120985 | 0.15 |
ENST00000515326.1
|
ZNF131
|
zinc finger protein 131 |
| chr22_+_24891210 | 0.15 |
ENST00000382760.2
|
UPB1
|
ureidopropionase, beta |
| chr1_-_52521831 | 0.15 |
ENST00000371626.4
|
TXNDC12
|
thioredoxin domain containing 12 (endoplasmic reticulum) |
| chr17_+_30813576 | 0.15 |
ENST00000313401.3
|
CDK5R1
|
cyclin-dependent kinase 5, regulatory subunit 1 (p35) |
| chr10_+_104474207 | 0.15 |
ENST00000602831.1
ENST00000369893.5 |
SFXN2
|
sideroflexin 2 |
| chr5_-_176738883 | 0.15 |
ENST00000513169.1
ENST00000423571.2 ENST00000502529.1 ENST00000427908.2 |
MXD3
|
MAX dimerization protein 3 |
| chr6_+_31865552 | 0.15 |
ENST00000469372.1
ENST00000497706.1 |
C2
|
complement component 2 |
| chr2_+_216176761 | 0.15 |
ENST00000540518.1
ENST00000435675.1 |
ATIC
|
5-aminoimidazole-4-carboxamide ribonucleotide formyltransferase/IMP cyclohydrolase |
| chr3_+_186649133 | 0.15 |
ENST00000417392.1
|
ST6GAL1
|
ST6 beta-galactosamide alpha-2,6-sialyltranferase 1 |
| chr10_-_6019552 | 0.15 |
ENST00000379977.3
ENST00000397251.3 ENST00000397248.2 |
IL15RA
|
interleukin 15 receptor, alpha |
| chr6_+_33359582 | 0.15 |
ENST00000450504.1
|
KIFC1
|
kinesin family member C1 |
| chr11_+_66115304 | 0.15 |
ENST00000531602.1
|
RP11-867G23.8
|
Uncharacterized protein |
| chr10_-_16859442 | 0.15 |
ENST00000602389.1
ENST00000345264.5 |
RSU1
|
Ras suppressor protein 1 |
| chr1_+_19578033 | 0.15 |
ENST00000330263.4
|
MRTO4
|
mRNA turnover 4 homolog (S. cerevisiae) |
| chr10_-_99258135 | 0.15 |
ENST00000327238.10
ENST00000327277.7 ENST00000355839.6 ENST00000437002.1 ENST00000422685.1 |
MMS19
|
MMS19 nucleotide excision repair homolog (S. cerevisiae) |
| chr22_+_18593097 | 0.15 |
ENST00000426208.1
|
TUBA8
|
tubulin, alpha 8 |
| chr19_+_4402659 | 0.14 |
ENST00000301280.5
ENST00000585854.1 |
CHAF1A
|
chromatin assembly factor 1, subunit A (p150) |
| chr20_+_42839600 | 0.14 |
ENST00000439943.1
ENST00000437730.1 |
OSER1-AS1
|
OSER1 antisense RNA 1 (head to head) |
| chr15_-_82555000 | 0.14 |
ENST00000557844.1
ENST00000359445.3 ENST00000268206.7 |
EFTUD1
|
elongation factor Tu GTP binding domain containing 1 |
| chr6_-_114292284 | 0.14 |
ENST00000520895.1
ENST00000521163.1 ENST00000524334.1 ENST00000368632.2 ENST00000398283.2 |
HDAC2
|
histone deacetylase 2 |
| chr19_+_19516561 | 0.14 |
ENST00000457895.2
|
GATAD2A
|
GATA zinc finger domain containing 2A |
| chr1_+_45140360 | 0.14 |
ENST00000418644.1
ENST00000458657.2 ENST00000441519.1 ENST00000535358.1 ENST00000445071.1 |
C1orf228
|
chromosome 1 open reading frame 228 |
| chr4_-_53522703 | 0.14 |
ENST00000508499.1
|
USP46
|
ubiquitin specific peptidase 46 |
| chr9_+_6757634 | 0.14 |
ENST00000543771.1
ENST00000401787.3 ENST00000381306.3 ENST00000381309.3 |
KDM4C
|
lysine (K)-specific demethylase 4C |
| chr17_+_46970178 | 0.14 |
ENST00000393366.2
ENST00000506855.1 |
ATP5G1
|
ATP synthase, H+ transporting, mitochondrial Fo complex, subunit C1 (subunit 9) |
| chr18_+_12948000 | 0.14 |
ENST00000585730.1
ENST00000399892.2 ENST00000589446.1 ENST00000587761.1 |
SEH1L
|
SEH1-like (S. cerevisiae) |
| chr18_+_12947981 | 0.14 |
ENST00000262124.11
|
SEH1L
|
SEH1-like (S. cerevisiae) |
| chr16_+_29467127 | 0.14 |
ENST00000344620.6
|
SULT1A4
|
sulfotransferase family, cytosolic, 1A, phenol-preferring, member 4 |
| chr4_-_5891918 | 0.14 |
ENST00000512574.1
|
CRMP1
|
collapsin response mediator protein 1 |
| chr10_+_46222648 | 0.14 |
ENST00000336378.4
ENST00000540872.1 ENST00000537517.1 ENST00000374362.2 ENST00000359860.4 ENST00000420848.1 |
FAM21C
|
family with sequence similarity 21, member C |
| chr2_+_86116396 | 0.14 |
ENST00000455121.3
|
AC105053.4
|
AC105053.4 |
| chr22_+_27068766 | 0.14 |
ENST00000435162.1
ENST00000437071.1 ENST00000440816.1 ENST00000421253.1 |
CTA-211A9.5
|
CTA-211A9.5 |
| chr3_-_170626418 | 0.14 |
ENST00000474096.1
ENST00000295822.2 |
EIF5A2
|
eukaryotic translation initiation factor 5A2 |
| chr6_+_160390102 | 0.14 |
ENST00000356956.1
|
IGF2R
|
insulin-like growth factor 2 receptor |
| chr3_+_186648507 | 0.14 |
ENST00000458216.1
|
ST6GAL1
|
ST6 beta-galactosamide alpha-2,6-sialyltranferase 1 |
| chr7_+_2393714 | 0.14 |
ENST00000431643.1
|
EIF3B
|
eukaryotic translation initiation factor 3, subunit B |
| chr17_+_17876127 | 0.14 |
ENST00000582416.1
ENST00000313838.8 ENST00000411504.2 ENST00000581264.1 ENST00000399187.1 ENST00000479684.2 ENST00000584166.1 ENST00000585108.1 ENST00000399182.1 ENST00000579977.1 |
LRRC48
|
leucine rich repeat containing 48 |
| chr15_+_32322685 | 0.14 |
ENST00000454250.3
ENST00000306901.3 |
CHRNA7
|
cholinergic receptor, nicotinic, alpha 7 (neuronal) |
| chr2_+_74212073 | 0.14 |
ENST00000441217.1
|
AC073046.25
|
AC073046.25 |
| chr8_+_95907993 | 0.14 |
ENST00000523378.1
|
NDUFAF6
|
NADH dehydrogenase (ubiquinone) complex I, assembly factor 6 |
| chr6_-_153304697 | 0.13 |
ENST00000367241.3
|
FBXO5
|
F-box protein 5 |
| chr11_+_18343800 | 0.13 |
ENST00000453096.2
|
GTF2H1
|
general transcription factor IIH, polypeptide 1, 62kDa |
| chr21_-_40720995 | 0.13 |
ENST00000380749.5
|
HMGN1
|
high mobility group nucleosome binding domain 1 |
| chr1_+_11333546 | 0.13 |
ENST00000376804.2
|
UBIAD1
|
UbiA prenyltransferase domain containing 1 |
| chr5_-_122759032 | 0.13 |
ENST00000510582.3
ENST00000328236.5 ENST00000306481.6 ENST00000508442.2 ENST00000395431.2 |
CEP120
|
centrosomal protein 120kDa |
| chr11_-_126081532 | 0.13 |
ENST00000533628.1
ENST00000298317.4 ENST00000532674.1 |
RPUSD4
|
RNA pseudouridylate synthase domain containing 4 |
| chr2_+_192542879 | 0.13 |
ENST00000409510.1
|
NABP1
|
nucleic acid binding protein 1 |
| chr1_-_212873267 | 0.13 |
ENST00000243440.1
|
BATF3
|
basic leucine zipper transcription factor, ATF-like 3 |
| chrX_-_128977875 | 0.13 |
ENST00000406492.2
|
ZDHHC9
|
zinc finger, DHHC-type containing 9 |
| chr19_+_1407733 | 0.13 |
ENST00000592453.1
|
DAZAP1
|
DAZ associated protein 1 |
| chr11_+_126081662 | 0.13 |
ENST00000528985.1
ENST00000529731.1 ENST00000360194.4 ENST00000530043.1 |
FAM118B
|
family with sequence similarity 118, member B |
| chr18_-_21977748 | 0.13 |
ENST00000399441.4
ENST00000319481.3 |
OSBPL1A
|
oxysterol binding protein-like 1A |
| chr9_+_34646651 | 0.13 |
ENST00000378842.3
|
GALT
|
galactose-1-phosphate uridylyltransferase |
| chr19_-_14201507 | 0.13 |
ENST00000533683.2
|
SAMD1
|
sterile alpha motif domain containing 1 |
| chr2_-_232329186 | 0.13 |
ENST00000322723.4
|
NCL
|
nucleolin |
| chrX_+_134124968 | 0.13 |
ENST00000330288.4
|
SMIM10
|
small integral membrane protein 10 |
| chr7_+_116593568 | 0.13 |
ENST00000446490.1
|
ST7
|
suppression of tumorigenicity 7 |
| chr20_-_44519839 | 0.13 |
ENST00000372518.4
|
NEURL2
|
neuralized E3 ubiquitin protein ligase 2 |
| chr1_+_109656579 | 0.13 |
ENST00000526264.1
ENST00000369939.3 |
KIAA1324
|
KIAA1324 |
| chr12_+_130822606 | 0.13 |
ENST00000546060.1
ENST00000539400.1 |
PIWIL1
|
piwi-like RNA-mediated gene silencing 1 |
| chr5_+_151151504 | 0.13 |
ENST00000356245.3
ENST00000507878.2 |
G3BP1
|
GTPase activating protein (SH3 domain) binding protein 1 |
| chr17_+_76311791 | 0.13 |
ENST00000586321.1
|
AC061992.2
|
AC061992.2 |
| chr12_+_122356488 | 0.13 |
ENST00000397454.2
|
WDR66
|
WD repeat domain 66 |
| chr6_-_105584560 | 0.13 |
ENST00000336775.5
|
BVES
|
blood vessel epicardial substance |
| chr5_+_112227311 | 0.13 |
ENST00000391338.1
|
ZRSR1
|
zinc finger (CCCH type), RNA-binding motif and serine/arginine rich 1 |
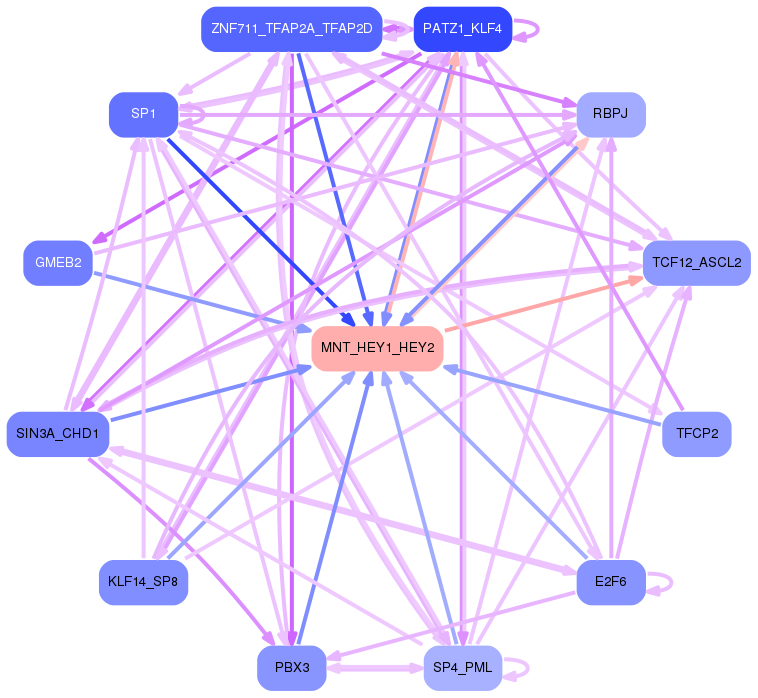
Network of associatons between targets according to the STRING database.

First level regulatory network of MNT_HEY1_HEY2
Gene Ontology Analysis
Gene overrepresentation in biological_process category:
| Log-likelihood per target | Total log-likelihood | Term | Description |
|---|---|---|---|
| 0.4 | 3.2 | GO:1904637 | response to ionomycin(GO:1904636) cellular response to ionomycin(GO:1904637) |
| 0.3 | 0.8 | GO:0090291 | regulation of toll-like receptor 5 signaling pathway(GO:0034147) negative regulation of toll-like receptor 5 signaling pathway(GO:0034148) negative regulation of nucleotide-binding oligomerization domain containing 1 signaling pathway(GO:0070429) tolerance induction to lipopolysaccharide(GO:0072573) negative regulation of osteoclast proliferation(GO:0090291) negative regulation of CD40 signaling pathway(GO:2000349) |
| 0.2 | 1.4 | GO:1905098 | negative regulation of guanyl-nucleotide exchange factor activity(GO:1905098) |
| 0.2 | 0.9 | GO:0043335 | protein unfolding(GO:0043335) |
| 0.1 | 0.9 | GO:0061484 | hematopoietic stem cell homeostasis(GO:0061484) |
| 0.1 | 0.9 | GO:0043932 | ossification involved in bone remodeling(GO:0043932) |
| 0.1 | 0.6 | GO:0070829 | response to vitamin B2(GO:0033274) heterochromatin maintenance(GO:0070829) |
| 0.1 | 0.3 | GO:0046168 | glycerol-3-phosphate catabolic process(GO:0046168) |
| 0.1 | 0.2 | GO:0035281 | pre-miRNA export from nucleus(GO:0035281) |
| 0.1 | 0.2 | GO:0006258 | UDP-glucose catabolic process(GO:0006258) |
| 0.1 | 0.2 | GO:0007057 | spindle assembly involved in female meiosis I(GO:0007057) |
| 0.1 | 0.3 | GO:2000259 | positive regulation of complement activation(GO:0045917) positive regulation of protein activation cascade(GO:2000259) |
| 0.1 | 0.3 | GO:0060708 | spongiotrophoblast differentiation(GO:0060708) |
| 0.1 | 0.3 | GO:0045347 | negative regulation of MHC class II biosynthetic process(GO:0045347) |
| 0.1 | 0.2 | GO:0006286 | base-excision repair, base-free sugar-phosphate removal(GO:0006286) |
| 0.1 | 0.2 | GO:0046452 | dihydrofolate metabolic process(GO:0046452) |
| 0.1 | 0.4 | GO:1900113 | negative regulation of histone H3-K9 trimethylation(GO:1900113) |
| 0.1 | 0.2 | GO:0044205 | 'de novo' UMP biosynthetic process(GO:0044205) |
| 0.1 | 0.3 | GO:0010636 | positive regulation of mitochondrial fusion(GO:0010636) |
| 0.1 | 0.2 | GO:0021718 | superior olivary nucleus development(GO:0021718) superior olivary nucleus maturation(GO:0021722) |
| 0.0 | 0.4 | GO:0018242 | protein O-linked glycosylation via serine(GO:0018242) |
| 0.0 | 0.7 | GO:1904263 | positive regulation of TORC1 signaling(GO:1904263) |
| 0.0 | 0.6 | GO:1901838 | positive regulation of transcription of nuclear large rRNA transcript from RNA polymerase I promoter(GO:1901838) |
| 0.0 | 0.2 | GO:0071400 | cellular response to oleic acid(GO:0071400) |
| 0.0 | 0.2 | GO:2000255 | negative regulation of male germ cell proliferation(GO:2000255) |
| 0.0 | 0.1 | GO:0061582 | intestinal epithelial cell migration(GO:0061582) |
| 0.0 | 0.1 | GO:0048041 | cell-substrate adherens junction assembly(GO:0007045) focal adhesion assembly(GO:0048041) |
| 0.0 | 0.1 | GO:1904530 | negative regulation of actin filament binding(GO:1904530) negative regulation of actin binding(GO:1904617) |
| 0.0 | 0.3 | GO:0006014 | D-ribose metabolic process(GO:0006014) pentose-phosphate shunt, non-oxidative branch(GO:0009052) |
| 0.0 | 0.2 | GO:0048631 | regulation of skeletal muscle tissue growth(GO:0048631) |
| 0.0 | 0.2 | GO:0048698 | negative regulation of collateral sprouting in absence of injury(GO:0048698) |
| 0.0 | 0.2 | GO:1903936 | response to sodium arsenite(GO:1903935) cellular response to sodium arsenite(GO:1903936) |
| 0.0 | 0.1 | GO:0060931 | sinoatrial node cell development(GO:0060931) |
| 0.0 | 0.2 | GO:0072429 | response to intra-S DNA damage checkpoint signaling(GO:0072429) |
| 0.0 | 0.2 | GO:1901857 | positive regulation of cellular respiration(GO:1901857) |
| 0.0 | 0.1 | GO:0002101 | tRNA wobble cytosine modification(GO:0002101) |
| 0.0 | 0.2 | GO:0009233 | menaquinone metabolic process(GO:0009233) |
| 0.0 | 0.2 | GO:0019482 | beta-alanine metabolic process(GO:0019482) |
| 0.0 | 0.2 | GO:1901165 | positive regulation of trophoblast cell migration(GO:1901165) |
| 0.0 | 0.1 | GO:0034471 | endonucleolytic cleavage to generate mature 5'-end of SSU-rRNA from (SSU-rRNA, 5.8S rRNA, LSU-rRNA)(GO:0000472) rRNA 5'-end processing(GO:0000967) ncRNA 5'-end processing(GO:0034471) |
| 0.0 | 0.1 | GO:0002188 | translation reinitiation(GO:0002188) |
| 0.0 | 0.0 | GO:0048807 | female genitalia morphogenesis(GO:0048807) |
| 0.0 | 0.2 | GO:0090031 | positive regulation of steroid hormone biosynthetic process(GO:0090031) |
| 0.0 | 0.2 | GO:0051029 | rRNA transport(GO:0051029) |
| 0.0 | 0.1 | GO:0006059 | hexitol metabolic process(GO:0006059) |
| 0.0 | 0.1 | GO:1905246 | regulation of choline O-acetyltransferase activity(GO:1902769) positive regulation of choline O-acetyltransferase activity(GO:1902771) negative regulation of tau-protein kinase activity(GO:1902948) positive regulation of early endosome to recycling endosome transport(GO:1902955) negative regulation of aspartic-type endopeptidase activity involved in amyloid precursor protein catabolic process(GO:1902960) negative regulation of neurofibrillary tangle assembly(GO:1902997) negative regulation of aspartic-type peptidase activity(GO:1905246) |
| 0.0 | 0.1 | GO:0002368 | B cell cytokine production(GO:0002368) protein import into mitochondrial intermembrane space(GO:0045041) |
| 0.0 | 0.2 | GO:0033387 | putrescine biosynthetic process from ornithine(GO:0033387) |
| 0.0 | 0.2 | GO:0015862 | uridine transport(GO:0015862) |
| 0.0 | 0.2 | GO:0086021 | SA node cell to atrial cardiac muscle cell communication by electrical coupling(GO:0086021) |
| 0.0 | 0.1 | GO:0072720 | cellular response to mycotoxin(GO:0036146) response to dithiothreitol(GO:0072720) |
| 0.0 | 0.1 | GO:0003420 | growth plate cartilage chondrocyte proliferation(GO:0003419) regulation of growth plate cartilage chondrocyte proliferation(GO:0003420) |
| 0.0 | 0.2 | GO:0000160 | phosphorelay signal transduction system(GO:0000160) |
| 0.0 | 0.2 | GO:0061624 | fructose catabolic process(GO:0006001) fructose catabolic process to hydroxyacetone phosphate and glyceraldehyde-3-phosphate(GO:0061624) |
| 0.0 | 0.2 | GO:0044800 | fusion of virus membrane with host plasma membrane(GO:0019064) membrane fusion involved in viral entry into host cell(GO:0039663) multi-organism membrane fusion(GO:0044800) |
| 0.0 | 0.3 | GO:0019509 | L-methionine biosynthetic process from methylthioadenosine(GO:0019509) |
| 0.0 | 0.6 | GO:1904816 | positive regulation of protein localization to chromosome, telomeric region(GO:1904816) |
| 0.0 | 0.1 | GO:1990737 | response to manganese-induced endoplasmic reticulum stress(GO:1990737) |
| 0.0 | 0.1 | GO:0060265 | positive regulation of respiratory burst involved in inflammatory response(GO:0060265) |
| 0.0 | 0.1 | GO:1903660 | negative regulation of complement-dependent cytotoxicity(GO:1903660) |
| 0.0 | 0.1 | GO:0046022 | positive regulation of transcription from RNA polymerase II promoter during mitosis(GO:0046022) |
| 0.0 | 0.4 | GO:2000766 | negative regulation of cytoplasmic translation(GO:2000766) |
| 0.0 | 0.1 | GO:0090076 | relaxation of skeletal muscle(GO:0090076) |
| 0.0 | 0.1 | GO:0042998 | positive regulation of Golgi to plasma membrane protein transport(GO:0042998) |
| 0.0 | 0.1 | GO:0019858 | cytosine metabolic process(GO:0019858) |
| 0.0 | 0.1 | GO:1903697 | negative regulation of microvillus assembly(GO:1903697) |
| 0.0 | 0.1 | GO:0000966 | RNA 5'-end processing(GO:0000966) |
| 0.0 | 0.1 | GO:2000342 | negative regulation of chemokine (C-X-C motif) ligand 2 production(GO:2000342) |
| 0.0 | 0.1 | GO:0060399 | positive regulation of growth hormone receptor signaling pathway(GO:0060399) |
| 0.0 | 0.1 | GO:0006288 | base-excision repair, DNA ligation(GO:0006288) |
| 0.0 | 0.3 | GO:0030322 | stabilization of membrane potential(GO:0030322) |
| 0.0 | 0.2 | GO:0035694 | mitochondrial protein catabolic process(GO:0035694) |
| 0.0 | 0.1 | GO:1902963 | regulation of metalloendopeptidase activity involved in amyloid precursor protein catabolic process(GO:1902962) negative regulation of metalloendopeptidase activity involved in amyloid precursor protein catabolic process(GO:1902963) |
| 0.0 | 0.1 | GO:0046833 | positive regulation of RNA export from nucleus(GO:0046833) |
| 0.0 | 0.1 | GO:0009257 | 10-formyltetrahydrofolate biosynthetic process(GO:0009257) |
| 0.0 | 0.1 | GO:1904049 | negative regulation of spontaneous neurotransmitter secretion(GO:1904049) |
| 0.0 | 0.3 | GO:0000492 | box C/D snoRNP assembly(GO:0000492) |
| 0.0 | 0.2 | GO:0072553 | terminal button organization(GO:0072553) |
| 0.0 | 0.1 | GO:0006667 | sphinganine metabolic process(GO:0006667) |
| 0.0 | 0.3 | GO:0010739 | positive regulation of protein kinase A signaling(GO:0010739) |
| 0.0 | 0.2 | GO:0032929 | negative regulation of superoxide anion generation(GO:0032929) |
| 0.0 | 0.1 | GO:0002949 | tRNA threonylcarbamoyladenosine modification(GO:0002949) |
| 0.0 | 0.2 | GO:0021840 | directional guidance of interneurons involved in migration from the subpallium to the cortex(GO:0021840) chemorepulsion involved in interneuron migration from the subpallium to the cortex(GO:0021842) ERBB3 signaling pathway(GO:0038129) |
| 0.0 | 0.0 | GO:0001508 | action potential(GO:0001508) |
| 0.0 | 0.0 | GO:2001245 | regulation of phosphatidylcholine biosynthetic process(GO:2001245) |
| 0.0 | 0.1 | GO:0051101 | regulation of DNA binding(GO:0051101) |
| 0.0 | 0.1 | GO:0010286 | heat acclimation(GO:0010286) cellular heat acclimation(GO:0070370) |
| 0.0 | 0.1 | GO:0051037 | regulation of transcription involved in meiotic cell cycle(GO:0051037) |
| 0.0 | 0.1 | GO:1903774 | positive regulation of viral budding via host ESCRT complex(GO:1903774) |
| 0.0 | 0.1 | GO:1902904 | negative regulation of fibril organization(GO:1902904) chaperone-mediated autophagy translocation complex disassembly(GO:1904764) |
| 0.0 | 0.2 | GO:0035093 | spermatogenesis, exchange of chromosomal proteins(GO:0035093) |
| 0.0 | 0.1 | GO:0090070 | positive regulation of ribosome biogenesis(GO:0090070) positive regulation of rRNA processing(GO:2000234) |
| 0.0 | 0.1 | GO:0033685 | negative regulation of luteinizing hormone secretion(GO:0033685) operant conditioning(GO:0035106) |
| 0.0 | 0.1 | GO:0015670 | carbon dioxide transport(GO:0015670) |
| 0.0 | 0.1 | GO:0035377 | transepithelial water transport(GO:0035377) positive regulation of cyclic nucleotide-gated ion channel activity(GO:1902161) |
| 0.0 | 0.1 | GO:0046901 | tetrahydrofolylpolyglutamate biosynthetic process(GO:0046901) |
| 0.0 | 0.1 | GO:2000051 | Wnt receptor catabolic process(GO:0038018) negative regulation of non-canonical Wnt signaling pathway(GO:2000051) |
| 0.0 | 0.2 | GO:0006552 | leucine catabolic process(GO:0006552) |
| 0.0 | 0.1 | GO:0052565 | response to defense-related nitric oxide production by other organism involved in symbiotic interaction(GO:0052551) response to defense-related host nitric oxide production(GO:0052565) |
| 0.0 | 0.1 | GO:1902024 | histidine transport(GO:0015817) L-histidine transmembrane transport(GO:0089709) L-histidine transport(GO:1902024) |
| 0.0 | 0.0 | GO:0035397 | helper T cell enhancement of adaptive immune response(GO:0035397) |
| 0.0 | 0.1 | GO:1904933 | regulation of cell proliferation in midbrain(GO:1904933) |
| 0.0 | 0.1 | GO:0050893 | sensory processing(GO:0050893) |
| 0.0 | 0.0 | GO:0031929 | TOR signaling(GO:0031929) regulation of TOR signaling(GO:0032006) |
| 0.0 | 0.0 | GO:0099525 | presynaptic dense core granule exocytosis(GO:0099525) |
| 0.0 | 0.0 | GO:0072034 | renal vesicle induction(GO:0072034) |
| 0.0 | 0.1 | GO:0015766 | disaccharide transport(GO:0015766) sucrose transport(GO:0015770) oligosaccharide transport(GO:0015772) |
| 0.0 | 0.2 | GO:0032815 | negative regulation of natural killer cell activation(GO:0032815) |
| 0.0 | 0.0 | GO:0060054 | positive regulation of epithelial cell proliferation involved in wound healing(GO:0060054) |
| 0.0 | 0.2 | GO:0022027 | interkinetic nuclear migration(GO:0022027) |
| 0.0 | 0.0 | GO:0031133 | regulation of axon diameter(GO:0031133) |
| 0.0 | 0.1 | GO:0046604 | positive regulation of mitotic centrosome separation(GO:0046604) |
| 0.0 | 0.1 | GO:1990426 | homologous recombination-dependent replication fork processing(GO:1990426) |
| 0.0 | 0.6 | GO:0042776 | mitochondrial ATP synthesis coupled proton transport(GO:0042776) |
| 0.0 | 0.1 | GO:0043654 | recognition of apoptotic cell(GO:0043654) |
| 0.0 | 0.1 | GO:0048817 | negative regulation of hair follicle maturation(GO:0048817) |
| 0.0 | 0.2 | GO:0016139 | glycoside catabolic process(GO:0016139) |
| 0.0 | 0.1 | GO:0008343 | adult feeding behavior(GO:0008343) |
| 0.0 | 0.0 | GO:2000777 | positive regulation of proteasomal ubiquitin-dependent protein catabolic process involved in cellular response to hypoxia(GO:2000777) |
| 0.0 | 0.2 | GO:0021853 | cerebral cortex GABAergic interneuron migration(GO:0021853) interneuron migration(GO:1904936) |
| 0.0 | 0.1 | GO:0002337 | B-1a B cell differentiation(GO:0002337) |
| 0.0 | 0.1 | GO:0045575 | basophil activation involved in immune response(GO:0002276) basophil activation(GO:0045575) |
| 0.0 | 0.2 | GO:0019367 | fatty acid elongation, saturated fatty acid(GO:0019367) fatty acid elongation, unsaturated fatty acid(GO:0019368) fatty acid elongation, monounsaturated fatty acid(GO:0034625) fatty acid elongation, polyunsaturated fatty acid(GO:0034626) |
| 0.0 | 0.1 | GO:0035803 | egg coat formation(GO:0035803) |
| 0.0 | 0.0 | GO:0060730 | regulation of intestinal epithelial structure maintenance(GO:0060730) |
| 0.0 | 0.0 | GO:1901301 | regulation of cargo loading into COPII-coated vesicle(GO:1901301) |
| 0.0 | 0.3 | GO:0051085 | chaperone mediated protein folding requiring cofactor(GO:0051085) |
| 0.0 | 0.0 | GO:0000454 | snoRNA guided rRNA pseudouridine synthesis(GO:0000454) |
| 0.0 | 0.1 | GO:0008295 | spermidine biosynthetic process(GO:0008295) |
| 0.0 | 0.1 | GO:0002028 | regulation of sodium ion transport(GO:0002028) |
| 0.0 | 0.1 | GO:0036071 | N-glycan fucosylation(GO:0036071) |
| 0.0 | 0.2 | GO:0000414 | regulation of histone H3-K36 methylation(GO:0000414) |
| 0.0 | 0.2 | GO:0002191 | cap-dependent translational initiation(GO:0002191) |
| 0.0 | 0.1 | GO:0035752 | lysosomal lumen pH elevation(GO:0035752) |
| 0.0 | 0.1 | GO:0043686 | co-translational protein modification(GO:0043686) |
| 0.0 | 0.0 | GO:0021882 | regulation of transcription from RNA polymerase II promoter involved in forebrain neuron fate commitment(GO:0021882) cerebral cortex GABAergic interneuron fate commitment(GO:0021893) positive regulation of neural retina development(GO:0061075) positive regulation of retina development in camera-type eye(GO:1902868) positive regulation of amacrine cell differentiation(GO:1902871) |
| 0.0 | 0.2 | GO:0034723 | DNA replication-dependent nucleosome assembly(GO:0006335) DNA replication-dependent nucleosome organization(GO:0034723) |
| 0.0 | 0.0 | GO:0048145 | regulation of fibroblast proliferation(GO:0048145) positive regulation of fibroblast proliferation(GO:0048146) |
| 0.0 | 0.0 | GO:0016180 | snRNA processing(GO:0016180) snRNA 3'-end processing(GO:0034472) |
| 0.0 | 0.1 | GO:0070245 | positive regulation of thymocyte apoptotic process(GO:0070245) |
| 0.0 | 0.0 | GO:0051006 | positive regulation of lipoprotein lipase activity(GO:0051006) |
| 0.0 | 0.1 | GO:0075525 | viral translational termination-reinitiation(GO:0075525) |
| 0.0 | 0.1 | GO:0038086 | VEGF-activated platelet-derived growth factor receptor signaling pathway(GO:0038086) positive regulation of cell proliferation by VEGF-activated platelet derived growth factor receptor signaling pathway(GO:0038091) |
| 0.0 | 0.1 | GO:1903608 | protein localization to cytoplasmic stress granule(GO:1903608) |
| 0.0 | 0.1 | GO:0061724 | lipophagy(GO:0061724) negative regulation of exosomal secretion(GO:1903542) |
| 0.0 | 1.1 | GO:0010501 | RNA secondary structure unwinding(GO:0010501) |
| 0.0 | 0.1 | GO:0010898 | positive regulation of triglyceride catabolic process(GO:0010898) |
| 0.0 | 0.1 | GO:0043403 | skeletal muscle tissue regeneration(GO:0043403) |
| 0.0 | 0.1 | GO:0010807 | regulation of synaptic vesicle priming(GO:0010807) |
| 0.0 | 0.1 | GO:1904628 | response to phorbol 13-acetate 12-myristate(GO:1904627) cellular response to phorbol 13-acetate 12-myristate(GO:1904628) |
| 0.0 | 0.1 | GO:0044208 | 'de novo' AMP biosynthetic process(GO:0044208) |
| 0.0 | 0.0 | GO:0035606 | peptidyl-cysteine S-trans-nitrosylation(GO:0035606) |
| 0.0 | 0.0 | GO:1902044 | regulation of Fas signaling pathway(GO:1902044) |
| 0.0 | 0.1 | GO:0006572 | tyrosine catabolic process(GO:0006572) |
| 0.0 | 0.0 | GO:0046963 | 3'-phosphoadenosine 5'-phosphosulfate transport(GO:0046963) 3'-phospho-5'-adenylyl sulfate transmembrane transport(GO:1902559) |
| 0.0 | 0.1 | GO:0006308 | DNA catabolic process(GO:0006308) |
| 0.0 | 0.1 | GO:0030242 | pexophagy(GO:0030242) |
| 0.0 | 0.0 | GO:0006591 | ornithine metabolic process(GO:0006591) |
| 0.0 | 0.0 | GO:0072356 | chromosome passenger complex localization to kinetochore(GO:0072356) |
| 0.0 | 0.0 | GO:1903033 | regulation of microtubule plus-end binding(GO:1903031) positive regulation of microtubule plus-end binding(GO:1903033) |
| 0.0 | 0.0 | GO:0001501 | skeletal system development(GO:0001501) |
| 0.0 | 0.1 | GO:1903347 | negative regulation of bicellular tight junction assembly(GO:1903347) |
| 0.0 | 0.1 | GO:0019521 | aldonic acid metabolic process(GO:0019520) D-gluconate metabolic process(GO:0019521) |
| 0.0 | 0.1 | GO:0071569 | protein ufmylation(GO:0071569) |
| 0.0 | 0.1 | GO:0048386 | positive regulation of retinoic acid receptor signaling pathway(GO:0048386) |
| 0.0 | 0.0 | GO:0031106 | septin ring assembly(GO:0000921) septin ring organization(GO:0031106) |
| 0.0 | 0.3 | GO:0006089 | lactate metabolic process(GO:0006089) |
| 0.0 | 0.0 | GO:0045081 | negative regulation of interleukin-10 biosynthetic process(GO:0045081) |
| 0.0 | 0.0 | GO:0042412 | taurine biosynthetic process(GO:0042412) |
| 0.0 | 0.0 | GO:0006072 | glycerol-3-phosphate metabolic process(GO:0006072) |
| 0.0 | 0.1 | GO:0015886 | heme transport(GO:0015886) |
| 0.0 | 0.0 | GO:1990922 | regulation of hepatic stellate cell proliferation(GO:1904897) positive regulation of hepatic stellate cell proliferation(GO:1904899) hepatic stellate cell proliferation(GO:1990922) |
| 0.0 | 0.1 | GO:0035751 | regulation of lysosomal lumen pH(GO:0035751) |
| 0.0 | 0.1 | GO:0000447 | endonucleolytic cleavage in ITS1 to separate SSU-rRNA from 5.8S rRNA and LSU-rRNA from tricistronic rRNA transcript (SSU-rRNA, 5.8S rRNA, LSU-rRNA)(GO:0000447) |
| 0.0 | 0.1 | GO:0010587 | miRNA catabolic process(GO:0010587) |
| 0.0 | 0.0 | GO:0072344 | rescue of stalled ribosome(GO:0072344) |
| 0.0 | 0.1 | GO:0033564 | anterior/posterior axon guidance(GO:0033564) |
| 0.0 | 0.2 | GO:0006108 | malate metabolic process(GO:0006108) |
| 0.0 | 0.1 | GO:0016240 | autophagosome docking(GO:0016240) |
| 0.0 | 0.1 | GO:0006336 | DNA replication-independent nucleosome assembly(GO:0006336) |
| 0.0 | 0.0 | GO:2000106 | regulation of T cell apoptotic process(GO:0070232) regulation of leukocyte apoptotic process(GO:2000106) |
| 0.0 | 0.0 | GO:0098828 | positive regulation of inhibitory postsynaptic potential(GO:0097151) modulation of inhibitory postsynaptic potential(GO:0098828) |
| 0.0 | 0.1 | GO:0006526 | arginine biosynthetic process(GO:0006526) |
| 0.0 | 0.0 | GO:1902595 | regulation of DNA replication origin binding(GO:1902595) |
| 0.0 | 0.1 | GO:0019236 | response to pheromone(GO:0019236) |
| 0.0 | 0.1 | GO:0070272 | proton-transporting ATP synthase complex assembly(GO:0043461) proton-transporting ATP synthase complex biogenesis(GO:0070272) |
| 0.0 | 0.1 | GO:0000479 | endonucleolytic cleavage of tricistronic rRNA transcript (SSU-rRNA, 5.8S rRNA, LSU-rRNA)(GO:0000479) |
| 0.0 | 0.1 | GO:0032055 | negative regulation of translation in response to stress(GO:0032055) |
| 0.0 | 0.1 | GO:0018230 | peptidyl-L-cysteine S-palmitoylation(GO:0018230) peptidyl-S-diacylglycerol-L-cysteine biosynthetic process from peptidyl-cysteine(GO:0018231) |
| 0.0 | 0.2 | GO:0000244 | spliceosomal tri-snRNP complex assembly(GO:0000244) |
| 0.0 | 0.1 | GO:0007296 | vitellogenesis(GO:0007296) |
| 0.0 | 0.1 | GO:2000504 | positive regulation of blood vessel remodeling(GO:2000504) |
| 0.0 | 0.1 | GO:0031119 | tRNA pseudouridine synthesis(GO:0031119) |
| 0.0 | 0.2 | GO:0033299 | secretion of lysosomal enzymes(GO:0033299) |
| 0.0 | 1.3 | GO:0070125 | mitochondrial translational elongation(GO:0070125) |
| 0.0 | 0.2 | GO:0045023 | G0 to G1 transition(GO:0045023) |
| 0.0 | 0.1 | GO:0019242 | methylglyoxal biosynthetic process(GO:0019242) |
| 0.0 | 0.1 | GO:1902902 | negative regulation of autophagosome assembly(GO:1902902) |
| 0.0 | 0.4 | GO:0000154 | rRNA modification(GO:0000154) |
| 0.0 | 0.1 | GO:0006741 | NADP biosynthetic process(GO:0006741) |
| 0.0 | 0.0 | GO:0032707 | negative regulation of interleukin-23 production(GO:0032707) |
| 0.0 | 0.1 | GO:0045602 | negative regulation of endothelial cell differentiation(GO:0045602) |
| 0.0 | 0.0 | GO:0031548 | regulation of brain-derived neurotrophic factor receptor signaling pathway(GO:0031548) |
| 0.0 | 0.1 | GO:0015808 | L-alanine transport(GO:0015808) |
| 0.0 | 0.2 | GO:2000427 | positive regulation of apoptotic cell clearance(GO:2000427) |
Gene overrepresentation in cellular_component category:
| Log-likelihood per target | Total log-likelihood | Term | Description |
|---|---|---|---|
| 0.4 | 3.2 | GO:0097129 | cyclin D2-CDK4 complex(GO:0097129) |
| 0.1 | 0.2 | GO:0042565 | RNA nuclear export complex(GO:0042565) |
| 0.1 | 0.4 | GO:1990131 | Gtr1-Gtr2 GTPase complex(GO:1990131) |
| 0.1 | 0.4 | GO:0031428 | box C/D snoRNP complex(GO:0031428) |
| 0.1 | 0.5 | GO:0070876 | SOSS complex(GO:0070876) |
| 0.1 | 0.2 | GO:0097543 | ciliary inversin compartment(GO:0097543) |
| 0.1 | 0.2 | GO:0043614 | multi-eIF complex(GO:0043614) |
| 0.0 | 0.2 | GO:0097135 | cyclin E2-CDK2 complex(GO:0097135) |
| 0.0 | 0.1 | GO:0009346 | citrate lyase complex(GO:0009346) |
| 0.0 | 1.0 | GO:0005671 | Ada2/Gcn5/Ada3 transcription activator complex(GO:0005671) |
| 0.0 | 0.2 | GO:0016533 | cyclin-dependent protein kinase 5 holoenzyme complex(GO:0016533) |
| 0.0 | 0.3 | GO:0009331 | glycerol-3-phosphate dehydrogenase complex(GO:0009331) |
| 0.0 | 0.2 | GO:0048476 | Holliday junction resolvase complex(GO:0048476) |
| 0.0 | 0.6 | GO:0000124 | SAGA complex(GO:0000124) |
| 0.0 | 0.6 | GO:0000276 | mitochondrial proton-transporting ATP synthase complex, coupling factor F(o)(GO:0000276) |
| 0.0 | 0.2 | GO:0002169 | 3-methylcrotonyl-CoA carboxylase complex, mitochondrial(GO:0002169) methylcrotonoyl-CoA carboxylase complex(GO:1905202) |
| 0.0 | 0.2 | GO:0005658 | alpha DNA polymerase:primase complex(GO:0005658) |
| 0.0 | 0.2 | GO:0098575 | lumenal side of lysosomal membrane(GO:0098575) |
| 0.0 | 0.1 | GO:0033186 | CAF-1 complex(GO:0033186) |
| 0.0 | 0.4 | GO:0005641 | nuclear envelope lumen(GO:0005641) |
| 0.0 | 0.2 | GO:0070847 | core mediator complex(GO:0070847) |
| 0.0 | 0.1 | GO:0071817 | MMXD complex(GO:0071817) |
| 0.0 | 0.0 | GO:0034448 | EGO complex(GO:0034448) |
| 0.0 | 0.2 | GO:0016272 | prefoldin complex(GO:0016272) |
| 0.0 | 0.2 | GO:0005797 | Golgi medial cisterna(GO:0005797) |
| 0.0 | 0.4 | GO:0033391 | chromatoid body(GO:0033391) |
| 0.0 | 0.4 | GO:0008250 | oligosaccharyltransferase complex(GO:0008250) |
| 0.0 | 0.1 | GO:0070044 | synaptobrevin 2-SNAP-25-syntaxin-1a complex(GO:0070044) |
| 0.0 | 0.5 | GO:0016281 | eukaryotic translation initiation factor 4F complex(GO:0016281) |
| 0.0 | 0.8 | GO:0016581 | NuRD complex(GO:0016581) CHD-type complex(GO:0090545) |
| 0.0 | 0.1 | GO:0005694 | chromosome(GO:0005694) |
| 0.0 | 0.9 | GO:0090544 | BAF-type complex(GO:0090544) |
| 0.0 | 1.2 | GO:0005790 | smooth endoplasmic reticulum(GO:0005790) |
| 0.0 | 0.1 | GO:0030689 | Noc complex(GO:0030689) |
| 0.0 | 0.1 | GO:0089701 | U2AF(GO:0089701) |
| 0.0 | 0.1 | GO:0031674 | I band(GO:0031674) |
| 0.0 | 0.8 | GO:0044665 | MLL1/2 complex(GO:0044665) MLL1 complex(GO:0071339) |
| 0.0 | 0.0 | GO:0019034 | viral replication complex(GO:0019034) |
| 0.0 | 0.3 | GO:0061700 | GATOR2 complex(GO:0061700) |
| 0.0 | 0.1 | GO:0031205 | endoplasmic reticulum Sec complex(GO:0031205) |
| 0.0 | 0.1 | GO:0033596 | TSC1-TSC2 complex(GO:0033596) |
| 0.0 | 0.1 | GO:0005606 | laminin-1 complex(GO:0005606) laminin-11 complex(GO:0043260) |
| 0.0 | 0.1 | GO:0070381 | endosome to plasma membrane transport vesicle(GO:0070381) |
| 0.0 | 0.1 | GO:0044611 | nuclear pore inner ring(GO:0044611) |
| 0.0 | 1.1 | GO:0005762 | organellar large ribosomal subunit(GO:0000315) mitochondrial large ribosomal subunit(GO:0005762) |
| 0.0 | 0.5 | GO:1990124 | messenger ribonucleoprotein complex(GO:1990124) |
| 0.0 | 0.1 | GO:0034751 | aryl hydrocarbon receptor complex(GO:0034751) |
| 0.0 | 0.1 | GO:0044326 | dendritic spine neck(GO:0044326) |
| 0.0 | 0.1 | GO:0030121 | AP-1 adaptor complex(GO:0030121) |
| 0.0 | 0.1 | GO:1990635 | proximal dendrite(GO:1990635) |
| 0.0 | 0.1 | GO:0071541 | eukaryotic translation initiation factor 3 complex, eIF3m(GO:0071541) |
| 0.0 | 0.3 | GO:0097227 | sperm annulus(GO:0097227) |
| 0.0 | 0.1 | GO:0000439 | core TFIIH complex(GO:0000439) |
| 0.0 | 0.0 | GO:0036398 | TCR signalosome(GO:0036398) |
| 0.0 | 0.1 | GO:0030688 | preribosome, small subunit precursor(GO:0030688) |
| 0.0 | 0.1 | GO:0020016 | ciliary pocket(GO:0020016) ciliary pocket membrane(GO:0020018) |
| 0.0 | 0.1 | GO:0035838 | growing cell tip(GO:0035838) |
| 0.0 | 0.1 | GO:1990037 | Lewy body core(GO:1990037) |
| 0.0 | 0.1 | GO:0000333 | telomerase catalytic core complex(GO:0000333) |
| 0.0 | 0.0 | GO:0032937 | SREBP-SCAP-Insig complex(GO:0032937) |
| 0.0 | 0.3 | GO:0005666 | DNA-directed RNA polymerase III complex(GO:0005666) |
| 0.0 | 0.1 | GO:0033553 | rDNA heterochromatin(GO:0033553) |
| 0.0 | 0.1 | GO:0000408 | EKC/KEOPS complex(GO:0000408) |
| 0.0 | 0.3 | GO:0005922 | connexon complex(GO:0005922) |
| 0.0 | 0.2 | GO:0005853 | eukaryotic translation elongation factor 1 complex(GO:0005853) |
| 0.0 | 0.1 | GO:0046696 | lipopolysaccharide receptor complex(GO:0046696) |
| 0.0 | 0.2 | GO:0005869 | dynactin complex(GO:0005869) |
| 0.0 | 0.1 | GO:0043196 | varicosity(GO:0043196) |
| 0.0 | 0.0 | GO:0009330 | DNA topoisomerase complex (ATP-hydrolyzing)(GO:0009330) |
| 0.0 | 0.0 | GO:0044530 | supraspliceosomal complex(GO:0044530) |
| 0.0 | 0.1 | GO:0001673 | male germ cell nucleus(GO:0001673) |
Gene overrepresentation in molecular_function category:
| Log-likelihood per target | Total log-likelihood | Term | Description |
|---|---|---|---|
| 0.1 | 0.6 | GO:0004489 | methylenetetrahydrofolate reductase (NAD(P)H) activity(GO:0004489) |
| 0.1 | 0.3 | GO:0030158 | protein xylosyltransferase activity(GO:0030158) |
| 0.1 | 0.3 | GO:0004367 | glycerol-3-phosphate dehydrogenase [NAD+] activity(GO:0004367) |
| 0.1 | 0.2 | GO:0090631 | pre-miRNA transporter activity(GO:0090631) |
| 0.1 | 0.6 | GO:0044547 | DNA topoisomerase binding(GO:0044547) |
| 0.1 | 0.2 | GO:0061752 | telomeric repeat-containing RNA binding(GO:0061752) |
| 0.1 | 3.5 | GO:0016538 | cyclin-dependent protein serine/threonine kinase regulator activity(GO:0016538) |
| 0.1 | 0.2 | GO:0050252 | retinol O-fatty-acyltransferase activity(GO:0050252) |
| 0.1 | 0.2 | GO:0016534 | cyclin-dependent protein kinase 5 activator activity(GO:0016534) |
| 0.1 | 0.2 | GO:0016635 | oxidoreductase activity, acting on the CH-CH group of donors, quinone or related compound as acceptor(GO:0016635) |
| 0.0 | 0.2 | GO:0034584 | piRNA binding(GO:0034584) |
| 0.0 | 0.1 | GO:0043849 | Ras palmitoyltransferase activity(GO:0043849) |
| 0.0 | 0.1 | GO:0005010 | insulin-like growth factor-activated receptor activity(GO:0005010) |
| 0.0 | 0.3 | GO:0031871 | proteinase activated receptor binding(GO:0031871) |
| 0.0 | 0.1 | GO:0003878 | ATP citrate synthase activity(GO:0003878) |
| 0.0 | 0.1 | GO:0030984 | kininogen binding(GO:0030984) |
| 0.0 | 0.5 | GO:1990226 | histone methyltransferase binding(GO:1990226) |
| 0.0 | 0.1 | GO:0004487 | methylenetetrahydrofolate dehydrogenase (NAD+) activity(GO:0004487) |
| 0.0 | 0.2 | GO:1990050 | phosphatidic acid transporter activity(GO:1990050) |
| 0.0 | 0.3 | GO:0019238 | cyclohydrolase activity(GO:0019238) |
| 0.0 | 0.1 | GO:0005055 | laminin receptor activity(GO:0005055) |
| 0.0 | 0.1 | GO:0098770 | FBXO family protein binding(GO:0098770) |
| 0.0 | 0.2 | GO:0055104 | ligase inhibitor activity(GO:0055104) ubiquitin ligase inhibitor activity(GO:1990948) |
| 0.0 | 0.7 | GO:0061578 | Lys63-specific deubiquitinase activity(GO:0061578) |
| 0.0 | 0.2 | GO:0042799 | histone methyltransferase activity (H4-K20 specific)(GO:0042799) |
| 0.0 | 0.2 | GO:0004485 | methylcrotonoyl-CoA carboxylase activity(GO:0004485) |
| 0.0 | 0.1 | GO:0097158 | pre-mRNA intronic pyrimidine-rich binding(GO:0097158) |
| 0.0 | 0.2 | GO:0019776 | Atg8 ligase activity(GO:0019776) |
| 0.0 | 0.1 | GO:0003943 | N-acetylgalactosamine-4-sulfatase activity(GO:0003943) |
| 0.0 | 0.3 | GO:0003835 | beta-galactoside alpha-2,6-sialyltransferase activity(GO:0003835) |
| 0.0 | 0.2 | GO:0086020 | gap junction channel activity involved in SA node cell-atrial cardiac muscle cell electrical coupling(GO:0086020) |
| 0.0 | 0.2 | GO:0016936 | galactoside binding(GO:0016936) |
| 0.0 | 0.1 | GO:0005483 | soluble NSF attachment protein activity(GO:0005483) |
| 0.0 | 0.8 | GO:0003756 | protein disulfide isomerase activity(GO:0003756) intramolecular oxidoreductase activity, transposing S-S bonds(GO:0016864) |
| 0.0 | 0.1 | GO:0061711 | N(6)-L-threonylcarbamoyladenine synthase(GO:0061711) |
| 0.0 | 0.1 | GO:0051500 | D-aminoacyl-tRNA deacylase activity(GO:0051499) D-tyrosyl-tRNA(Tyr) deacylase activity(GO:0051500) |
| 0.0 | 0.4 | GO:0008097 | 5S rRNA binding(GO:0008097) |
| 0.0 | 0.1 | GO:0017130 | poly(C) RNA binding(GO:0017130) |
| 0.0 | 0.1 | GO:0004766 | spermidine synthase activity(GO:0004766) |
| 0.0 | 0.1 | GO:0004616 | phosphogluconate dehydrogenase (decarboxylating) activity(GO:0004616) |
| 0.0 | 0.3 | GO:0022841 | potassium ion leak channel activity(GO:0022841) |
| 0.0 | 0.1 | GO:0033858 | N-acetylgalactosamine kinase activity(GO:0033858) |
| 0.0 | 0.1 | GO:0008309 | double-stranded DNA exodeoxyribonuclease activity(GO:0008309) |
| 0.0 | 0.2 | GO:0004459 | L-lactate dehydrogenase activity(GO:0004459) |
| 0.0 | 0.2 | GO:0015315 | hexose phosphate transmembrane transporter activity(GO:0015119) organophosphate:inorganic phosphate antiporter activity(GO:0015315) hexose-phosphate:inorganic phosphate antiporter activity(GO:0015526) glucose 6-phosphate:inorganic phosphate antiporter activity(GO:0061513) |
| 0.0 | 0.1 | GO:0016503 | pheromone receptor activity(GO:0016503) |
| 0.0 | 0.2 | GO:0008379 | thioredoxin peroxidase activity(GO:0008379) |
| 0.0 | 0.2 | GO:0046790 | virion binding(GO:0046790) |
| 0.0 | 0.1 | GO:0070815 | peptidyl-lysine 5-dioxygenase activity(GO:0070815) |
| 0.0 | 0.3 | GO:0016861 | intramolecular oxidoreductase activity, interconverting aldoses and ketoses(GO:0016861) |
| 0.0 | 0.1 | GO:0035500 | MH2 domain binding(GO:0035500) |
| 0.0 | 0.1 | GO:0004995 | tachykinin receptor activity(GO:0004995) |
| 0.0 | 0.4 | GO:0008179 | adenylate cyclase binding(GO:0008179) |
| 0.0 | 0.1 | GO:0005260 | channel-conductance-controlling ATPase activity(GO:0005260) |
| 0.0 | 0.1 | GO:0008841 | tetrahydrofolylpolyglutamate synthase activity(GO:0004326) dihydrofolate synthase activity(GO:0008841) |
| 0.0 | 0.2 | GO:0070087 | chromo shadow domain binding(GO:0070087) |
| 0.0 | 0.2 | GO:0008273 | calcium, potassium:sodium antiporter activity(GO:0008273) |
| 0.0 | 0.6 | GO:0046933 | proton-transporting ATP synthase activity, rotational mechanism(GO:0046933) |
| 0.0 | 0.8 | GO:0017147 | Wnt-protein binding(GO:0017147) |
| 0.0 | 0.1 | GO:0016997 | exo-alpha-sialidase activity(GO:0004308) alpha-sialidase activity(GO:0016997) |
| 0.0 | 0.1 | GO:0008515 | sucrose:proton symporter activity(GO:0008506) sucrose transmembrane transporter activity(GO:0008515) disaccharide transmembrane transporter activity(GO:0015154) oligosaccharide transmembrane transporter activity(GO:0015157) |
| 0.0 | 0.2 | GO:0022858 | L-alanine transmembrane transporter activity(GO:0015180) alanine transmembrane transporter activity(GO:0022858) |
| 0.0 | 0.2 | GO:0008568 | microtubule-severing ATPase activity(GO:0008568) |
| 0.0 | 0.4 | GO:0051864 | histone demethylase activity (H3-K36 specific)(GO:0051864) |
| 0.0 | 0.3 | GO:0015037 | peptide disulfide oxidoreductase activity(GO:0015037) |
| 0.0 | 0.1 | GO:0071253 | connexin binding(GO:0071253) |
| 0.0 | 0.2 | GO:0008821 | crossover junction endodeoxyribonuclease activity(GO:0008821) |
| 0.0 | 0.1 | GO:0004530 | deoxyribonuclease I activity(GO:0004530) |
| 0.0 | 0.1 | GO:0004957 | prostaglandin E receptor activity(GO:0004957) |
| 0.0 | 0.3 | GO:0005537 | mannose binding(GO:0005537) |
| 0.0 | 0.2 | GO:0102337 | fatty acid elongase activity(GO:0009922) 3-oxo-arachidoyl-CoA synthase activity(GO:0102336) 3-oxo-cerotoyl-CoA synthase activity(GO:0102337) 3-oxo-lignoceronyl-CoA synthase activity(GO:0102338) |
| 0.0 | 0.1 | GO:0034186 | apolipoprotein A-I binding(GO:0034186) |
| 0.0 | 0.2 | GO:0060002 | plus-end directed microfilament motor activity(GO:0060002) |
| 0.0 | 0.0 | GO:0051185 | coenzyme transporter activity(GO:0051185) |
| 0.0 | 0.1 | GO:0097157 | pre-mRNA intronic binding(GO:0097157) |
| 0.0 | 0.0 | GO:0004667 | prostaglandin-D synthase activity(GO:0004667) |
| 0.0 | 0.2 | GO:0005176 | ErbB-2 class receptor binding(GO:0005176) |
| 0.0 | 0.0 | GO:0030550 | acetylcholine receptor inhibitor activity(GO:0030550) |
| 0.0 | 0.1 | GO:0008424 | glycoprotein 6-alpha-L-fucosyltransferase activity(GO:0008424) alpha-(1->6)-fucosyltransferase activity(GO:0046921) |
| 0.0 | 0.1 | GO:0070182 | DNA polymerase binding(GO:0070182) |
| 0.0 | 0.1 | GO:0047860 | diiodophenylpyruvate reductase activity(GO:0047860) |
| 0.0 | 0.0 | GO:0008427 | calcium-dependent protein kinase inhibitor activity(GO:0008427) |
| 0.0 | 0.1 | GO:0005017 | platelet-derived growth factor-activated receptor activity(GO:0005017) |
| 0.0 | 0.5 | GO:0005527 | macrolide binding(GO:0005527) FK506 binding(GO:0005528) |
| 0.0 | 0.0 | GO:0004103 | choline kinase activity(GO:0004103) |
| 0.0 | 0.1 | GO:0008321 | Ral guanyl-nucleotide exchange factor activity(GO:0008321) |
| 0.0 | 0.3 | GO:0001075 | transcription factor activity, RNA polymerase II core promoter sequence-specific binding involved in preinitiation complex assembly(GO:0001075) |
| 0.0 | 0.0 | GO:0070538 | oleic acid binding(GO:0070538) |
| 0.0 | 0.1 | GO:0038052 | RNA polymerase II transcription factor activity, estrogen-activated sequence-specific DNA binding(GO:0038052) |
| 0.0 | 0.1 | GO:0070051 | fibrinogen binding(GO:0070051) |
| 0.0 | 0.0 | GO:0016520 | growth hormone-releasing hormone receptor activity(GO:0016520) |
| 0.0 | 0.2 | GO:0070569 | uridylyltransferase activity(GO:0070569) |
| 0.0 | 0.0 | GO:0046964 | 3'-phosphoadenosine 5'-phosphosulfate transmembrane transporter activity(GO:0046964) |
| 0.0 | 0.0 | GO:0071558 | histone demethylase activity (H3-K27 specific)(GO:0071558) |
| 0.0 | 0.1 | GO:0030628 | pre-mRNA 3'-splice site binding(GO:0030628) |
| 0.0 | 0.2 | GO:0070700 | BMP receptor binding(GO:0070700) |
| 0.0 | 0.1 | GO:0035651 | AP-3 adaptor complex binding(GO:0035651) |
| 0.0 | 0.1 | GO:0008378 | galactosyltransferase activity(GO:0008378) |
| 0.0 | 0.1 | GO:0008384 | IkappaB kinase activity(GO:0008384) |
| 0.0 | 0.7 | GO:0031492 | nucleosomal DNA binding(GO:0031492) |
| 0.0 | 0.1 | GO:0016618 | hydroxypyruvate reductase activity(GO:0016618) glyoxylate reductase (NADP) activity(GO:0030267) |
| 0.0 | 0.0 | GO:0004772 | sterol O-acyltransferase activity(GO:0004772) cholesterol O-acyltransferase activity(GO:0034736) |
| 0.0 | 0.1 | GO:0055131 | C3HC4-type RING finger domain binding(GO:0055131) |
| 0.0 | 0.1 | GO:0004563 | beta-N-acetylhexosaminidase activity(GO:0004563) |
| 0.0 | 0.0 | GO:1904315 | neurotransmitter receptor activity involved in regulation of postsynaptic membrane potential(GO:0099529) transmitter-gated ion channel activity involved in regulation of postsynaptic membrane potential(GO:1904315) |
| 0.0 | 0.1 | GO:0004473 | malic enzyme activity(GO:0004470) malate dehydrogenase (decarboxylating) (NAD+) activity(GO:0004471) malate dehydrogenase (decarboxylating) (NADP+) activity(GO:0004473) |
| 0.0 | 0.1 | GO:0019834 | phospholipase A2 inhibitor activity(GO:0019834) |
| 0.0 | 0.2 | GO:0046527 | glucosyltransferase activity(GO:0046527) |
| 0.0 | 0.5 | GO:0070577 | lysine-acetylated histone binding(GO:0070577) |
| 0.0 | 0.0 | GO:0004608 | phosphatidyl-N-methylethanolamine N-methyltransferase activity(GO:0000773) phosphatidylethanolamine N-methyltransferase activity(GO:0004608) phosphatidyl-N-dimethylethanolamine N-methyltransferase activity(GO:0080101) |
| 0.0 | 0.1 | GO:0004594 | pantothenate kinase activity(GO:0004594) |
| 0.0 | 0.3 | GO:0005247 | voltage-gated chloride channel activity(GO:0005247) |
| 0.0 | 0.0 | GO:0010348 | lithium:proton antiporter activity(GO:0010348) |
| 0.0 | 0.4 | GO:0000983 | transcription factor activity, RNA polymerase II core promoter sequence-specific(GO:0000983) |
| 0.0 | 0.1 | GO:0070740 | tubulin-glutamic acid ligase activity(GO:0070740) |
| 0.0 | 0.1 | GO:0005243 | gap junction channel activity(GO:0005243) |
| 0.0 | 0.2 | GO:0008353 | RNA polymerase II carboxy-terminal domain kinase activity(GO:0008353) |
| 0.0 | 0.1 | GO:0004883 | glucocorticoid receptor activity(GO:0004883) glucocorticoid-activated RNA polymerase II transcription factor binding transcription factor activity(GO:0038051) |
| 0.0 | 1.1 | GO:0004004 | ATP-dependent RNA helicase activity(GO:0004004) |
| 0.0 | 0.0 | GO:0070180 | large ribosomal subunit rRNA binding(GO:0070180) |
| 0.0 | 0.1 | GO:0031386 | protein tag(GO:0031386) |
| 0.0 | 0.2 | GO:0050291 | sphingosine N-acyltransferase activity(GO:0050291) |
| 0.0 | 0.0 | GO:0019828 | glyceraldehyde-3-phosphate dehydrogenase (NAD+) (phosphorylating) activity(GO:0004365) aspartic-type endopeptidase inhibitor activity(GO:0019828) glyceraldehyde-3-phosphate dehydrogenase (NAD(P)+) (phosphorylating) activity(GO:0043891) |
| 0.0 | 0.0 | GO:0004967 | glucagon receptor activity(GO:0004967) |
| 0.0 | 0.3 | GO:0001056 | RNA polymerase III activity(GO:0001056) |
| 0.0 | 0.1 | GO:0044769 | ATPase activity, coupled to transmembrane movement of ions, rotational mechanism(GO:0044769) |
| 0.0 | 0.1 | GO:0035613 | RNA stem-loop binding(GO:0035613) |
| 0.0 | 0.0 | GO:0003726 | double-stranded RNA adenosine deaminase activity(GO:0003726) |
Gene overrepresentation in C2:CP category:
| Log-likelihood per target | Total log-likelihood | Term | Description |
|---|---|---|---|
| 0.1 | 3.3 | SA REG CASCADE OF CYCLIN EXPR | Expression of cyclins regulates progression through the cell cycle by activating cyclin-dependent kinases. |
| 0.1 | 1.3 | PID P38 GAMMA DELTA PATHWAY | Signaling mediated by p38-gamma and p38-delta |
| 0.0 | 0.8 | PID WNT SIGNALING PATHWAY | Wnt signaling network |
| 0.0 | 0.9 | PID NFKAPPAB CANONICAL PATHWAY | Canonical NF-kappaB pathway |
| 0.0 | 0.7 | PID MYC PATHWAY | C-MYC pathway |
| 0.0 | 0.1 | PID IL12 2PATHWAY | IL12-mediated signaling events |
| 0.0 | 0.1 | PID ER NONGENOMIC PATHWAY | Plasma membrane estrogen receptor signaling |
Gene overrepresentation in C2:CP:REACTOME category:
| Log-likelihood per target | Total log-likelihood | Term | Description |
|---|---|---|---|
| 0.1 | 0.2 | REACTOME BINDING AND ENTRY OF HIV VIRION | Genes involved in Binding and entry of HIV virion |
| 0.0 | 3.3 | REACTOME G1 PHASE | Genes involved in G1 Phase |
| 0.0 | 0.2 | REACTOME INHIBITION OF REPLICATION INITIATION OF DAMAGED DNA BY RB1 E2F1 | Genes involved in Inhibition of replication initiation of damaged DNA by RB1/E2F1 |
| 0.0 | 0.8 | REACTOME METABOLISM OF POLYAMINES | Genes involved in Metabolism of polyamines |
| 0.0 | 0.6 | REACTOME FORMATION OF ATP BY CHEMIOSMOTIC COUPLING | Genes involved in Formation of ATP by chemiosmotic coupling |
| 0.0 | 0.0 | REACTOME FORMATION OF TUBULIN FOLDING INTERMEDIATES BY CCT TRIC | Genes involved in Formation of tubulin folding intermediates by CCT/TriC |
| 0.0 | 0.1 | REACTOME INTRINSIC PATHWAY | Genes involved in Intrinsic Pathway |
| 0.0 | 0.2 | REACTOME SEMA3A PAK DEPENDENT AXON REPULSION | Genes involved in Sema3A PAK dependent Axon repulsion |
| 0.0 | 0.3 | REACTOME GAP JUNCTION ASSEMBLY | Genes involved in Gap junction assembly |
| 0.0 | 0.1 | REACTOME PROSTANOID LIGAND RECEPTORS | Genes involved in Prostanoid ligand receptors |
| 0.0 | 0.8 | REACTOME NOD1 2 SIGNALING PATHWAY | Genes involved in NOD1/2 Signaling Pathway |
| 0.0 | 0.2 | REACTOME G1 S SPECIFIC TRANSCRIPTION | Genes involved in G1/S-Specific Transcription |
| 0.0 | 0.2 | REACTOME HIGHLY CALCIUM PERMEABLE POSTSYNAPTIC NICOTINIC ACETYLCHOLINE RECEPTORS | Genes involved in Highly calcium permeable postsynaptic nicotinic acetylcholine receptors |
| 0.0 | 0.5 | REACTOME RNA POL II TRANSCRIPTION PRE INITIATION AND PROMOTER OPENING | Genes involved in RNA Polymerase II Transcription Pre-Initiation And Promoter Opening |
| 0.0 | 0.2 | REACTOME MICRORNA MIRNA BIOGENESIS | Genes involved in MicroRNA (miRNA) Biogenesis |
| 0.0 | 0.4 | REACTOME ASSOCIATION OF TRIC CCT WITH TARGET PROTEINS DURING BIOSYNTHESIS | Genes involved in Association of TriC/CCT with target proteins during biosynthesis |
| 0.0 | 0.3 | REACTOME RNA POL III CHAIN ELONGATION | Genes involved in RNA Polymerase III Chain Elongation |