Project
NHBE cells infected with SARS-CoV-2 Analysis Results (GEO series: GSE147507)
Navigation
Downloads
Results for HLF_TEF
Z-value: 0.69
Motif logo
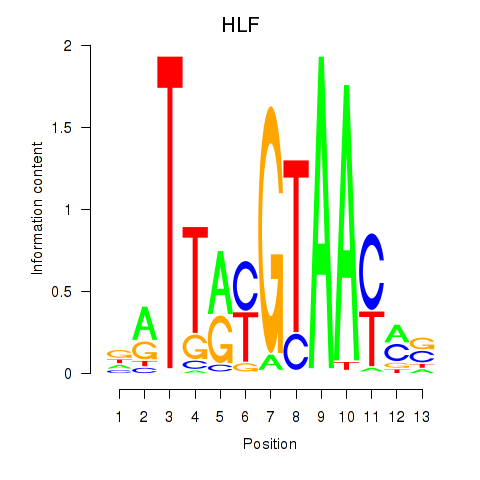
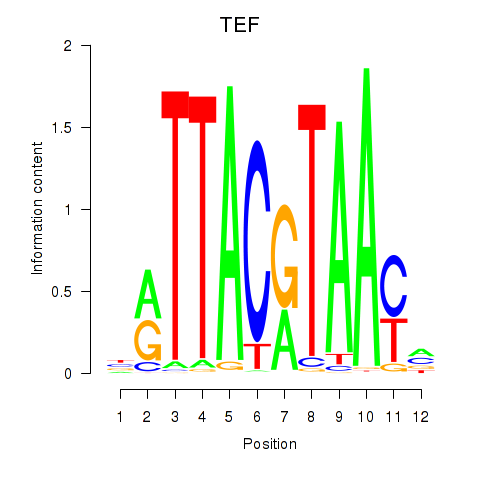
Transcription factors associated with HLF_TEF
| Gene Symbol | Gene ID | Gene Info |
|---|---|---|
|
HLF
|
ENSG00000108924.9 | HLF transcription factor, PAR bZIP family member |
|
TEF
|
ENSG00000167074.10 | TEF transcription factor, PAR bZIP family member |
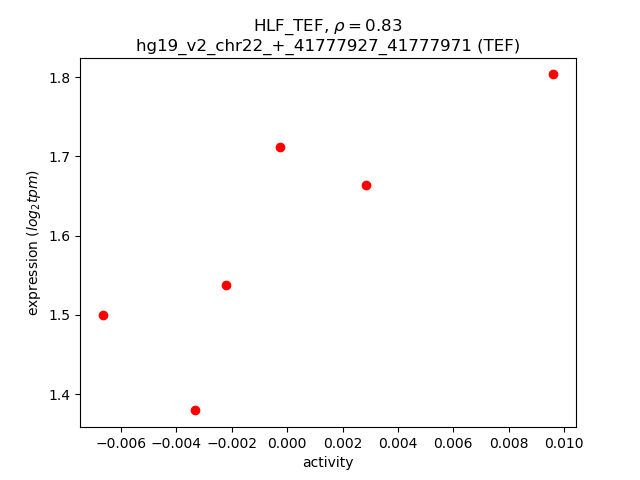
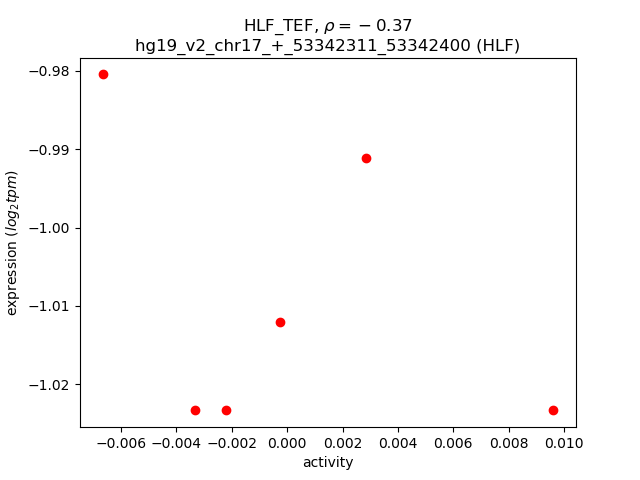
Activity-expression correlation:
| Gene | Promoter | Pearson corr. coef. | P-value | Plot |
|---|---|---|---|---|
| TEF | hg19_v2_chr22_+_41777927_41777971 | 0.83 | 4.2e-02 | Click! |
| HLF | hg19_v2_chr17_+_53342311_53342400 | -0.37 | 4.7e-01 | Click! |
Activity profile of HLF_TEF motif
Sorted Z-values of HLF_TEF motif
| Promoter | Log-likelihood | Transcript | Gene | Gene Info |
|---|---|---|---|---|
| chr1_+_7844312 | 0.70 |
ENST00000377541.1
|
PER3
|
period circadian clock 3 |
| chr4_+_104346194 | 0.66 |
ENST00000510200.1
|
RP11-328K4.1
|
RP11-328K4.1 |
| chr1_+_154378049 | 0.52 |
ENST00000512471.1
|
IL6R
|
interleukin 6 receptor |
| chr1_+_154377669 | 0.50 |
ENST00000368485.3
ENST00000344086.4 |
IL6R
|
interleukin 6 receptor |
| chr12_-_46121554 | 0.48 |
ENST00000609803.1
|
LINC00938
|
long intergenic non-protein coding RNA 938 |
| chr3_-_158390282 | 0.46 |
ENST00000264265.3
|
LXN
|
latexin |
| chr8_-_27469383 | 0.43 |
ENST00000519742.1
|
CLU
|
clusterin |
| chr4_-_153274078 | 0.36 |
ENST00000263981.5
|
FBXW7
|
F-box and WD repeat domain containing 7, E3 ubiquitin protein ligase |
| chr8_-_27468717 | 0.35 |
ENST00000520796.1
ENST00000520491.1 |
CLU
|
clusterin |
| chr8_-_102217515 | 0.35 |
ENST00000520347.1
ENST00000523922.1 ENST00000520984.1 |
ZNF706
|
zinc finger protein 706 |
| chr8_-_102216925 | 0.34 |
ENST00000517844.1
|
ZNF706
|
zinc finger protein 706 |
| chr8_-_27469196 | 0.32 |
ENST00000546343.1
ENST00000560566.1 |
CLU
|
clusterin |
| chr8_+_110552337 | 0.31 |
ENST00000337573.5
|
EBAG9
|
estrogen receptor binding site associated, antigen, 9 |
| chr7_-_111428957 | 0.31 |
ENST00000417165.1
|
DOCK4
|
dedicator of cytokinesis 4 |
| chr3_+_88188254 | 0.28 |
ENST00000309495.5
|
ZNF654
|
zinc finger protein 654 |
| chr1_+_92632542 | 0.28 |
ENST00000409154.4
ENST00000370378.4 |
KIAA1107
|
KIAA1107 |
| chr13_-_29292956 | 0.28 |
ENST00000266943.6
|
SLC46A3
|
solute carrier family 46, member 3 |
| chr8_-_27468945 | 0.26 |
ENST00000405140.3
|
CLU
|
clusterin |
| chr8_-_27468842 | 0.26 |
ENST00000523500.1
|
CLU
|
clusterin |
| chr15_+_49913201 | 0.25 |
ENST00000329873.5
ENST00000558653.1 ENST00000559164.1 ENST00000560632.1 ENST00000559405.1 ENST00000251250.6 |
DTWD1
|
DTW domain containing 1 |
| chr9_-_130712995 | 0.25 |
ENST00000373084.4
|
FAM102A
|
family with sequence similarity 102, member A |
| chr17_-_19651654 | 0.24 |
ENST00000395555.3
|
ALDH3A1
|
aldehyde dehydrogenase 3 family, member A1 |
| chr3_+_195869379 | 0.23 |
ENST00000457079.1
|
LINC00885
|
long intergenic non-protein coding RNA 885 |
| chr7_+_90032667 | 0.23 |
ENST00000496677.1
ENST00000287916.4 ENST00000535571.1 ENST00000394604.1 ENST00000394605.2 |
CLDN12
|
claudin 12 |
| chr2_-_201936302 | 0.23 |
ENST00000453765.1
ENST00000452799.1 ENST00000446678.1 ENST00000418596.3 |
FAM126B
|
family with sequence similarity 126, member B |
| chr1_-_244013384 | 0.22 |
ENST00000366539.1
|
AKT3
|
v-akt murine thymoma viral oncogene homolog 3 |
| chr14_+_67708344 | 0.21 |
ENST00000557237.1
|
MPP5
|
membrane protein, palmitoylated 5 (MAGUK p55 subfamily member 5) |
| chr7_+_23146271 | 0.21 |
ENST00000545771.1
|
KLHL7
|
kelch-like family member 7 |
| chr19_+_52076425 | 0.21 |
ENST00000436511.2
|
ZNF175
|
zinc finger protein 175 |
| chr8_-_102217796 | 0.21 |
ENST00000519744.1
ENST00000311212.4 ENST00000521272.1 ENST00000519882.1 |
ZNF706
|
zinc finger protein 706 |
| chr1_-_226496772 | 0.21 |
ENST00000359525.2
ENST00000460719.1 |
LIN9
|
lin-9 homolog (C. elegans) |
| chr2_-_225362533 | 0.21 |
ENST00000451538.1
|
CUL3
|
cullin 3 |
| chr17_-_19651668 | 0.21 |
ENST00000494157.2
ENST00000225740.6 |
ALDH3A1
|
aldehyde dehydrogenase 3 family, member A1 |
| chr13_-_38172863 | 0.20 |
ENST00000541481.1
ENST00000379743.4 ENST00000379742.4 ENST00000379749.4 ENST00000541179.1 ENST00000379747.4 |
POSTN
|
periostin, osteoblast specific factor |
| chr18_+_21032781 | 0.18 |
ENST00000339486.3
|
RIOK3
|
RIO kinase 3 |
| chr20_+_4666882 | 0.18 |
ENST00000379440.4
ENST00000430350.2 |
PRNP
|
prion protein |
| chr2_-_214014959 | 0.18 |
ENST00000442445.1
ENST00000457361.1 ENST00000342002.2 |
IKZF2
|
IKAROS family zinc finger 2 (Helios) |
| chr2_+_191208601 | 0.18 |
ENST00000413239.1
ENST00000431594.1 ENST00000444194.1 |
INPP1
|
inositol polyphosphate-1-phosphatase |
| chr4_+_157997273 | 0.18 |
ENST00000541722.1
ENST00000512619.1 |
GLRB
|
glycine receptor, beta |
| chr12_-_120966943 | 0.18 |
ENST00000552443.1
ENST00000547736.1 ENST00000445328.2 ENST00000547943.1 ENST00000288532.6 |
COQ5
|
coenzyme Q5 homolog, methyltransferase (S. cerevisiae) |
| chr3_-_45883558 | 0.17 |
ENST00000445698.1
ENST00000296135.6 |
LZTFL1
|
leucine zipper transcription factor-like 1 |
| chr21_-_30365136 | 0.17 |
ENST00000361371.5
ENST00000389194.2 ENST00000389195.2 |
LTN1
|
listerin E3 ubiquitin protein ligase 1 |
| chr10_+_94050913 | 0.17 |
ENST00000358935.2
|
MARCH5
|
membrane-associated ring finger (C3HC4) 5 |
| chr2_+_191208656 | 0.17 |
ENST00000458647.1
|
INPP1
|
inositol polyphosphate-1-phosphatase |
| chr6_-_86353510 | 0.17 |
ENST00000444272.1
|
SYNCRIP
|
synaptotagmin binding, cytoplasmic RNA interacting protein |
| chr1_+_144989309 | 0.16 |
ENST00000596396.1
|
AL590452.1
|
Uncharacterized protein |
| chr8_+_110552831 | 0.16 |
ENST00000530629.1
|
EBAG9
|
estrogen receptor binding site associated, antigen, 9 |
| chr17_+_73089382 | 0.16 |
ENST00000538213.2
ENST00000584118.1 |
SLC16A5
|
solute carrier family 16 (monocarboxylate transporter), member 5 |
| chr5_-_111091948 | 0.16 |
ENST00000447165.2
|
NREP
|
neuronal regeneration related protein |
| chr17_-_61850894 | 0.16 |
ENST00000403162.3
ENST00000582252.1 ENST00000225726.5 |
CCDC47
|
coiled-coil domain containing 47 |
| chr21_+_35107346 | 0.16 |
ENST00000456489.1
|
ITSN1
|
intersectin 1 (SH3 domain protein) |
| chr3_+_101504200 | 0.15 |
ENST00000422132.1
|
NXPE3
|
neurexophilin and PC-esterase domain family, member 3 |
| chr2_+_46769798 | 0.15 |
ENST00000238738.4
|
RHOQ
|
ras homolog family member Q |
| chr2_+_191208791 | 0.15 |
ENST00000423767.1
ENST00000451089.1 |
INPP1
|
inositol polyphosphate-1-phosphatase |
| chr8_+_42396936 | 0.15 |
ENST00000416469.2
|
SMIM19
|
small integral membrane protein 19 |
| chr10_+_86004802 | 0.15 |
ENST00000359452.4
ENST00000358110.5 ENST00000372092.3 |
RGR
|
retinal G protein coupled receptor |
| chr2_+_183989157 | 0.14 |
ENST00000541912.1
|
NUP35
|
nucleoporin 35kDa |
| chr2_+_65663812 | 0.14 |
ENST00000606978.1
ENST00000377977.3 ENST00000536804.1 |
AC074391.1
|
AC074391.1 |
| chr21_+_35736302 | 0.14 |
ENST00000290310.3
|
KCNE2
|
potassium voltage-gated channel, Isk-related family, member 2 |
| chr15_-_66084428 | 0.14 |
ENST00000443035.3
ENST00000431932.2 |
DENND4A
|
DENN/MADD domain containing 4A |
| chr14_+_75894391 | 0.13 |
ENST00000419727.2
|
JDP2
|
Jun dimerization protein 2 |
| chr3_+_154797877 | 0.13 |
ENST00000462745.1
ENST00000493237.1 |
MME
|
membrane metallo-endopeptidase |
| chr11_+_105948216 | 0.13 |
ENST00000278618.4
|
AASDHPPT
|
aminoadipate-semialdehyde dehydrogenase-phosphopantetheinyl transferase |
| chr4_+_144257915 | 0.13 |
ENST00000262995.4
|
GAB1
|
GRB2-associated binding protein 1 |
| chr8_-_112248400 | 0.13 |
ENST00000519506.1
ENST00000522778.1 |
RP11-946L20.4
|
RP11-946L20.4 |
| chr19_-_41356347 | 0.12 |
ENST00000301141.5
|
CYP2A6
|
cytochrome P450, family 2, subfamily A, polypeptide 6 |
| chr7_+_23145884 | 0.12 |
ENST00000409689.1
ENST00000410047.1 |
KLHL7
|
kelch-like family member 7 |
| chr1_+_196621156 | 0.12 |
ENST00000359637.2
|
CFH
|
complement factor H |
| chr16_+_3508096 | 0.12 |
ENST00000577013.1
ENST00000570819.1 |
NAA60
|
N(alpha)-acetyltransferase 60, NatF catalytic subunit |
| chr5_-_140013275 | 0.12 |
ENST00000512545.1
ENST00000302014.6 ENST00000401743.2 |
CD14
|
CD14 molecule |
| chr11_-_33795893 | 0.12 |
ENST00000526785.1
ENST00000534136.1 ENST00000265651.3 ENST00000530401.1 ENST00000448981.2 |
FBXO3
|
F-box protein 3 |
| chr16_+_70680439 | 0.12 |
ENST00000288098.2
|
IL34
|
interleukin 34 |
| chr4_+_144258021 | 0.11 |
ENST00000262994.4
|
GAB1
|
GRB2-associated binding protein 1 |
| chr14_+_60716159 | 0.11 |
ENST00000325658.3
|
PPM1A
|
protein phosphatase, Mg2+/Mn2+ dependent, 1A |
| chr1_+_174933899 | 0.11 |
ENST00000367688.3
|
RABGAP1L
|
RAB GTPase activating protein 1-like |
| chr2_+_183989083 | 0.10 |
ENST00000295119.4
|
NUP35
|
nucleoporin 35kDa |
| chr10_-_65028817 | 0.10 |
ENST00000542921.1
|
JMJD1C
|
jumonji domain containing 1C |
| chr1_-_226496898 | 0.10 |
ENST00000481685.1
|
LIN9
|
lin-9 homolog (C. elegans) |
| chr10_-_65028938 | 0.10 |
ENST00000402544.1
|
JMJD1C
|
jumonji domain containing 1C |
| chr17_-_39538550 | 0.10 |
ENST00000394001.1
|
KRT34
|
keratin 34 |
| chr8_+_90914073 | 0.10 |
ENST00000297438.2
|
OSGIN2
|
oxidative stress induced growth inhibitor family member 2 |
| chr4_+_144258288 | 0.10 |
ENST00000514639.1
|
GAB1
|
GRB2-associated binding protein 1 |
| chr3_-_196910721 | 0.10 |
ENST00000443183.1
|
DLG1
|
discs, large homolog 1 (Drosophila) |
| chr22_-_50221160 | 0.10 |
ENST00000404760.1
|
BRD1
|
bromodomain containing 1 |
| chr3_+_182983126 | 0.10 |
ENST00000481531.1
|
B3GNT5
|
UDP-GlcNAc:betaGal beta-1,3-N-acetylglucosaminyltransferase 5 |
| chr5_+_95997918 | 0.10 |
ENST00000395812.2
ENST00000395813.1 ENST00000359176.4 ENST00000325674.7 |
CAST
|
calpastatin |
| chr5_+_172332220 | 0.10 |
ENST00000518247.1
ENST00000326654.2 |
ERGIC1
|
endoplasmic reticulum-golgi intermediate compartment (ERGIC) 1 |
| chr12_-_122017542 | 0.10 |
ENST00000446152.2
|
KDM2B
|
lysine (K)-specific demethylase 2B |
| chr4_+_48807155 | 0.10 |
ENST00000504654.1
|
OCIAD1
|
OCIA domain containing 1 |
| chr10_-_91295304 | 0.09 |
ENST00000341233.4
ENST00000371790.4 |
SLC16A12
|
solute carrier family 16, member 12 |
| chr1_-_167883327 | 0.09 |
ENST00000476818.2
ENST00000367851.4 ENST00000367848.1 |
ADCY10
|
adenylate cyclase 10 (soluble) |
| chr16_+_3508063 | 0.09 |
ENST00000576787.1
ENST00000572942.1 ENST00000576916.1 ENST00000575076.1 ENST00000572131.1 |
NAA60
|
N(alpha)-acetyltransferase 60, NatF catalytic subunit |
| chr8_-_103424986 | 0.09 |
ENST00000521922.1
|
UBR5
|
ubiquitin protein ligase E3 component n-recognin 5 |
| chr14_+_60715928 | 0.09 |
ENST00000395076.4
|
PPM1A
|
protein phosphatase, Mg2+/Mn2+ dependent, 1A |
| chr3_+_154798162 | 0.09 |
ENST00000360490.2
|
MME
|
membrane metallo-endopeptidase |
| chr1_-_247094628 | 0.09 |
ENST00000366508.1
ENST00000326225.3 ENST00000391829.2 |
AHCTF1
|
AT hook containing transcription factor 1 |
| chr8_+_94752349 | 0.09 |
ENST00000391680.1
|
RBM12B-AS1
|
RBM12B antisense RNA 1 |
| chr1_-_114430169 | 0.09 |
ENST00000393316.3
|
BCL2L15
|
BCL2-like 15 |
| chr1_-_161207986 | 0.09 |
ENST00000506209.1
ENST00000367980.2 |
NR1I3
|
nuclear receptor subfamily 1, group I, member 3 |
| chr11_-_62313090 | 0.09 |
ENST00000528508.1
ENST00000533365.1 |
AHNAK
|
AHNAK nucleoprotein |
| chr3_+_182983090 | 0.09 |
ENST00000465010.1
|
B3GNT5
|
UDP-GlcNAc:betaGal beta-1,3-N-acetylglucosaminyltransferase 5 |
| chr15_-_49255632 | 0.09 |
ENST00000332408.4
|
SHC4
|
SHC (Src homology 2 domain containing) family, member 4 |
| chr2_+_179184955 | 0.08 |
ENST00000315022.2
|
OSBPL6
|
oxysterol binding protein-like 6 |
| chr7_+_135347215 | 0.08 |
ENST00000507606.1
|
C7orf73
|
chromosome 7 open reading frame 73 |
| chr9_-_123639445 | 0.08 |
ENST00000312189.6
|
PHF19
|
PHD finger protein 19 |
| chr9_-_88356789 | 0.08 |
ENST00000357081.3
ENST00000376081.4 ENST00000337006.4 ENST00000376109.3 |
AGTPBP1
|
ATP/GTP binding protein 1 |
| chr8_-_103424916 | 0.08 |
ENST00000220959.4
|
UBR5
|
ubiquitin protein ligase E3 component n-recognin 5 |
| chr3_+_186383741 | 0.08 |
ENST00000232003.4
|
HRG
|
histidine-rich glycoprotein |
| chr19_-_2042065 | 0.08 |
ENST00000591588.1
ENST00000591142.1 |
MKNK2
|
MAP kinase interacting serine/threonine kinase 2 |
| chr5_-_179050066 | 0.07 |
ENST00000329433.6
ENST00000510411.1 |
HNRNPH1
|
heterogeneous nuclear ribonucleoprotein H1 (H) |
| chr7_+_120629653 | 0.07 |
ENST00000450913.2
ENST00000340646.5 |
CPED1
|
cadherin-like and PC-esterase domain containing 1 |
| chr2_+_198318217 | 0.07 |
ENST00000409398.1
|
COQ10B
|
coenzyme Q10 homolog B (S. cerevisiae) |
| chr5_+_95998070 | 0.07 |
ENST00000421689.2
ENST00000510756.1 ENST00000512620.1 |
CAST
|
calpastatin |
| chr10_-_82049424 | 0.07 |
ENST00000372213.3
|
MAT1A
|
methionine adenosyltransferase I, alpha |
| chr9_-_123639600 | 0.07 |
ENST00000373896.3
|
PHF19
|
PHD finger protein 19 |
| chr2_-_207078154 | 0.07 |
ENST00000447845.1
|
GPR1
|
G protein-coupled receptor 1 |
| chr11_+_123986069 | 0.07 |
ENST00000456829.2
ENST00000361352.5 ENST00000449321.1 ENST00000392748.1 ENST00000360334.4 ENST00000392744.4 |
VWA5A
|
von Willebrand factor A domain containing 5A |
| chr2_+_103378472 | 0.07 |
ENST00000412401.2
|
TMEM182
|
transmembrane protein 182 |
| chr8_-_103425047 | 0.07 |
ENST00000520539.1
|
UBR5
|
ubiquitin protein ligase E3 component n-recognin 5 |
| chr13_-_45010939 | 0.06 |
ENST00000261489.2
|
TSC22D1
|
TSC22 domain family, member 1 |
| chr5_+_12574944 | 0.06 |
ENST00000505877.1
ENST00000513051.1 ENST00000505196.1 |
CT49
|
cancer/testis antigen 49 (non-protein coding) |
| chr4_-_65275162 | 0.06 |
ENST00000381210.3
ENST00000507440.1 |
TECRL
|
trans-2,3-enoyl-CoA reductase-like |
| chr11_-_105948129 | 0.06 |
ENST00000526793.1
|
KBTBD3
|
kelch repeat and BTB (POZ) domain containing 3 |
| chr20_-_49547910 | 0.06 |
ENST00000396032.3
|
ADNP
|
activity-dependent neuroprotector homeobox |
| chr3_+_62304648 | 0.06 |
ENST00000462069.1
ENST00000232519.5 ENST00000465142.1 |
C3orf14
|
chromosome 3 open reading frame 14 |
| chr5_-_54830871 | 0.06 |
ENST00000307259.8
|
PPAP2A
|
phosphatidic acid phosphatase type 2A |
| chr7_-_44887620 | 0.06 |
ENST00000349299.3
ENST00000521529.1 ENST00000308153.4 ENST00000350771.3 ENST00000222690.6 ENST00000381124.5 ENST00000437072.1 ENST00000446531.1 |
H2AFV
|
H2A histone family, member V |
| chr6_+_36238237 | 0.06 |
ENST00000457797.1
ENST00000394571.2 |
PNPLA1
|
patatin-like phospholipase domain containing 1 |
| chr3_-_196910477 | 0.06 |
ENST00000447466.1
|
DLG1
|
discs, large homolog 1 (Drosophila) |
| chr5_-_43557791 | 0.06 |
ENST00000338972.4
ENST00000511321.1 ENST00000515338.1 |
PAIP1
|
poly(A) binding protein interacting protein 1 |
| chr19_+_42254885 | 0.06 |
ENST00000595740.1
|
CEACAM6
|
carcinoembryonic antigen-related cell adhesion molecule 6 (non-specific cross reacting antigen) |
| chr8_+_70404996 | 0.05 |
ENST00000402687.4
ENST00000419716.3 |
SULF1
|
sulfatase 1 |
| chr2_-_100106419 | 0.05 |
ENST00000393445.3
ENST00000258428.3 |
REV1
|
REV1, polymerase (DNA directed) |
| chr18_-_55288973 | 0.05 |
ENST00000423481.2
ENST00000587194.1 ENST00000591599.1 ENST00000588661.1 |
NARS
|
asparaginyl-tRNA synthetase |
| chr1_-_101491319 | 0.05 |
ENST00000342173.7
ENST00000488176.1 ENST00000370109.3 |
DPH5
|
diphthamide biosynthesis 5 |
| chr1_-_161208013 | 0.05 |
ENST00000515452.1
ENST00000367983.4 |
NR1I3
|
nuclear receptor subfamily 1, group I, member 3 |
| chr6_+_53948221 | 0.05 |
ENST00000460844.2
|
MLIP
|
muscular LMNA-interacting protein |
| chr17_-_19651598 | 0.05 |
ENST00000570414.1
|
ALDH3A1
|
aldehyde dehydrogenase 3 family, member A1 |
| chr1_+_45212051 | 0.05 |
ENST00000372222.3
|
KIF2C
|
kinesin family member 2C |
| chr4_+_110354928 | 0.05 |
ENST00000504968.2
ENST00000399100.2 ENST00000265175.5 |
SEC24B
|
SEC24 family member B |
| chr11_-_105948040 | 0.05 |
ENST00000534815.1
|
KBTBD3
|
kelch repeat and BTB (POZ) domain containing 3 |
| chr5_+_150404904 | 0.05 |
ENST00000521632.1
|
GPX3
|
glutathione peroxidase 3 (plasma) |
| chr2_+_191208196 | 0.05 |
ENST00000392329.2
ENST00000322522.4 ENST00000430311.1 ENST00000541441.1 |
INPP1
|
inositol polyphosphate-1-phosphatase |
| chr4_+_41937131 | 0.05 |
ENST00000504986.1
ENST00000508448.1 ENST00000513702.1 ENST00000325094.5 |
TMEM33
|
transmembrane protein 33 |
| chr18_+_3262954 | 0.04 |
ENST00000584539.1
|
MYL12B
|
myosin, light chain 12B, regulatory |
| chr5_+_49963239 | 0.04 |
ENST00000505554.1
|
PARP8
|
poly (ADP-ribose) polymerase family, member 8 |
| chr11_-_77185094 | 0.04 |
ENST00000278568.4
ENST00000356341.3 |
PAK1
|
p21 protein (Cdc42/Rac)-activated kinase 1 |
| chr1_+_45212074 | 0.04 |
ENST00000372217.1
|
KIF2C
|
kinesin family member 2C |
| chr9_-_88356733 | 0.04 |
ENST00000376083.3
|
AGTPBP1
|
ATP/GTP binding protein 1 |
| chr22_-_29457832 | 0.04 |
ENST00000216071.4
|
C22orf31
|
chromosome 22 open reading frame 31 |
| chr12_-_71031185 | 0.04 |
ENST00000548122.1
ENST00000551525.1 ENST00000550358.1 |
PTPRB
|
protein tyrosine phosphatase, receptor type, B |
| chr1_-_161207875 | 0.04 |
ENST00000512372.1
ENST00000437437.2 ENST00000442691.2 ENST00000412844.2 ENST00000428574.2 ENST00000505005.1 ENST00000508740.1 ENST00000508387.1 ENST00000504010.1 ENST00000511676.1 ENST00000502985.1 ENST00000367981.3 ENST00000515621.1 ENST00000511944.1 ENST00000511748.1 ENST00000367984.4 ENST00000367985.3 |
NR1I3
|
nuclear receptor subfamily 1, group I, member 3 |
| chr13_+_28813645 | 0.04 |
ENST00000282391.5
|
PAN3
|
PAN3 poly(A) specific ribonuclease subunit homolog (S. cerevisiae) |
| chr10_-_94050820 | 0.04 |
ENST00000265997.4
|
CPEB3
|
cytoplasmic polyadenylation element binding protein 3 |
| chr12_-_88423164 | 0.04 |
ENST00000298699.2
ENST00000550553.1 |
C12orf50
|
chromosome 12 open reading frame 50 |
| chr6_-_30043539 | 0.04 |
ENST00000376751.3
ENST00000244360.6 |
RNF39
|
ring finger protein 39 |
| chr4_+_139694701 | 0.04 |
ENST00000502606.1
|
RP11-98O2.1
|
RP11-98O2.1 |
| chr4_+_96012614 | 0.04 |
ENST00000264568.4
|
BMPR1B
|
bone morphogenetic protein receptor, type IB |
| chr15_+_58430368 | 0.04 |
ENST00000558772.1
ENST00000219919.4 |
AQP9
|
aquaporin 9 |
| chr2_-_101925055 | 0.04 |
ENST00000295317.3
|
RNF149
|
ring finger protein 149 |
| chr16_-_30102547 | 0.04 |
ENST00000279386.2
|
TBX6
|
T-box 6 |
| chr3_-_58200398 | 0.03 |
ENST00000318316.3
ENST00000460422.1 ENST00000483681.1 |
DNASE1L3
|
deoxyribonuclease I-like 3 |
| chr17_-_41984835 | 0.03 |
ENST00000520406.1
ENST00000518478.1 ENST00000522172.1 ENST00000461854.1 ENST00000521178.1 ENST00000520305.1 ENST00000523501.1 ENST00000520241.1 |
MPP2
|
membrane protein, palmitoylated 2 (MAGUK p55 subfamily member 2) |
| chr8_+_107738240 | 0.03 |
ENST00000449762.2
ENST00000297447.6 |
OXR1
|
oxidation resistance 1 |
| chr4_+_96012585 | 0.03 |
ENST00000502683.1
|
BMPR1B
|
bone morphogenetic protein receptor, type IB |
| chr1_-_161207953 | 0.03 |
ENST00000367982.4
|
NR1I3
|
nuclear receptor subfamily 1, group I, member 3 |
| chr3_-_55539287 | 0.03 |
ENST00000472238.1
|
RP11-875H7.5
|
RP11-875H7.5 |
| chr7_-_15601595 | 0.03 |
ENST00000342526.3
|
AGMO
|
alkylglycerol monooxygenase |
| chr7_-_141401951 | 0.03 |
ENST00000536163.1
|
KIAA1147
|
KIAA1147 |
| chr2_-_99279928 | 0.03 |
ENST00000414521.2
|
MGAT4A
|
mannosyl (alpha-1,3-)-glycoprotein beta-1,4-N-acetylglucosaminyltransferase, isozyme A |
| chr17_-_42144949 | 0.03 |
ENST00000591247.1
|
LSM12
|
LSM12 homolog (S. cerevisiae) |
| chr8_-_102218292 | 0.03 |
ENST00000518336.1
ENST00000520454.1 |
ZNF706
|
zinc finger protein 706 |
| chr1_+_65613513 | 0.03 |
ENST00000395334.2
|
AK4
|
adenylate kinase 4 |
| chr2_+_198318147 | 0.03 |
ENST00000263960.2
|
COQ10B
|
coenzyme Q10 homolog B (S. cerevisiae) |
| chr5_+_95997769 | 0.03 |
ENST00000338252.3
ENST00000508830.1 |
CAST
|
calpastatin |
| chr3_+_62304712 | 0.03 |
ENST00000494481.1
|
C3orf14
|
chromosome 3 open reading frame 14 |
| chr9_-_95298314 | 0.03 |
ENST00000344604.5
ENST00000375540.1 |
ECM2
|
extracellular matrix protein 2, female organ and adipocyte specific |
| chr21_+_40824003 | 0.03 |
ENST00000452550.1
|
SH3BGR
|
SH3 domain binding glutamic acid-rich protein |
| chr19_-_4065730 | 0.03 |
ENST00000601588.1
|
ZBTB7A
|
zinc finger and BTB domain containing 7A |
| chr2_-_239197201 | 0.03 |
ENST00000254658.3
|
PER2
|
period circadian clock 2 |
| chr20_-_49547731 | 0.03 |
ENST00000396029.3
|
ADNP
|
activity-dependent neuroprotector homeobox |
| chr3_+_141103634 | 0.03 |
ENST00000507722.1
|
ZBTB38
|
zinc finger and BTB domain containing 38 |
| chr5_-_140013241 | 0.03 |
ENST00000519715.1
|
CD14
|
CD14 molecule |
| chr19_+_1450112 | 0.02 |
ENST00000590469.1
ENST00000233607.2 ENST00000238483.4 ENST00000590877.1 |
APC2
|
adenomatosis polyposis coli 2 |
| chr10_+_90660832 | 0.02 |
ENST00000371924.1
|
STAMBPL1
|
STAM binding protein-like 1 |
| chr14_-_23285069 | 0.02 |
ENST00000554758.1
ENST00000397528.4 |
SLC7A7
|
solute carrier family 7 (amino acid transporter light chain, y+L system), member 7 |
| chr4_-_70725856 | 0.02 |
ENST00000226444.3
|
SULT1E1
|
sulfotransferase family 1E, estrogen-preferring, member 1 |
| chr17_+_61851504 | 0.02 |
ENST00000359353.5
ENST00000389924.2 |
DDX42
|
DEAD (Asp-Glu-Ala-Asp) box helicase 42 |
| chr9_-_123639304 | 0.02 |
ENST00000436309.1
|
PHF19
|
PHD finger protein 19 |
| chr4_+_26344754 | 0.02 |
ENST00000515573.1
|
RBPJ
|
recombination signal binding protein for immunoglobulin kappa J region |
| chr19_-_35992780 | 0.02 |
ENST00000593342.1
ENST00000601650.1 ENST00000408915.2 |
DMKN
|
dermokine |
| chr9_+_110045537 | 0.02 |
ENST00000358015.3
|
RAD23B
|
RAD23 homolog B (S. cerevisiae) |
| chr5_+_95997885 | 0.02 |
ENST00000511097.2
|
CAST
|
calpastatin |
| chr1_-_150552006 | 0.02 |
ENST00000307940.3
ENST00000369026.2 |
MCL1
|
myeloid cell leukemia sequence 1 (BCL2-related) |
| chr17_+_11501748 | 0.02 |
ENST00000262442.4
ENST00000579828.1 |
DNAH9
|
dynein, axonemal, heavy chain 9 |
| chr5_+_34757309 | 0.02 |
ENST00000397449.1
|
RAI14
|
retinoic acid induced 14 |
| chr14_-_67826538 | 0.02 |
ENST00000553687.1
|
ATP6V1D
|
ATPase, H+ transporting, lysosomal 34kDa, V1 subunit D |
| chr6_-_116447283 | 0.02 |
ENST00000452729.1
ENST00000243222.4 |
COL10A1
|
collagen, type X, alpha 1 |
| chr17_-_73178599 | 0.01 |
ENST00000578238.1
|
SUMO2
|
small ubiquitin-like modifier 2 |
| chr8_+_110656344 | 0.01 |
ENST00000499579.1
|
RP11-422N16.3
|
Uncharacterized protein |
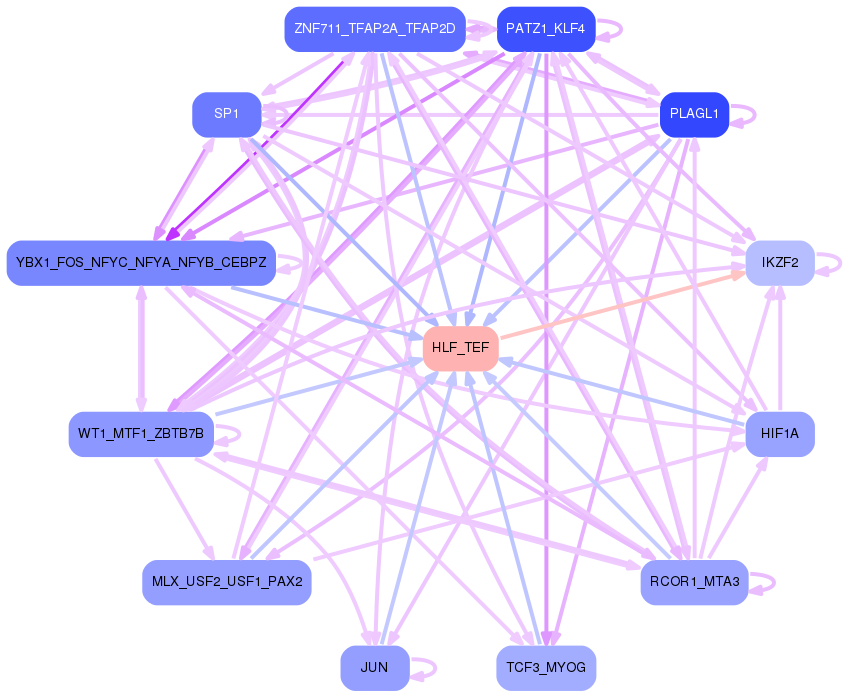
Network of associatons between targets according to the STRING database.

First level regulatory network of HLF_TEF
Gene Ontology Analysis
Gene overrepresentation in biological_process category:
| Log-likelihood per target | Total log-likelihood | Term | Description |
|---|---|---|---|
| 0.3 | 1.0 | GO:0002384 | hepatic immune response(GO:0002384) |
| 0.2 | 1.6 | GO:1902998 | regulation of neuronal signal transduction(GO:1902847) positive regulation of neurofibrillary tangle assembly(GO:1902998) |
| 0.1 | 0.9 | GO:1902455 | negative regulation of stem cell population maintenance(GO:1902455) |
| 0.1 | 0.2 | GO:0035750 | protein localization to myelin sheath abaxonal region(GO:0035750) |
| 0.1 | 0.4 | GO:2000638 | regulation of SREBP signaling pathway(GO:2000638) negative regulation of SREBP signaling pathway(GO:2000639) |
| 0.1 | 0.2 | GO:1903565 | negative regulation of protein localization to cilium(GO:1903565) regulation of protein localization to ciliary membrane(GO:1903567) negative regulation of protein localization to ciliary membrane(GO:1903568) |
| 0.0 | 0.2 | GO:0001831 | trophectodermal cellular morphogenesis(GO:0001831) |
| 0.0 | 0.2 | GO:0032571 | response to vitamin K(GO:0032571) |
| 0.0 | 0.3 | GO:1904694 | negative regulation of vascular smooth muscle contraction(GO:1904694) |
| 0.0 | 0.2 | GO:0039534 | negative regulation of MDA-5 signaling pathway(GO:0039534) |
| 0.0 | 0.2 | GO:0097112 | gamma-aminobutyric acid receptor clustering(GO:0097112) |
| 0.0 | 0.1 | GO:0046271 | phenylpropanoid catabolic process(GO:0046271) |
| 0.0 | 0.1 | GO:1902938 | regulation of intracellular calcium activated chloride channel activity(GO:1902938) |
| 0.0 | 0.1 | GO:1901979 | regulation of inward rectifier potassium channel activity(GO:1901979) regulation of cyclic nucleotide-gated ion channel activity(GO:1902159) |
| 0.0 | 0.1 | GO:2001027 | negative regulation of endothelial cell chemotaxis(GO:2001027) |
| 0.0 | 0.7 | GO:0045187 | regulation of circadian sleep/wake cycle, sleep(GO:0045187) |
| 0.0 | 0.2 | GO:0006499 | N-terminal protein myristoylation(GO:0006499) |
| 0.0 | 0.5 | GO:0050961 | detection of temperature stimulus involved in sensory perception(GO:0050961) detection of temperature stimulus involved in sensory perception of pain(GO:0050965) |
| 0.0 | 0.2 | GO:1901314 | negative regulation of histone ubiquitination(GO:0033183) progesterone receptor signaling pathway(GO:0050847) regulation of histone H2A K63-linked ubiquitination(GO:1901314) negative regulation of histone H2A K63-linked ubiquitination(GO:1901315) |
| 0.0 | 0.2 | GO:0071492 | cellular response to UV-A(GO:0071492) |
| 0.0 | 0.2 | GO:0071725 | toll-like receptor TLR1:TLR2 signaling pathway(GO:0038123) response to triacyl bacterial lipopeptide(GO:0071725) cellular response to triacyl bacterial lipopeptide(GO:0071727) |
| 0.0 | 0.1 | GO:0033484 | nitric oxide homeostasis(GO:0033484) |
| 0.0 | 0.0 | GO:1903378 | positive regulation of oxidative stress-induced neuron intrinsic apoptotic signaling pathway(GO:1903378) |
| 0.0 | 0.1 | GO:0018298 | protein-chromophore linkage(GO:0018298) |
| 0.0 | 0.1 | GO:0006556 | S-adenosylmethionine biosynthetic process(GO:0006556) |
| 0.0 | 0.2 | GO:0070934 | CRD-mediated mRNA stabilization(GO:0070934) |
| 0.0 | 0.0 | GO:1901301 | regulation of cargo loading into COPII-coated vesicle(GO:1901301) |
| 0.0 | 0.1 | GO:0021993 | initiation of neural tube closure(GO:0021993) |
| 0.0 | 0.1 | GO:0035610 | protein side chain deglutamylation(GO:0035610) |
| 0.0 | 0.2 | GO:1903764 | regulation of potassium ion export across plasma membrane(GO:1903764) |
| 0.0 | 0.0 | GO:1903371 | regulation of endoplasmic reticulum tubular network organization(GO:1903371) |
| 0.0 | 0.2 | GO:0061087 | positive regulation of histone H3-K27 methylation(GO:0061087) |
| 0.0 | 0.2 | GO:0006983 | ER overload response(GO:0006983) |
| 0.0 | 0.1 | GO:0006421 | asparaginyl-tRNA aminoacylation(GO:0006421) |
| 0.0 | 0.2 | GO:2000675 | negative regulation of type B pancreatic cell apoptotic process(GO:2000675) |
| 0.0 | 0.0 | GO:1900365 | positive regulation of mRNA polyadenylation(GO:1900365) |
| 0.0 | 0.2 | GO:0045793 | positive regulation of cell size(GO:0045793) |
| 0.0 | 0.3 | GO:0006744 | ubiquinone biosynthetic process(GO:0006744) quinone biosynthetic process(GO:1901663) |
| 0.0 | 0.3 | GO:0006999 | nuclear pore organization(GO:0006999) |
Gene overrepresentation in cellular_component category:
| Log-likelihood per target | Total log-likelihood | Term | Description |
|---|---|---|---|
| 0.2 | 1.0 | GO:0005896 | interleukin-6 receptor complex(GO:0005896) |
| 0.1 | 1.6 | GO:0034366 | spherical high-density lipoprotein particle(GO:0034366) |
| 0.1 | 0.2 | GO:0016935 | glycine-gated chloride channel complex(GO:0016935) |
| 0.1 | 0.4 | GO:1990452 | Parkin-FBXW7-Cul1 ubiquitin ligase complex(GO:1990452) |
| 0.0 | 0.4 | GO:0043219 | lateral loop(GO:0043219) |
| 0.0 | 0.2 | GO:0097452 | GAIT complex(GO:0097452) |
| 0.0 | 0.2 | GO:0005827 | polar microtubule(GO:0005827) |
| 0.0 | 0.2 | GO:0046696 | lipopolysaccharide receptor complex(GO:0046696) |
| 0.0 | 0.2 | GO:0030688 | preribosome, small subunit precursor(GO:0030688) |
| 0.0 | 0.2 | GO:0044615 | nuclear pore nuclear basket(GO:0044615) |
Gene overrepresentation in molecular_function category:
| Log-likelihood per target | Total log-likelihood | Term | Description |
|---|---|---|---|
| 0.3 | 1.0 | GO:0070119 | ciliary neurotrophic factor binding(GO:0070119) |
| 0.1 | 0.5 | GO:0052829 | inositol-1,4-bisphosphate 1-phosphatase activity(GO:0004441) inositol-1,3,4-trisphosphate 1-phosphatase activity(GO:0052829) |
| 0.1 | 0.5 | GO:0018479 | benzaldehyde dehydrogenase (NAD+) activity(GO:0018479) |
| 0.0 | 1.6 | GO:0051787 | misfolded protein binding(GO:0051787) |
| 0.0 | 0.4 | GO:0050816 | phosphothreonine binding(GO:0050816) |
| 0.0 | 0.2 | GO:0031208 | POZ domain binding(GO:0031208) |
| 0.0 | 0.2 | GO:0032427 | GBD domain binding(GO:0032427) |
| 0.0 | 0.2 | GO:0008457 | beta-galactosyl-N-acetylglucosaminylgalactosylglucosyl-ceramide beta-1,3-acetylglucosaminyltransferase activity(GO:0008457) lactosylceramide 1,3-N-acetyl-beta-D-glucosaminyltransferase activity(GO:0047256) |
| 0.0 | 0.2 | GO:0004882 | androgen receptor activity(GO:0004882) |
| 0.0 | 0.2 | GO:0016933 | inhibitory extracellular ligand-gated ion channel activity(GO:0005237) extracellular-glycine-gated ion channel activity(GO:0016933) extracellular-glycine-gated chloride channel activity(GO:0016934) |
| 0.0 | 0.2 | GO:0016019 | peptidoglycan receptor activity(GO:0016019) |
| 0.0 | 0.1 | GO:0008020 | G-protein coupled photoreceptor activity(GO:0008020) |
| 0.0 | 0.2 | GO:0010859 | calcium-dependent cysteine-type endopeptidase inhibitor activity(GO:0010859) |
| 0.0 | 0.1 | GO:1903135 | cupric ion binding(GO:1903135) |
| 0.0 | 0.1 | GO:0005157 | macrophage colony-stimulating factor receptor binding(GO:0005157) |
| 0.0 | 0.5 | GO:0008191 | metalloendopeptidase inhibitor activity(GO:0008191) |
| 0.0 | 0.5 | GO:0016505 | peptidase activator activity involved in apoptotic process(GO:0016505) |
| 0.0 | 0.2 | GO:0033192 | calmodulin-dependent protein phosphatase activity(GO:0033192) |
| 0.0 | 0.2 | GO:0089720 | caspase binding(GO:0089720) |
| 0.0 | 0.2 | GO:0097016 | L27 domain binding(GO:0097016) |
| 0.0 | 0.1 | GO:1902282 | voltage-gated potassium channel activity involved in ventricular cardiac muscle cell action potential repolarization(GO:1902282) |
| 0.0 | 0.2 | GO:0034450 | ubiquitin-ubiquitin ligase activity(GO:0034450) |
| 0.0 | 0.1 | GO:0048039 | ubiquinone binding(GO:0048039) |
Gene overrepresentation in C2:CP category:
| Log-likelihood per target | Total log-likelihood | Term | Description |
|---|---|---|---|
| 0.1 | 1.0 | ST STAT3 PATHWAY | STAT3 Pathway |
Gene overrepresentation in C2:CP:REACTOME category:
| Log-likelihood per target | Total log-likelihood | Term | Description |
|---|---|---|---|
| 0.1 | 1.0 | REACTOME IL 6 SIGNALING | Genes involved in Interleukin-6 signaling |
| 0.0 | 0.1 | REACTOME OPSINS | Genes involved in Opsins |
| 0.0 | 0.2 | REACTOME NEGATIVE REGULATION OF THE PI3K AKT NETWORK | Genes involved in Negative regulation of the PI3K/AKT network |