Project
NHBE cells infected with SARS-CoV-2 Analysis Results (GEO series: GSE147507)
Navigation
Downloads
Results for GFI1B
Z-value: 1.00
Motif logo
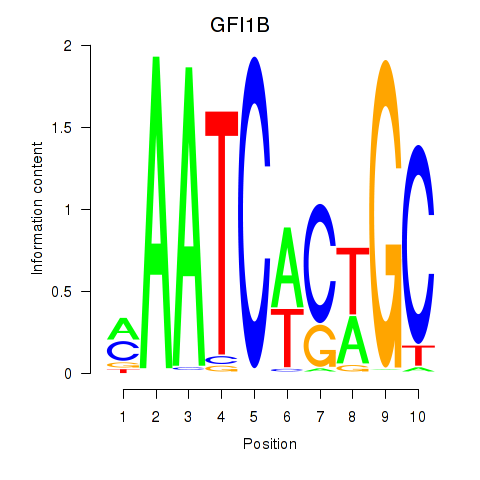
Transcription factors associated with GFI1B
| Gene Symbol | Gene ID | Gene Info |
|---|---|---|
|
GFI1B
|
ENSG00000165702.8 | growth factor independent 1B transcriptional repressor |
Activity profile of GFI1B motif
Sorted Z-values of GFI1B motif
| Promoter | Log-likelihood | Transcript | Gene | Gene Info |
|---|---|---|---|---|
| chr3_+_149689066 | 1.02 |
ENST00000593416.1
|
AC117395.1
|
LOC646903 protein; Uncharacterized protein |
| chr12_-_53601000 | 0.80 |
ENST00000338737.4
ENST00000549086.2 |
ITGB7
|
integrin, beta 7 |
| chr12_-_53601055 | 0.65 |
ENST00000552972.1
ENST00000422257.3 ENST00000267082.5 |
ITGB7
|
integrin, beta 7 |
| chr7_-_150721570 | 0.62 |
ENST00000377974.2
ENST00000444312.1 ENST00000605938.1 ENST00000605952.1 |
ATG9B
|
autophagy related 9B |
| chr1_+_74663896 | 0.48 |
ENST00000370898.3
ENST00000467578.2 ENST00000370894.5 ENST00000482102.2 ENST00000609362.1 ENST00000534056.1 ENST00000557284.2 ENST00000370899.3 ENST00000370895.1 ENST00000534632.1 ENST00000370893.1 ENST00000370891.2 |
FPGT
FPGT-TNNI3K
TNNI3K
|
fucose-1-phosphate guanylyltransferase FPGT-TNNI3K readthrough TNNI3 interacting kinase |
| chr9_-_95055923 | 0.47 |
ENST00000430417.1
|
IARS
|
isoleucyl-tRNA synthetase |
| chr1_+_164528866 | 0.45 |
ENST00000420696.2
|
PBX1
|
pre-B-cell leukemia homeobox 1 |
| chr3_-_100551141 | 0.45 |
ENST00000478235.1
ENST00000471901.1 |
ABI3BP
|
ABI family, member 3 (NESH) binding protein |
| chr5_-_142077569 | 0.42 |
ENST00000407758.1
ENST00000441680.2 ENST00000419524.2 |
FGF1
|
fibroblast growth factor 1 (acidic) |
| chr6_-_56707943 | 0.41 |
ENST00000370769.4
ENST00000421834.2 ENST00000312431.6 ENST00000361203.3 ENST00000523817.1 |
DST
|
dystonin |
| chr11_-_94964354 | 0.41 |
ENST00000536441.1
|
SESN3
|
sestrin 3 |
| chr22_-_24241117 | 0.38 |
ENST00000406213.1
|
AP000350.4
|
Uncharacterized protein |
| chr1_+_164529004 | 0.38 |
ENST00000559240.1
ENST00000367897.1 ENST00000540236.1 ENST00000401534.1 |
PBX1
|
pre-B-cell leukemia homeobox 1 |
| chr14_-_68157084 | 0.34 |
ENST00000557564.1
|
RP11-1012A1.4
|
RP11-1012A1.4 |
| chr1_+_95616933 | 0.34 |
ENST00000604203.1
|
RP11-57H12.6
|
TMEM56-RWDD3 readthrough |
| chr2_+_9563769 | 0.34 |
ENST00000475482.1
|
CPSF3
|
cleavage and polyadenylation specific factor 3, 73kDa |
| chr7_+_79765071 | 0.33 |
ENST00000457358.2
|
GNAI1
|
guanine nucleotide binding protein (G protein), alpha inhibiting activity polypeptide 1 |
| chr6_+_90272488 | 0.32 |
ENST00000485637.1
ENST00000522705.1 |
ANKRD6
|
ankyrin repeat domain 6 |
| chr12_-_6602955 | 0.32 |
ENST00000543703.1
|
MRPL51
|
mitochondrial ribosomal protein L51 |
| chr11_+_101785727 | 0.32 |
ENST00000263468.8
|
KIAA1377
|
KIAA1377 |
| chr4_+_108852697 | 0.32 |
ENST00000508453.1
|
CYP2U1
|
cytochrome P450, family 2, subfamily U, polypeptide 1 |
| chr12_+_44229846 | 0.32 |
ENST00000551577.1
ENST00000266534.3 |
TMEM117
|
transmembrane protein 117 |
| chr13_-_76111945 | 0.31 |
ENST00000355801.4
ENST00000406936.3 |
COMMD6
|
COMM domain containing 6 |
| chr16_+_68279256 | 0.31 |
ENST00000564827.2
ENST00000566188.1 ENST00000444212.2 ENST00000568082.1 |
PLA2G15
|
phospholipase A2, group XV |
| chr11_-_7961141 | 0.30 |
ENST00000360759.3
|
OR10A3
|
olfactory receptor, family 10, subfamily A, member 3 |
| chr15_-_38519066 | 0.30 |
ENST00000561320.1
ENST00000561161.1 |
RP11-346D14.1
|
RP11-346D14.1 |
| chr4_-_68620053 | 0.30 |
ENST00000420975.2
ENST00000226413.4 |
GNRHR
|
gonadotropin-releasing hormone receptor |
| chr5_-_64920115 | 0.29 |
ENST00000381018.3
ENST00000274327.7 |
TRIM23
|
tripartite motif containing 23 |
| chr11_+_5617330 | 0.28 |
ENST00000278302.5
ENST00000424369.1 ENST00000507320.1 ENST00000380107.1 |
TRIM6
|
tripartite motif containing 6 |
| chr15_-_90456156 | 0.28 |
ENST00000357484.5
|
C15orf38
|
chromosome 15 open reading frame 38 |
| chr11_+_5618029 | 0.28 |
ENST00000515022.1
ENST00000506134.1 |
TRIM6
|
tripartite motif containing 6 |
| chr11_+_74699703 | 0.28 |
ENST00000529024.1
ENST00000544263.1 |
NEU3
|
sialidase 3 (membrane sialidase) |
| chr7_+_66800928 | 0.28 |
ENST00000430244.1
|
RP11-166O4.5
|
RP11-166O4.5 |
| chr14_-_73360796 | 0.27 |
ENST00000556509.1
ENST00000541685.1 ENST00000546183.1 |
DPF3
|
D4, zinc and double PHD fingers, family 3 |
| chr5_-_139930713 | 0.27 |
ENST00000602657.1
|
SRA1
|
steroid receptor RNA activator 1 |
| chr6_-_56708459 | 0.27 |
ENST00000370788.2
|
DST
|
dystonin |
| chr5_-_137475071 | 0.26 |
ENST00000265191.2
|
NME5
|
NME/NM23 family member 5 |
| chr7_-_112579673 | 0.26 |
ENST00000432572.1
|
C7orf60
|
chromosome 7 open reading frame 60 |
| chr6_-_88411911 | 0.26 |
ENST00000257787.5
|
AKIRIN2
|
akirin 2 |
| chr4_-_113627966 | 0.26 |
ENST00000505632.1
|
RP11-148B6.2
|
RP11-148B6.2 |
| chr13_-_27745936 | 0.26 |
ENST00000282344.6
|
USP12
|
ubiquitin specific peptidase 12 |
| chr1_+_45792541 | 0.25 |
ENST00000334815.3
|
HPDL
|
4-hydroxyphenylpyruvate dioxygenase-like |
| chr1_-_45965525 | 0.25 |
ENST00000488405.2
ENST00000490551.3 ENST00000432082.1 |
CCDC163P
|
coiled-coil domain containing 163, pseudogene |
| chr11_+_27076764 | 0.25 |
ENST00000525090.1
|
BBOX1
|
butyrobetaine (gamma), 2-oxoglutarate dioxygenase (gamma-butyrobetaine hydroxylase) 1 |
| chr12_-_70093235 | 0.25 |
ENST00000266661.4
|
BEST3
|
bestrophin 3 |
| chr13_+_98795664 | 0.24 |
ENST00000376581.5
|
FARP1
|
FERM, RhoGEF (ARHGEF) and pleckstrin domain protein 1 (chondrocyte-derived) |
| chr1_-_209741018 | 0.24 |
ENST00000424696.2
|
RP1-272L16.1
|
RP1-272L16.1 |
| chr14_-_53417732 | 0.24 |
ENST00000399304.3
ENST00000395631.2 ENST00000341590.3 ENST00000343279.4 |
FERMT2
|
fermitin family member 2 |
| chr1_-_94703118 | 0.24 |
ENST00000260526.6
ENST00000370217.3 |
ARHGAP29
|
Rho GTPase activating protein 29 |
| chr6_+_90192974 | 0.24 |
ENST00000520458.1
|
ANKRD6
|
ankyrin repeat domain 6 |
| chr1_+_23953817 | 0.24 |
ENST00000374555.3
|
MDS2
|
myelodysplastic syndrome 2 translocation associated |
| chr1_-_115301235 | 0.24 |
ENST00000525878.1
|
CSDE1
|
cold shock domain containing E1, RNA-binding |
| chr16_+_12995468 | 0.23 |
ENST00000424107.3
ENST00000558583.1 ENST00000558318.1 |
SHISA9
|
shisa family member 9 |
| chr6_+_71123107 | 0.23 |
ENST00000370479.3
ENST00000505769.1 ENST00000515323.1 ENST00000515280.1 ENST00000507085.1 ENST00000457062.2 ENST00000361499.3 |
FAM135A
|
family with sequence similarity 135, member A |
| chr5_-_124080203 | 0.23 |
ENST00000504926.1
|
ZNF608
|
zinc finger protein 608 |
| chr18_+_11857439 | 0.23 |
ENST00000602628.1
|
GNAL
|
guanine nucleotide binding protein (G protein), alpha activating activity polypeptide, olfactory type |
| chr6_+_46620705 | 0.23 |
ENST00000452689.2
|
SLC25A27
|
solute carrier family 25, member 27 |
| chr17_-_19281203 | 0.22 |
ENST00000487415.2
|
B9D1
|
B9 protein domain 1 |
| chr4_+_48807155 | 0.22 |
ENST00000504654.1
|
OCIAD1
|
OCIA domain containing 1 |
| chr2_+_29341037 | 0.22 |
ENST00000449202.1
|
CLIP4
|
CAP-GLY domain containing linker protein family, member 4 |
| chr4_-_176733897 | 0.22 |
ENST00000393658.2
|
GPM6A
|
glycoprotein M6A |
| chr21_-_43916296 | 0.22 |
ENST00000398352.3
|
RSPH1
|
radial spoke head 1 homolog (Chlamydomonas) |
| chr4_+_41362796 | 0.22 |
ENST00000508501.1
ENST00000512946.1 ENST00000313860.7 ENST00000512632.1 ENST00000512820.1 |
LIMCH1
|
LIM and calponin homology domains 1 |
| chr16_-_69385681 | 0.22 |
ENST00000288025.3
|
TMED6
|
transmembrane emp24 protein transport domain containing 6 |
| chr4_+_15471489 | 0.21 |
ENST00000424120.1
ENST00000413206.1 ENST00000438599.2 ENST00000511544.1 ENST00000512702.1 ENST00000507954.1 ENST00000515124.1 ENST00000503292.1 ENST00000503658.1 |
CC2D2A
|
coiled-coil and C2 domain containing 2A |
| chr11_+_71791849 | 0.21 |
ENST00000423494.2
ENST00000539587.1 ENST00000538478.1 ENST00000324866.7 ENST00000439209.1 |
LRTOMT
|
leucine rich transmembrane and O-methyltransferase domain containing |
| chr19_+_17337473 | 0.21 |
ENST00000598068.1
|
OCEL1
|
occludin/ELL domain containing 1 |
| chr14_-_64194745 | 0.21 |
ENST00000247225.6
|
SGPP1
|
sphingosine-1-phosphate phosphatase 1 |
| chr2_-_158732340 | 0.21 |
ENST00000539637.1
ENST00000413751.1 ENST00000434821.1 ENST00000424669.1 |
ACVR1
|
activin A receptor, type I |
| chr15_-_70994612 | 0.21 |
ENST00000558758.1
ENST00000379983.2 ENST00000560441.1 |
UACA
|
uveal autoantigen with coiled-coil domains and ankyrin repeats |
| chr1_-_173638976 | 0.21 |
ENST00000333279.2
|
ANKRD45
|
ankyrin repeat domain 45 |
| chr11_+_5617976 | 0.21 |
ENST00000445329.1
|
TRIM6
|
tripartite motif containing 6 |
| chr7_+_120591170 | 0.20 |
ENST00000431467.1
|
ING3
|
inhibitor of growth family, member 3 |
| chr17_-_48133054 | 0.20 |
ENST00000499842.1
|
RP11-1094H24.4
|
RP11-1094H24.4 |
| chr1_+_92764522 | 0.20 |
ENST00000610020.1
|
RPAP2
|
RNA polymerase II associated protein 2 |
| chr4_-_156875003 | 0.20 |
ENST00000433477.3
|
CTSO
|
cathepsin O |
| chr1_-_68698197 | 0.20 |
ENST00000370973.2
ENST00000370971.1 |
WLS
|
wntless Wnt ligand secretion mediator |
| chr1_-_179834311 | 0.20 |
ENST00000553856.1
|
IFRG15
|
Homo sapiens torsin A interacting protein 2 (TOR1AIP2), transcript variant 1, mRNA. |
| chr4_-_112993808 | 0.20 |
ENST00000511219.1
|
RP11-269F21.3
|
RP11-269F21.3 |
| chr1_+_109102652 | 0.20 |
ENST00000370035.3
ENST00000405454.1 |
FAM102B
|
family with sequence similarity 102, member B |
| chr18_+_77905894 | 0.19 |
ENST00000589574.1
ENST00000588226.1 ENST00000585422.1 |
AC139100.2
|
Uncharacterized protein |
| chr1_-_68698222 | 0.19 |
ENST00000370976.3
ENST00000354777.2 ENST00000262348.4 ENST00000540432.1 |
WLS
|
wntless Wnt ligand secretion mediator |
| chr8_-_6420759 | 0.19 |
ENST00000523120.1
|
ANGPT2
|
angiopoietin 2 |
| chr12_+_32638897 | 0.19 |
ENST00000531134.1
|
FGD4
|
FYVE, RhoGEF and PH domain containing 4 |
| chr1_-_47134085 | 0.19 |
ENST00000371937.4
ENST00000574428.1 ENST00000329231.4 |
ATPAF1
|
ATP synthase mitochondrial F1 complex assembly factor 1 |
| chr1_-_23886285 | 0.19 |
ENST00000374561.5
|
ID3
|
inhibitor of DNA binding 3, dominant negative helix-loop-helix protein |
| chr2_-_45236540 | 0.19 |
ENST00000303077.6
|
SIX2
|
SIX homeobox 2 |
| chr5_+_36608422 | 0.18 |
ENST00000381918.3
|
SLC1A3
|
solute carrier family 1 (glial high affinity glutamate transporter), member 3 |
| chr20_-_35274548 | 0.18 |
ENST00000262866.4
|
SLA2
|
Src-like-adaptor 2 |
| chrX_+_119737806 | 0.18 |
ENST00000371317.5
|
MCTS1
|
malignant T cell amplified sequence 1 |
| chr1_+_35544968 | 0.18 |
ENST00000359858.4
ENST00000373330.1 |
ZMYM1
|
zinc finger, MYM-type 1 |
| chr1_+_101702417 | 0.18 |
ENST00000305352.6
|
S1PR1
|
sphingosine-1-phosphate receptor 1 |
| chr19_+_21264943 | 0.18 |
ENST00000597424.1
|
ZNF714
|
zinc finger protein 714 |
| chr10_+_70980051 | 0.18 |
ENST00000354624.5
ENST00000395086.2 |
HKDC1
|
hexokinase domain containing 1 |
| chr1_+_164528616 | 0.18 |
ENST00000340699.3
|
PBX1
|
pre-B-cell leukemia homeobox 1 |
| chr4_+_78829479 | 0.18 |
ENST00000504901.1
|
MRPL1
|
mitochondrial ribosomal protein L1 |
| chr1_-_92764523 | 0.17 |
ENST00000370360.3
ENST00000534881.1 |
GLMN
|
glomulin, FKBP associated protein |
| chr16_+_68279207 | 0.17 |
ENST00000413021.2
ENST00000565744.1 ENST00000219345.5 |
PLA2G15
|
phospholipase A2, group XV |
| chr8_-_10987745 | 0.17 |
ENST00000400102.3
|
AF131215.5
|
AF131215.5 |
| chrX_+_49832231 | 0.17 |
ENST00000376108.3
|
CLCN5
|
chloride channel, voltage-sensitive 5 |
| chr17_+_74075263 | 0.17 |
ENST00000334586.5
ENST00000392503.2 |
ZACN
|
zinc activated ligand-gated ion channel |
| chr19_+_11455900 | 0.17 |
ENST00000588790.1
|
CCDC159
|
coiled-coil domain containing 159 |
| chr2_+_47630108 | 0.17 |
ENST00000233146.2
ENST00000454849.1 ENST00000543555.1 |
MSH2
|
mutS homolog 2 |
| chr14_-_106069247 | 0.17 |
ENST00000479229.1
|
RP11-731F5.1
|
RP11-731F5.1 |
| chr19_+_21264980 | 0.17 |
ENST00000596053.1
ENST00000597086.1 ENST00000596143.1 ENST00000596367.1 ENST00000601416.1 |
ZNF714
|
zinc finger protein 714 |
| chr18_+_48494361 | 0.17 |
ENST00000588577.1
ENST00000269466.3 ENST00000591429.1 ENST00000452201.2 |
ELAC1
SMAD4
|
elaC ribonuclease Z 1 SMAD family member 4 |
| chrX_+_129473859 | 0.17 |
ENST00000424447.1
|
SLC25A14
|
solute carrier family 25 (mitochondrial carrier, brain), member 14 |
| chr7_+_150758642 | 0.17 |
ENST00000488420.1
|
SLC4A2
|
solute carrier family 4 (anion exchanger), member 2 |
| chr11_-_85430356 | 0.17 |
ENST00000526999.1
|
SYTL2
|
synaptotagmin-like 2 |
| chr19_+_9361606 | 0.17 |
ENST00000456448.1
|
OR7E24
|
olfactory receptor, family 7, subfamily E, member 24 |
| chr19_-_58951496 | 0.17 |
ENST00000254166.3
|
ZNF132
|
zinc finger protein 132 |
| chr6_-_8435758 | 0.16 |
ENST00000426876.1
ENST00000339306.5 |
SLC35B3
|
solute carrier family 35 (adenosine 3'-phospho 5'-phosphosulfate transporter), member B3 |
| chr12_+_117176090 | 0.16 |
ENST00000257575.4
ENST00000407967.3 ENST00000392549.2 |
RNFT2
|
ring finger protein, transmembrane 2 |
| chr7_+_127233689 | 0.16 |
ENST00000265825.5
ENST00000420086.2 |
FSCN3
|
fascin homolog 3, actin-bundling protein, testicular (Strongylocentrotus purpuratus) |
| chr19_+_51774540 | 0.16 |
ENST00000600813.1
|
CTD-3187F8.11
|
CTD-3187F8.11 |
| chr11_+_71791693 | 0.16 |
ENST00000289488.2
ENST00000447974.1 |
LRTOMT
|
leucine rich transmembrane and O-methyltransferase domain containing |
| chr4_+_26165074 | 0.16 |
ENST00000512351.1
|
RBPJ
|
recombination signal binding protein for immunoglobulin kappa J region |
| chr4_+_105828492 | 0.16 |
ENST00000506148.1
|
RP11-556I14.1
|
RP11-556I14.1 |
| chr19_-_48823332 | 0.16 |
ENST00000315396.7
|
CCDC114
|
coiled-coil domain containing 114 |
| chr6_+_107077471 | 0.16 |
ENST00000369044.1
|
QRSL1
|
glutaminyl-tRNA synthase (glutamine-hydrolyzing)-like 1 |
| chr15_+_65204075 | 0.16 |
ENST00000380230.3
ENST00000357698.3 ENST00000395720.1 ENST00000496660.1 ENST00000319580.8 |
ANKDD1A
|
ankyrin repeat and death domain containing 1A |
| chr12_+_124155652 | 0.16 |
ENST00000426174.2
ENST00000303372.5 |
TCTN2
|
tectonic family member 2 |
| chr9_-_14180778 | 0.16 |
ENST00000380924.1
ENST00000543693.1 |
NFIB
|
nuclear factor I/B |
| chr19_-_41934635 | 0.16 |
ENST00000321702.2
|
B3GNT8
|
UDP-GlcNAc:betaGal beta-1,3-N-acetylglucosaminyltransferase 8 |
| chr15_-_75918787 | 0.15 |
ENST00000564086.1
|
SNUPN
|
snurportin 1 |
| chr10_-_129924611 | 0.15 |
ENST00000368654.3
|
MKI67
|
marker of proliferation Ki-67 |
| chr1_+_15943995 | 0.15 |
ENST00000480945.1
|
DDI2
|
DNA-damage inducible 1 homolog 2 (S. cerevisiae) |
| chr4_+_26585538 | 0.15 |
ENST00000264866.4
|
TBC1D19
|
TBC1 domain family, member 19 |
| chr9_-_95640218 | 0.15 |
ENST00000395506.3
ENST00000375495.3 ENST00000332591.6 |
ZNF484
|
zinc finger protein 484 |
| chr2_-_132589601 | 0.15 |
ENST00000437330.1
|
AC103564.7
|
AC103564.7 |
| chr7_+_120590803 | 0.15 |
ENST00000315870.5
ENST00000339121.5 ENST00000445699.1 |
ING3
|
inhibitor of growth family, member 3 |
| chr17_+_46131912 | 0.15 |
ENST00000584634.1
ENST00000580050.1 |
NFE2L1
|
nuclear factor, erythroid 2-like 1 |
| chr1_+_210406121 | 0.15 |
ENST00000367012.3
|
SERTAD4
|
SERTA domain containing 4 |
| chr17_+_46132037 | 0.15 |
ENST00000582155.1
ENST00000583378.1 ENST00000536222.1 |
NFE2L1
|
nuclear factor, erythroid 2-like 1 |
| chr19_+_55417499 | 0.15 |
ENST00000291890.4
ENST00000447255.1 ENST00000598576.1 ENST00000594765.1 |
NCR1
|
natural cytotoxicity triggering receptor 1 |
| chr20_+_52105495 | 0.15 |
ENST00000439873.2
|
AL354993.1
|
Cell growth-inhibiting protein 7; HCG1784586; Uncharacterized protein |
| chr3_-_18466026 | 0.15 |
ENST00000417717.2
|
SATB1
|
SATB homeobox 1 |
| chr21_-_42879909 | 0.15 |
ENST00000458356.1
ENST00000398585.3 ENST00000424093.1 |
TMPRSS2
|
transmembrane protease, serine 2 |
| chr1_-_23751189 | 0.14 |
ENST00000374601.3
ENST00000450454.2 |
TCEA3
|
transcription elongation factor A (SII), 3 |
| chr5_+_133451254 | 0.14 |
ENST00000517851.1
ENST00000521639.1 ENST00000522375.1 ENST00000378560.4 ENST00000432532.2 ENST00000520958.1 ENST00000518915.1 ENST00000395023.1 |
TCF7
|
transcription factor 7 (T-cell specific, HMG-box) |
| chr17_+_79031415 | 0.14 |
ENST00000572073.1
ENST00000573677.1 |
BAIAP2
|
BAI1-associated protein 2 |
| chr19_-_44388116 | 0.14 |
ENST00000587539.1
|
ZNF404
|
zinc finger protein 404 |
| chr12_-_95397442 | 0.14 |
ENST00000547157.1
ENST00000547986.1 ENST00000327772.2 |
NDUFA12
|
NADH dehydrogenase (ubiquinone) 1 alpha subcomplex, 12 |
| chr19_-_51412584 | 0.14 |
ENST00000431178.2
|
KLK4
|
kallikrein-related peptidase 4 |
| chr4_-_10023095 | 0.14 |
ENST00000264784.3
|
SLC2A9
|
solute carrier family 2 (facilitated glucose transporter), member 9 |
| chr10_-_23633720 | 0.14 |
ENST00000323327.4
|
C10orf67
|
chromosome 10 open reading frame 67 |
| chr15_-_49255632 | 0.14 |
ENST00000332408.4
|
SHC4
|
SHC (Src homology 2 domain containing) family, member 4 |
| chr1_-_74663825 | 0.14 |
ENST00000370911.3
ENST00000370909.2 ENST00000354431.4 |
LRRIQ3
|
leucine-rich repeats and IQ motif containing 3 |
| chr2_+_233404429 | 0.14 |
ENST00000389494.3
ENST00000389492.3 |
CHRNG
|
cholinergic receptor, nicotinic, gamma (muscle) |
| chr11_-_46113756 | 0.14 |
ENST00000531959.1
|
PHF21A
|
PHD finger protein 21A |
| chrX_-_54069576 | 0.14 |
ENST00000445025.1
ENST00000322659.8 |
PHF8
|
PHD finger protein 8 |
| chr2_+_158733088 | 0.14 |
ENST00000605860.1
|
UPP2
|
uridine phosphorylase 2 |
| chr21_-_47743719 | 0.14 |
ENST00000397680.1
ENST00000445935.1 ENST00000397685.4 ENST00000397682.3 ENST00000291691.7 |
C21orf58
|
chromosome 21 open reading frame 58 |
| chr1_+_33283043 | 0.14 |
ENST00000373476.1
ENST00000373475.5 ENST00000529027.1 ENST00000398243.3 |
S100PBP
|
S100P binding protein |
| chrX_-_48056199 | 0.14 |
ENST00000311798.1
ENST00000347757.1 |
SSX5
|
synovial sarcoma, X breakpoint 5 |
| chr4_+_154125565 | 0.14 |
ENST00000338700.5
|
TRIM2
|
tripartite motif containing 2 |
| chr3_-_93781750 | 0.14 |
ENST00000314636.2
|
DHFRL1
|
dihydrofolate reductase-like 1 |
| chr19_+_7069690 | 0.14 |
ENST00000439035.2
|
ZNF557
|
zinc finger protein 557 |
| chr4_+_76995855 | 0.13 |
ENST00000355810.4
ENST00000349321.3 |
ART3
|
ADP-ribosyltransferase 3 |
| chr10_-_129924468 | 0.13 |
ENST00000368653.3
|
MKI67
|
marker of proliferation Ki-67 |
| chr7_+_66093908 | 0.13 |
ENST00000443322.1
ENST00000449064.1 |
KCTD7
|
potassium channel tetramerization domain containing 7 |
| chr1_+_244816237 | 0.13 |
ENST00000302550.11
|
DESI2
|
desumoylating isopeptidase 2 |
| chr3_-_149688896 | 0.13 |
ENST00000239940.7
|
PFN2
|
profilin 2 |
| chr4_+_119606523 | 0.13 |
ENST00000388822.5
ENST00000506780.1 ENST00000508801.1 |
METTL14
|
methyltransferase like 14 |
| chr4_+_86748898 | 0.13 |
ENST00000509300.1
|
ARHGAP24
|
Rho GTPase activating protein 24 |
| chr1_-_197169672 | 0.13 |
ENST00000367405.4
|
ZBTB41
|
zinc finger and BTB domain containing 41 |
| chr12_+_72061563 | 0.13 |
ENST00000551238.1
|
THAP2
|
THAP domain containing, apoptosis associated protein 2 |
| chr3_+_119814070 | 0.13 |
ENST00000469070.1
|
RP11-18H7.1
|
RP11-18H7.1 |
| chr10_-_91403625 | 0.13 |
ENST00000322191.6
ENST00000342512.3 ENST00000371774.2 |
PANK1
|
pantothenate kinase 1 |
| chr16_+_21623392 | 0.13 |
ENST00000562961.1
|
METTL9
|
methyltransferase like 9 |
| chr2_-_110371412 | 0.13 |
ENST00000415095.1
ENST00000334001.6 ENST00000437928.1 ENST00000493445.1 ENST00000397714.2 ENST00000461295.1 |
SEPT10
|
septin 10 |
| chr16_+_15039742 | 0.13 |
ENST00000537062.1
|
NPIPA1
|
nuclear pore complex interacting protein family, member A1 |
| chr2_-_110371720 | 0.13 |
ENST00000356688.4
|
SEPT10
|
septin 10 |
| chr5_-_137071756 | 0.13 |
ENST00000394937.3
ENST00000309755.4 |
KLHL3
|
kelch-like family member 3 |
| chr7_+_134551583 | 0.13 |
ENST00000435928.1
|
CALD1
|
caldesmon 1 |
| chr2_+_219472637 | 0.13 |
ENST00000417849.1
|
PLCD4
|
phospholipase C, delta 4 |
| chr6_-_116381918 | 0.13 |
ENST00000606080.1
|
FRK
|
fyn-related kinase |
| chr2_-_176033066 | 0.13 |
ENST00000437522.1
|
ATF2
|
activating transcription factor 2 |
| chr17_+_36858694 | 0.13 |
ENST00000563897.1
|
CTB-58E17.1
|
CTB-58E17.1 |
| chr15_-_59041768 | 0.13 |
ENST00000402627.1
ENST00000396140.2 ENST00000559053.1 ENST00000561288.1 |
ADAM10
|
ADAM metallopeptidase domain 10 |
| chr6_-_13621126 | 0.13 |
ENST00000600057.1
|
AL441883.1
|
Uncharacterized protein |
| chr14_-_36989427 | 0.13 |
ENST00000354822.5
|
NKX2-1
|
NK2 homeobox 1 |
| chr2_-_55496344 | 0.12 |
ENST00000403721.1
ENST00000263629.4 |
MTIF2
|
mitochondrial translational initiation factor 2 |
| chr2_-_110371777 | 0.12 |
ENST00000397712.2
|
SEPT10
|
septin 10 |
| chr2_-_96874553 | 0.12 |
ENST00000337288.5
ENST00000443962.1 |
STARD7
|
StAR-related lipid transfer (START) domain containing 7 |
| chr11_-_33774944 | 0.12 |
ENST00000532057.1
ENST00000531080.1 |
FBXO3
|
F-box protein 3 |
| chr2_-_207078154 | 0.12 |
ENST00000447845.1
|
GPR1
|
G protein-coupled receptor 1 |
| chr1_-_47134101 | 0.12 |
ENST00000576409.1
|
ATPAF1
|
ATP synthase mitochondrial F1 complex assembly factor 1 |
| chr3_-_49466686 | 0.12 |
ENST00000273598.3
ENST00000436744.2 |
NICN1
|
nicolin 1 |
| chr4_-_4544061 | 0.11 |
ENST00000507908.1
|
STX18
|
syntaxin 18 |
| chr6_-_8435706 | 0.11 |
ENST00000379660.4
|
SLC35B3
|
solute carrier family 35 (adenosine 3'-phospho 5'-phosphosulfate transporter), member B3 |
| chr4_-_159080806 | 0.11 |
ENST00000590648.1
|
FAM198B
|
family with sequence similarity 198, member B |
| chr4_+_105828537 | 0.11 |
ENST00000515649.1
|
RP11-556I14.1
|
RP11-556I14.1 |
| chr2_+_234104079 | 0.11 |
ENST00000417661.1
|
INPP5D
|
inositol polyphosphate-5-phosphatase, 145kDa |
| chr15_-_34331243 | 0.11 |
ENST00000306730.3
|
AVEN
|
apoptosis, caspase activation inhibitor |
| chr1_+_202385953 | 0.11 |
ENST00000466968.1
|
PPP1R12B
|
protein phosphatase 1, regulatory subunit 12B |
| chr1_+_203651937 | 0.11 |
ENST00000341360.2
|
ATP2B4
|
ATPase, Ca++ transporting, plasma membrane 4 |
| chr21_-_43916433 | 0.11 |
ENST00000291536.3
|
RSPH1
|
radial spoke head 1 homolog (Chlamydomonas) |
| chr2_-_85788605 | 0.11 |
ENST00000233838.4
|
GGCX
|
gamma-glutamyl carboxylase |
| chr11_+_71791803 | 0.10 |
ENST00000539271.1
|
LRTOMT
|
leucine rich transmembrane and O-methyltransferase domain containing |
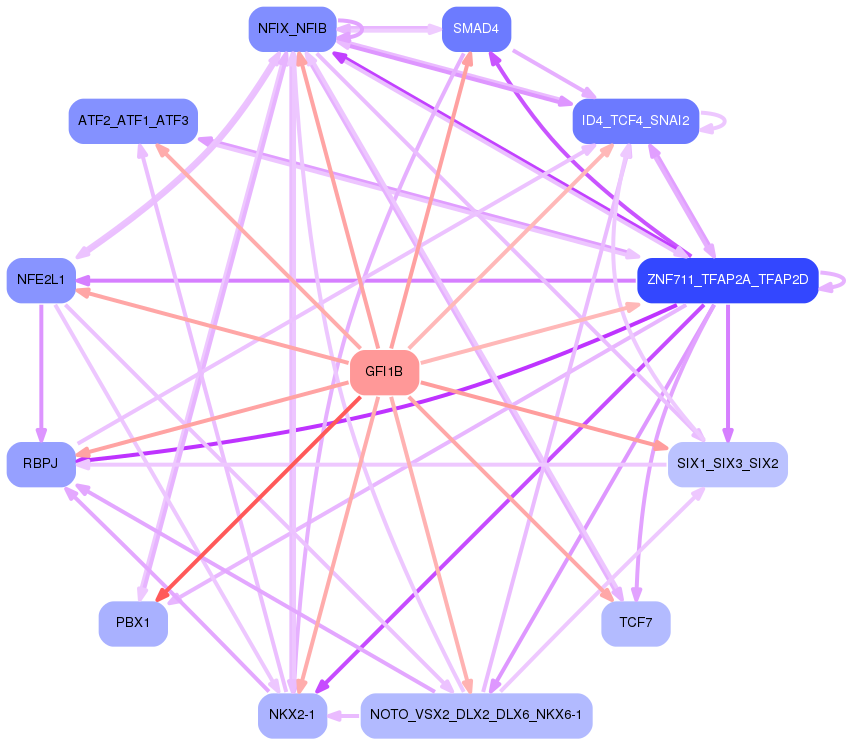
Network of associatons between targets according to the STRING database.

First level regulatory network of GFI1B
Gene Ontology Analysis
Gene overrepresentation in biological_process category:
| Log-likelihood per target | Total log-likelihood | Term | Description |
|---|---|---|---|
| 0.3 | 1.4 | GO:0003366 | cell-matrix adhesion involved in ameboidal cell migration(GO:0003366) |
| 0.1 | 0.5 | GO:0046338 | phosphatidylethanolamine catabolic process(GO:0046338) |
| 0.1 | 0.4 | GO:0006428 | isoleucyl-tRNA aminoacylation(GO:0006428) |
| 0.1 | 0.3 | GO:0051562 | negative regulation of mitochondrial calcium ion concentration(GO:0051562) |
| 0.1 | 0.6 | GO:0044805 | late nucleophagy(GO:0044805) |
| 0.1 | 0.4 | GO:0061357 | positive regulation of Wnt protein secretion(GO:0061357) |
| 0.1 | 0.3 | GO:0046963 | 3'-phosphoadenosine 5'-phosphosulfate transport(GO:0046963) 3'-phospho-5'-adenylyl sulfate transmembrane transport(GO:1902559) |
| 0.1 | 0.1 | GO:0048370 | lateral mesoderm morphogenesis(GO:0048369) lateral mesoderm formation(GO:0048370) lateral mesodermal cell differentiation(GO:0048371) lateral mesodermal cell fate commitment(GO:0048372) lateral mesodermal cell fate specification(GO:0048377) regulation of lateral mesodermal cell fate specification(GO:0048378) |
| 0.1 | 0.3 | GO:0070681 | glutaminyl-tRNAGln biosynthesis via transamidation(GO:0070681) |
| 0.1 | 0.8 | GO:0010993 | regulation of ubiquitin homeostasis(GO:0010993) free ubiquitin chain polymerization(GO:0010994) |
| 0.1 | 0.3 | GO:0033615 | mitochondrial proton-transporting ATP synthase complex assembly(GO:0033615) |
| 0.1 | 0.2 | GO:0002188 | translation reinitiation(GO:0002188) |
| 0.1 | 0.2 | GO:0003245 | cardiac muscle tissue growth involved in heart morphogenesis(GO:0003245) |
| 0.1 | 0.3 | GO:0097211 | response to gonadotropin-releasing hormone(GO:0097210) cellular response to gonadotropin-releasing hormone(GO:0097211) |
| 0.1 | 0.2 | GO:0035262 | left ventricular cardiac muscle tissue morphogenesis(GO:0003220) cell proliferation involved in heart valve morphogenesis(GO:0003249) regulation of cell proliferation involved in heart valve morphogenesis(GO:0003250) gonad morphogenesis(GO:0035262) |
| 0.1 | 0.2 | GO:0003274 | endocardial cushion fusion(GO:0003274) |
| 0.0 | 0.2 | GO:1902732 | positive regulation of chondrocyte proliferation(GO:1902732) |
| 0.0 | 0.7 | GO:0008090 | retrograde axonal transport(GO:0008090) |
| 0.0 | 0.2 | GO:0061015 | snRNA import into nucleus(GO:0061015) |
| 0.0 | 0.3 | GO:0006689 | ganglioside catabolic process(GO:0006689) |
| 0.0 | 0.2 | GO:0006668 | sphinganine-1-phosphate metabolic process(GO:0006668) |
| 0.0 | 0.4 | GO:0006398 | mRNA 3'-end processing by stem-loop binding and cleavage(GO:0006398) |
| 0.0 | 0.4 | GO:0097267 | omega-hydroxylase P450 pathway(GO:0097267) |
| 0.0 | 0.1 | GO:0032915 | positive regulation of transforming growth factor beta2 production(GO:0032915) |
| 0.0 | 0.1 | GO:0045659 | regulation of neutrophil differentiation(GO:0045658) negative regulation of neutrophil differentiation(GO:0045659) |
| 0.0 | 0.2 | GO:0070124 | mitochondrial translational initiation(GO:0070124) |
| 0.0 | 0.1 | GO:1903248 | regulation of cellular amine catabolic process(GO:0033241) negative regulation of cellular amine catabolic process(GO:0033242) negative regulation of the force of heart contraction(GO:0098736) regulation of arginine catabolic process(GO:1900081) negative regulation of arginine catabolic process(GO:1900082) regulation of citrulline biosynthetic process(GO:1903248) negative regulation of citrulline biosynthetic process(GO:1903249) negative regulation of cellular amino acid biosynthetic process(GO:2000283) |
| 0.0 | 0.4 | GO:0035766 | cell chemotaxis to fibroblast growth factor(GO:0035766) endothelial cell chemotaxis to fibroblast growth factor(GO:0035768) regulation of cell chemotaxis to fibroblast growth factor(GO:1904847) regulation of endothelial cell chemotaxis to fibroblast growth factor(GO:2000544) |
| 0.0 | 0.1 | GO:0035574 | histone H4-K20 demethylation(GO:0035574) |
| 0.0 | 0.2 | GO:0006311 | meiotic gene conversion(GO:0006311) regulation of reciprocal meiotic recombination(GO:0010520) |
| 0.0 | 0.2 | GO:0070940 | dephosphorylation of RNA polymerase II C-terminal domain(GO:0070940) |
| 0.0 | 0.3 | GO:0006572 | tyrosine catabolic process(GO:0006572) |
| 0.0 | 0.2 | GO:0030311 | poly-N-acetyllactosamine metabolic process(GO:0030309) poly-N-acetyllactosamine biosynthetic process(GO:0030311) |
| 0.0 | 0.2 | GO:1904491 | protein localization to ciliary transition zone(GO:1904491) |
| 0.0 | 0.7 | GO:2000096 | positive regulation of Wnt signaling pathway, planar cell polarity pathway(GO:2000096) |
| 0.0 | 0.1 | GO:0070563 | negative regulation of vitamin D receptor signaling pathway(GO:0070563) |
| 0.0 | 0.3 | GO:0070777 | D-aspartate transport(GO:0070777) D-aspartate import(GO:0070779) |
| 0.0 | 0.1 | GO:0000821 | regulation of arginine metabolic process(GO:0000821) |
| 0.0 | 0.5 | GO:0038203 | TORC2 signaling(GO:0038203) |
| 0.0 | 1.0 | GO:0035162 | embryonic hemopoiesis(GO:0035162) |
| 0.0 | 0.1 | GO:0090158 | endoplasmic reticulum membrane organization(GO:0090158) |
| 0.0 | 0.2 | GO:0097368 | establishment of Sertoli cell barrier(GO:0097368) |
| 0.0 | 0.1 | GO:0046108 | uridine metabolic process(GO:0046108) |
| 0.0 | 0.1 | GO:1901491 | negative regulation of lymphangiogenesis(GO:1901491) |
| 0.0 | 0.1 | GO:0048619 | embryonic genitalia morphogenesis(GO:0030538) embryonic hindgut morphogenesis(GO:0048619) |
| 0.0 | 0.2 | GO:0070966 | nuclear-transcribed mRNA catabolic process, no-go decay(GO:0070966) |
| 0.0 | 0.1 | GO:0050960 | detection of temperature stimulus involved in thermoception(GO:0050960) response to capsazepine(GO:1901594) |
| 0.0 | 0.1 | GO:0009820 | alkaloid metabolic process(GO:0009820) |
| 0.0 | 0.1 | GO:0060168 | positive regulation of adenosine receptor signaling pathway(GO:0060168) |
| 0.0 | 0.1 | GO:0097187 | dentinogenesis(GO:0097187) |
| 0.0 | 0.1 | GO:1903371 | regulation of endoplasmic reticulum tubular network organization(GO:1903371) |
| 0.0 | 0.1 | GO:1904976 | response to bleomycin(GO:1904975) cellular response to bleomycin(GO:1904976) |
| 0.0 | 0.1 | GO:0072086 | specification of loop of Henle identity(GO:0072086) pattern specification involved in metanephros development(GO:0072268) |
| 0.0 | 0.3 | GO:1904321 | response to forskolin(GO:1904321) cellular response to forskolin(GO:1904322) |
| 0.0 | 0.2 | GO:1901295 | positive regulation of ephrin receptor signaling pathway(GO:1901189) regulation of canonical Wnt signaling pathway involved in cardiac muscle cell fate commitment(GO:1901295) positive regulation of canonical Wnt signaling pathway involved in cardiac muscle cell fate commitment(GO:1901297) regulation of canonical Wnt signaling pathway involved in heart development(GO:1905066) positive regulation of canonical Wnt signaling pathway involved in heart development(GO:1905068) |
| 0.0 | 0.2 | GO:2000795 | negative regulation of epithelial cell proliferation involved in lung morphogenesis(GO:2000795) |
| 0.0 | 0.5 | GO:0006004 | fucose metabolic process(GO:0006004) |
| 0.0 | 0.2 | GO:0031120 | snRNA pseudouridine synthesis(GO:0031120) |
| 0.0 | 0.2 | GO:0046598 | positive regulation of viral entry into host cell(GO:0046598) |
| 0.0 | 0.2 | GO:0045329 | carnitine biosynthetic process(GO:0045329) |
| 0.0 | 0.1 | GO:0071596 | ubiquitin-dependent protein catabolic process via the N-end rule pathway(GO:0071596) |
| 0.0 | 0.3 | GO:0042424 | phenol-containing compound catabolic process(GO:0019336) catechol-containing compound catabolic process(GO:0019614) catecholamine catabolic process(GO:0042424) |
| 0.0 | 0.1 | GO:0021779 | oligodendrocyte cell fate specification(GO:0021778) oligodendrocyte cell fate commitment(GO:0021779) glial cell fate specification(GO:0021780) |
| 0.0 | 0.1 | GO:0030573 | bile acid catabolic process(GO:0030573) |
| 0.0 | 0.1 | GO:0006433 | glutamyl-tRNA aminoacylation(GO:0006424) prolyl-tRNA aminoacylation(GO:0006433) |
| 0.0 | 0.1 | GO:0002101 | tRNA wobble cytosine modification(GO:0002101) |
| 0.0 | 0.1 | GO:0080009 | mRNA methylation(GO:0080009) |
| 0.0 | 0.1 | GO:1905232 | cellular response to L-glutamate(GO:1905232) |
| 0.0 | 0.0 | GO:0045763 | negative regulation of cellular amino acid metabolic process(GO:0045763) |
| 0.0 | 0.2 | GO:0006228 | UTP biosynthetic process(GO:0006228) |
| 0.0 | 0.1 | GO:1902774 | late endosome to lysosome transport(GO:1902774) |
| 0.0 | 0.1 | GO:0072156 | distal tubule morphogenesis(GO:0072156) |
| 0.0 | 0.1 | GO:0042713 | sperm ejaculation(GO:0042713) |
| 0.0 | 0.1 | GO:0032474 | otolith morphogenesis(GO:0032474) |
| 0.0 | 0.0 | GO:0002933 | lipid hydroxylation(GO:0002933) |
| 0.0 | 0.1 | GO:0046415 | urate metabolic process(GO:0046415) |
| 0.0 | 0.0 | GO:0003363 | lamellipodium assembly involved in ameboidal cell migration(GO:0003363) extension of a leading process involved in cell motility in cerebral cortex radial glia guided migration(GO:0021816) |
| 0.0 | 0.2 | GO:0045086 | positive regulation of interleukin-2 biosynthetic process(GO:0045086) |
| 0.0 | 0.0 | GO:1905205 | positive regulation of cardiac muscle adaptation(GO:0010615) positive regulation of cardiac muscle hypertrophy in response to stress(GO:1903244) positive regulation of connective tissue replacement(GO:1905205) |
| 0.0 | 0.0 | GO:1905224 | clathrin-coated pit assembly(GO:1905224) |
| 0.0 | 0.2 | GO:0070257 | positive regulation of mucus secretion(GO:0070257) |
| 0.0 | 0.2 | GO:0007191 | adenylate cyclase-activating dopamine receptor signaling pathway(GO:0007191) |
| 0.0 | 0.1 | GO:0045204 | MAPK export from nucleus(GO:0045204) |
| 0.0 | 0.2 | GO:0048172 | regulation of short-term neuronal synaptic plasticity(GO:0048172) |
| 0.0 | 0.1 | GO:0021759 | globus pallidus development(GO:0021759) |
| 0.0 | 0.4 | GO:0043968 | histone H2A acetylation(GO:0043968) |
| 0.0 | 0.1 | GO:0035754 | B cell chemotaxis(GO:0035754) |
Gene overrepresentation in cellular_component category:
| Log-likelihood per target | Total log-likelihood | Term | Description |
|---|---|---|---|
| 0.3 | 1.4 | GO:0034669 | integrin alpha4-beta7 complex(GO:0034669) |
| 0.1 | 0.7 | GO:0031673 | H zone(GO:0031673) |
| 0.1 | 0.3 | GO:0030956 | glutamyl-tRNA(Gln) amidotransferase complex(GO:0030956) |
| 0.1 | 0.2 | GO:0032302 | MutSbeta complex(GO:0032302) |
| 0.1 | 0.2 | GO:0048179 | activin receptor complex(GO:0048179) |
| 0.0 | 0.4 | GO:0032777 | Piccolo NuA4 histone acetyltransferase complex(GO:0032777) |
| 0.0 | 0.1 | GO:0036396 | MIS complex(GO:0036396) mRNA editing complex(GO:0045293) |
| 0.0 | 0.3 | GO:0072687 | meiotic spindle(GO:0072687) |
| 0.0 | 0.1 | GO:0016514 | SWI/SNF complex(GO:0016514) |
| 0.0 | 0.6 | GO:0036038 | MKS complex(GO:0036038) |
| 0.0 | 0.4 | GO:0061700 | GATOR2 complex(GO:0061700) |
| 0.0 | 0.2 | GO:0032444 | activin responsive factor complex(GO:0032444) |
| 0.0 | 0.5 | GO:0017101 | aminoacyl-tRNA synthetase multienzyme complex(GO:0017101) |
| 0.0 | 0.2 | GO:0031429 | box H/ACA snoRNP complex(GO:0031429) box H/ACA RNP complex(GO:0072588) |
| 0.0 | 0.4 | GO:0005847 | mRNA cleavage and polyadenylation specificity factor complex(GO:0005847) |
| 0.0 | 0.2 | GO:0002193 | MAML1-RBP-Jkappa- ICN1 complex(GO:0002193) |
| 0.0 | 0.2 | GO:0036157 | outer dynein arm(GO:0036157) |
| 0.0 | 0.7 | GO:0032590 | dendrite membrane(GO:0032590) |
| 0.0 | 0.1 | GO:0070436 | Grb2-EGFR complex(GO:0070436) |
| 0.0 | 0.2 | GO:0030478 | actin cap(GO:0030478) |
| 0.0 | 0.5 | GO:0005614 | interstitial matrix(GO:0005614) |
| 0.0 | 0.1 | GO:0000275 | mitochondrial proton-transporting ATP synthase complex, catalytic core F(1)(GO:0000275) |
| 0.0 | 0.1 | GO:0097442 | CA3 pyramidal cell dendrite(GO:0097442) |
| 0.0 | 0.1 | GO:0000799 | nuclear condensin complex(GO:0000799) |
| 0.0 | 0.6 | GO:0000421 | autophagosome membrane(GO:0000421) |
| 0.0 | 0.1 | GO:0034667 | integrin alpha3-beta1 complex(GO:0034667) |
| 0.0 | 0.2 | GO:0070937 | CRD-mediated mRNA stability complex(GO:0070937) |
| 0.0 | 0.2 | GO:0031462 | Cul2-RING ubiquitin ligase complex(GO:0031462) Cul4A-RING E3 ubiquitin ligase complex(GO:0031464) |
| 0.0 | 0.1 | GO:0034673 | inhibin-betaglycan-ActRII complex(GO:0034673) |
Gene overrepresentation in molecular_function category:
| Log-likelihood per target | Total log-likelihood | Term | Description |
|---|---|---|---|
| 0.1 | 0.4 | GO:0004822 | isoleucine-tRNA ligase activity(GO:0004822) |
| 0.1 | 0.3 | GO:0004968 | gonadotropin-releasing hormone receptor activity(GO:0004968) |
| 0.1 | 0.3 | GO:0052794 | exo-alpha-(2->3)-sialidase activity(GO:0052794) exo-alpha-(2->6)-sialidase activity(GO:0052795) exo-alpha-(2->8)-sialidase activity(GO:0052796) |
| 0.1 | 0.3 | GO:0046964 | 3'-phosphoadenosine 5'-phosphosulfate transmembrane transporter activity(GO:0046964) |
| 0.1 | 0.3 | GO:0050567 | glutaminyl-tRNA synthase (glutamine-hydrolyzing) activity(GO:0050567) |
| 0.1 | 0.5 | GO:0070568 | guanylyltransferase activity(GO:0070568) |
| 0.1 | 0.2 | GO:0008336 | gamma-butyrobetaine dioxygenase activity(GO:0008336) |
| 0.1 | 0.2 | GO:0000406 | double-strand/single-strand DNA junction binding(GO:0000406) dinucleotide repeat insertion binding(GO:0032181) |
| 0.0 | 0.1 | GO:0016422 | mRNA (2'-O-methyladenosine-N6-)-methyltransferase activity(GO:0016422) |
| 0.0 | 0.2 | GO:0042781 | 3'-tRNA processing endoribonuclease activity(GO:0042781) |
| 0.0 | 0.1 | GO:0036487 | nitric-oxide synthase inhibitor activity(GO:0036487) |
| 0.0 | 0.1 | GO:1901702 | urate transmembrane transporter activity(GO:0015143) salt transmembrane transporter activity(GO:1901702) |
| 0.0 | 0.2 | GO:0016361 | activin receptor activity, type I(GO:0016361) |
| 0.0 | 0.1 | GO:0001069 | regulatory region RNA binding(GO:0001069) |
| 0.0 | 0.1 | GO:0035575 | histone demethylase activity (H4-K20 specific)(GO:0035575) |
| 0.0 | 0.1 | GO:0098821 | BMP receptor activity(GO:0098821) |
| 0.0 | 0.2 | GO:0022850 | serotonin-gated cation channel activity(GO:0022850) |
| 0.0 | 0.3 | GO:0015501 | glutamate:sodium symporter activity(GO:0015501) |
| 0.0 | 0.3 | GO:0016206 | catechol O-methyltransferase activity(GO:0016206) |
| 0.0 | 0.5 | GO:0047499 | calcium-independent phospholipase A2 activity(GO:0047499) |
| 0.0 | 0.1 | GO:0018685 | alkane 1-monooxygenase activity(GO:0018685) tocopherol omega-hydroxylase activity(GO:0052870) alpha-tocopherol omega-hydroxylase activity(GO:0052871) 20-hydroxy-leukotriene B4 omega oxidase activity(GO:0097258) 20-aldehyde-leukotriene B4 20-monooxygenase activity(GO:0097259) |
| 0.0 | 0.3 | GO:0031821 | G-protein coupled serotonin receptor binding(GO:0031821) |
| 0.0 | 0.1 | GO:0004850 | uridine phosphorylase activity(GO:0004850) |
| 0.0 | 0.2 | GO:0016262 | protein N-acetylglucosaminyltransferase activity(GO:0016262) |
| 0.0 | 0.5 | GO:0031628 | opioid receptor binding(GO:0031628) |
| 0.0 | 0.1 | GO:0003956 | NAD(P)+-protein-arginine ADP-ribosyltransferase activity(GO:0003956) |
| 0.0 | 0.2 | GO:0008158 | hedgehog receptor activity(GO:0008158) |
| 0.0 | 0.2 | GO:0008865 | glucokinase activity(GO:0004340) hexokinase activity(GO:0004396) fructokinase activity(GO:0008865) mannokinase activity(GO:0019158) |
| 0.0 | 0.1 | GO:0097603 | temperature-gated ion channel activity(GO:0097603) |
| 0.0 | 0.1 | GO:0004594 | pantothenate kinase activity(GO:0004594) |
| 0.0 | 0.1 | GO:0016314 | phosphatidylinositol-3,4,5-trisphosphate 3-phosphatase activity(GO:0016314) |
| 0.0 | 0.1 | GO:0033829 | O-fucosylpeptide 3-beta-N-acetylglucosaminyltransferase activity(GO:0033829) |
| 0.0 | 0.1 | GO:0033265 | acetylcholinesterase activity(GO:0003990) choline binding(GO:0033265) |
| 0.0 | 0.1 | GO:0052642 | lysophosphatidic acid phosphatase activity(GO:0052642) |
| 0.0 | 0.2 | GO:0034513 | box H/ACA snoRNA binding(GO:0034513) |
| 0.0 | 0.1 | GO:0004827 | glutamate-tRNA ligase activity(GO:0004818) proline-tRNA ligase activity(GO:0004827) |
| 0.0 | 0.4 | GO:0070330 | aromatase activity(GO:0070330) |
| 0.0 | 0.4 | GO:0044548 | S100 protein binding(GO:0044548) |
| 0.0 | 0.1 | GO:0015333 | peptide:proton symporter activity(GO:0015333) proton-dependent peptide secondary active transmembrane transporter activity(GO:0022897) |
| 0.0 | 0.2 | GO:0008420 | CTD phosphatase activity(GO:0008420) |
| 0.0 | 0.7 | GO:0051010 | microtubule plus-end binding(GO:0051010) |
| 0.0 | 0.1 | GO:0004800 | thyroxine 5'-deiodinase activity(GO:0004800) |
| 0.0 | 0.2 | GO:0038036 | sphingosine-1-phosphate receptor activity(GO:0038036) |
| 0.0 | 0.1 | GO:0070728 | leucine binding(GO:0070728) |
| 0.0 | 0.4 | GO:0008409 | 5'-3' exonuclease activity(GO:0008409) |
| 0.0 | 1.4 | GO:0001618 | virus receptor activity(GO:0001618) |
| 0.0 | 0.1 | GO:0005057 | receptor signaling protein activity(GO:0005057) |
| 0.0 | 0.1 | GO:0016428 | tRNA (cytosine-5-)-methyltransferase activity(GO:0016428) |
Gene overrepresentation in C2:CP category:
| Log-likelihood per target | Total log-likelihood | Term | Description |
|---|---|---|---|
| 0.0 | 1.4 | PID INTEGRIN5 PATHWAY | Beta5 beta6 beta7 and beta8 integrin cell surface interactions |
| 0.0 | 0.6 | PID S1P META PATHWAY | Sphingosine 1-phosphate (S1P) pathway |
| 0.0 | 0.4 | PID ALK2 PATHWAY | ALK2 signaling events |
| 0.0 | 0.7 | ST WNT BETA CATENIN PATHWAY | Wnt/beta-catenin Pathway |
Gene overrepresentation in C2:CP:REACTOME category:
| Log-likelihood per target | Total log-likelihood | Term | Description |
|---|---|---|---|
| 0.1 | 0.3 | REACTOME HORMONE LIGAND BINDING RECEPTORS | Genes involved in Hormone ligand-binding receptors |
| 0.0 | 0.4 | REACTOME FGFR4 LIGAND BINDING AND ACTIVATION | Genes involved in FGFR4 ligand binding and activation |
| 0.0 | 0.5 | REACTOME ADENYLATE CYCLASE INHIBITORY PATHWAY | Genes involved in Adenylate cyclase inhibitory pathway |
| 0.0 | 1.4 | REACTOME IMMUNOREGULATORY INTERACTIONS BETWEEN A LYMPHOID AND A NON LYMPHOID CELL | Genes involved in Immunoregulatory interactions between a Lymphoid and a non-Lymphoid cell |
| 0.0 | 0.4 | REACTOME PROCESSING OF INTRONLESS PRE MRNAS | Genes involved in Processing of Intronless Pre-mRNAs |
| 0.0 | 0.5 | REACTOME CYTOSOLIC TRNA AMINOACYLATION | Genes involved in Cytosolic tRNA aminoacylation |
| 0.0 | 0.2 | REACTOME PRESYNAPTIC NICOTINIC ACETYLCHOLINE RECEPTORS | Genes involved in Presynaptic nicotinic acetylcholine receptors |